Open Access
Methodology
Selecting patients for randomized trials: a systematic approach
based on risk group
Andrew J Vickers*
1, Barry S Kramer
2and Stuart G Baker
3Address: 1Department of Epidemiology and Biostatistics, Memorial Sloan-Kettering Cancer Center, New York, USA, 2Office of Disease Prevention,
National Institutes of Health, Bethesda, Maryland, USA and 3Biometry Research Group, Division of Cancer Prevention, National Cancer Institute,
National Institutes of Health, Bethesda, Maryland, USA
Email: Andrew J Vickers* - [email protected]; Barry S Kramer - [email protected]; Stuart G Baker - [email protected] * Corresponding author
Abstract
Background: A key aspect of randomized trial design is the choice of risk group. Some trials include patients from the entire at-risk population, others accrue only patients deemed to be at increased risk. We present a simple statistical approach for choosing between these approaches. The method is easily adapted to determine which of several competing definitions of high risk is optimal.
Method: We treat eligibility criteria for a trial, such as a smoking history, as a prediction rule associated with a certain sensitivity (the number of patients who have the event and who are classified as high risk divided by the total number patients who have an event) and specificity (the number of patients who do not have an event and who do not meet criteria for high risk divided by the total number of patients who do not have an event). We then derive simple formulae to determine the proportion of patients receiving intervention, and the proportion who experience an event, where either all patients or only those at high risk are treated. We assume that the relative risk associated with intervention is the same over all choices of risk group. The proportion of events and interventions are combined using a net benefit approach and net benefit compared between strategies.
Results: We applied our method to design a trial of adjuvant therapy after prostatectomy. We were able to demonstrate that treating a high risk group was superior to treating all patients; choose the optimal definition of high risk; test the robustness of our results by sensitivity analysis. Our results had a ready clinical interpretation that could immediately aid trial design.
Conclusion: The choice of risk group in randomized trials is usually based on rather informal methods. Our simple method demonstrates that this decision can be informed by simple statistical analyses.
Background
Protocols of randomized trials specify inclusion and exclusion criteria to determine the population under study. Exclusion criteria typically focus on identifying
sub-jects who might be harmed by the study intervention, those for whom benefit is doubtful and those who are unlikely to provide useful data. Inclusion criteria tend to focus on risk: all trials identify the population at risk for Published: 05 October 2006
Trials 2006, 7:30 doi:10.1186/1745-6215-7-30
Received: 08 June 2006 Accepted: 05 October 2006
This article is available from: http://www.trialsjournal.com/content/7/1/30
© 2006 Vickers et al; licensee BioMed Central Ltd.
the study event, some trials additionally specify criteria to define a study population at high-risk. For example, a trial comparing recurrence rates between two approaches to prostatectomy will specify only that patients with local-ized prostate cancer are eligible; a trial to determine the effects of adjuvant therapy might further restrict eligibility to patients with locally advanced cancer who are at high risk of recurrence. In some cases trialists studying a similar question have reached different conclusions as to whether to include the whole at-risk population or only a high-risk subgroup. The PLCO trial, for instance, includes all older individuals in a study of lung cancer screening [1], whereas the National Lung Screening Trial[2] includes only smokers, or recent quitters, with a smoking history of 30 pack-years or more.
In this paper, we present a simple statistical approach for determining whether trialists should use a "whole popu-lation" or "high-risk group" approach. The results of the method have a ready clinical interpretation that can immediately aid trial design, moreover, the method is eas-ily adapted to determine which of several competing def-initions of high-risk is optimal. In a previous paper, which focused on screening and prevention, two of us argued that the population accrued to a trial should be the same as that to whom the intervention will be applied in prac-tice[3]. Thus the decision whether to include all members of an eligible population, or just a high-risk sub-group, should depend on the relative benefit of these alternative strategies were they to be clinically applied after the com-pletion of a trial indicating an effect of the intervention. We therefore model benefits of alternative strategies in a hypothetical population in order to determine the opti-mal approach.
Method
Our method is based on the assumption that interven-tions proven in randomized trials will be offered to eligi-ble patients similar to those studied in the trial. For example, we assume that if a trial accruing patients with locally advanced prostate cancer demonstrates effective-ness of adjuvant therapy, such treatment will subse-quently be offered to patients with locally advanced but not organ-confined disease. We therefore compare the predicted outcome of treating all at-risk patients in the population at large to the outcome of treating only the high-risk subgroup. We then recommend the approach with the better outcome to determine the inclusion crite-ria for the randomized tcrite-rial.
Outcome is defined in terms of "net benefit" in the eligi-ble population. Net benefit is a concept often used in eco-nomic analysis and is simply benefits minus harms. In the case of a medical intervention, "benefits" are associated with reduction in the event rate compared to no
addi-tional treatment: in an adjuvant therapy trial, for instance, benefit would be a reduction in cancer recurrences or deaths compared to surgery alone. "Harms" are associated with the intervention itself: side-effects, costs, inconven-ience and so on. To assess the relative outcome of the whole population and high-risk approach, we therefore need to calculate the proportion of patients who would be treated, and the reduction in event rate, for each approach. For the whole population approach this is straightfor-ward: the proportion of patients treated is 100% and the reduction in event rate is simply the event rate in the absence of intervention multiplied by the anticipated rel-ative risk of the event with versus without intervention.
To determine intervention and event rates for the approach of treating only high-risk patients, consider that an investigator proposing a trial on high-risk patients must propose specific criteria to determine high-risk. This might involve a single risk factor (e.g. non-organ confined disease) or a threshold probability on a multivariable pre-diction model (or "nomogram") including a variety of risk factors (e.g. stage, grade, PSA [4]). Such criteria can be seen as a prediction tool: individuals who meet the criteria are thought to be more likely to experience a disease-related event than those who do not meet the criteria. We can then calculate the sensitivity and specificity of this prediction tool. To define "sensitivity" we use as the numerator the number of individuals in the eligible pop-ulation who both have the event (in the absence of inter-vention) and who are classified as high risk; the denominator is the total number of patients who have the event. "Specificity" is comparably defined by using for the numerator the number of individuals in the eligible pop-ulation who do not have the event and who do not meet the criteria for high risk; the denominator is the total number who do not have the event (see table 1 for illus-trative data). Data on sensitivity, specificity and event rate may be obtained from epidemiologic data sets or from analyzing the control arm of prior randomized trials.
Table 1: Relationship between criteria for defining a "high-risk" sub-group and whether a patient has an event during a clinical trial.
Event?
Yes No
Meet criteria for "high-risk"? Yes 396 624
No 632 3,799
Hypothetical data are given for the purposes of illustration.
In the Appendix [see Additional file 1], we derive the fol-lowing formulae for the intervention and event rates when selecting a high-risk group.
Intervention rate: the anticipated proportion of eligible population receiving intervention when the intervention is given only to high risk subjects
= Event rate in the absence of intervention × sensitivity + (1 – Event rate in the absence of intervention) × (1 – spe-cificity)
Event rate: the anticipated proportion of eligible popula-tion who have the event when intervenpopula-tion given to the high risk group:
= Event rate in the absence of intervention × sensitivity × relative risk + Event rate in the absence of intervention × (1 – sensitivity)
Decrease in event rate due to intervention:
= Event rate in the absence of intervention – Event rate when intervention given to high risk group
Where:
Event: a negative medical outcome such as disease recur-rence or death occurring within the projected time frame of the trial
Event rate in the absence of intervention: expected pro-portion of individuals in the eligible population who will have the event
Sensitivity: numerator: number of individuals in the eli-gible population who both have the event (in the absence of intervention) and who are classified as high risk; denominator: the total number of patients who have the event.
Specificity: numerator: number of individuals in the eli-gible population who do not have the event and who do not meet the criteria for high risk; denominator: total number who do not have the event.
Relative risk: relative risk of the event with versus without intervention
As described above, net benefit is benefit minus harm, where benefit is related to the number of events and harm to the number of interventions. To formulate net benefit precisely, it is necessary to put benefits and harms on the same scale. The problem is that events and interventions are not equivalent: an event, such as a prostate cancer
recurrence, is generally considered worse than an inter-vention, such as adjuvant therapy. Just how much worse an event is considered than an intervention will vary from case to case. A common way of converting between events and interventionsis the "number-needed-to-treat" (NNT). We define the threshold NNT (NNTt) as the maximum number of patients that a clinician would treat to prevent one event. The NNTt may be based on an informal subjec-tive judgment; alternasubjec-tively, methods have been described in the literature to derive NNTt based on the relative harm associated with intervention and an event[5]. NNTt can be thought of in economic terms as the amount we would pay, in interventions, to avoid one event. As such, NNTt is independent of the event rate. Hence we define:
Net benefit = decrease in event rate – intervention rate ÷ NNTt
Note that the units of the left and right terms in the net benefit equation are the same: NNTt is in units of interven-tion rate divided by event rate, so the units are in terms of event rates.
We propose calculating net benefit for the strategy of treat-ing all patients and for treattreat-ing only the high-risk group. The approach with the highest net benefit in the eligible population after completion of the trial is chosen for trial design.
Illustrative example
A group of investigators wish to investigate whether adju-vant therapy can reduce the risk of recurrence after radical prostatectomy. They plan to randomize patients to sur-gery alone or sursur-gery with hormonal therapy and follow patients for five years to determine the proportion who recur. About 20% of all prostatectomy patients recur within 5 years (i.e. the event rate in the absence of inter-vention) and the expected effect of adjuvant therapy is a relative risk of 0.75. Discussion with clinicians and patients suggest an NNTt of 100 for prostate cancer death, that is, if 100 or fewer patients had to be treated with adju-vant therapy to prevent one death, it would be considered worth taking; if more than 100 had to take the agent to prevent one death, the costs, side-effects, risks and incon-venience of the drug would be seen to outweigh its bene-fits. As only approximately one in three patients who recur after prostatectomy die from disease, the NNTt for the study endpoint of recurrence is 33.
imag-ine that our group of investigators disagree as to the opti-mal threshold: whilst one investigator wishes to define patients as "high risk" if they have 50% or greater risk of recurrence, another argues that the threshold should be set much lower, at 10%, in order to ensure that most patients who actually do recur would be eligible. Mean-while, the drug company argues that prostate cancer is an unpredictable disease and that the investigators should keep an open mind about whether to accrue all prostatec-tomy patients to the trial. Note that although the Kattan nomogram is a multivariate model, this is not a require-ment of our approach: eligibility criteria can be deter-mined by a model, by a single risk factor – such as a smoking history of at least 30 pack-years – or a combina-tion of risk factors, such as including patients with either high stage cancer or a positive surgical margin.
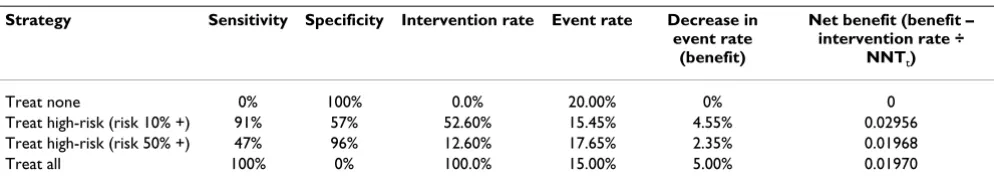
We obtained from the author data on the sensitivity and specificity of the Kattan nomogram at various cut-points. Table 2 gives the intervention rate, event rate, decrease in event rate from intervention and the net benefit for both the different high-risk categories and the strategy of treat-ing all patients. Note that the event rate is not that observed in the trial, but that in the population as a whole, were the intervention to be applied in practice.
As a worked example, we will look at the strategy of treat-ing only patients with a risk of 50% or more. The formula for the intervention rate is: Event rate in the absence of intervention × sensitivity + (1 – Event rate in the absence of intervention) × (1 – specificity), i.e., 20% × 47% + 80% × 4% = 12.6%. The formula for the event rate after the intervention is applied to high-risk subjects is: Event rate in the absence of intervention × sensitivity × relative risk + Event rate in the absence of intervention × (1 – sensitivity) or 20% × 47% × 0.75 + 20% × 53% = 17.65%. This is a decrease is event rate of 20% – 17.65% = 2.35%. The for-mula for net benefit is decrease in event rate – interven-tion rate ÷ NNTt giving 2.35% – 12.60% ÷ 33 = 0.01968 as the net benefit for the strategy of treating only men with a risk of 50% or more.
From the table, we can see that the highest net benefit is associated with treating only men with a nomogram pre-dicted risk of recurrence of 10% or more. We would rec-ommend using this as the eligibility criteria for the trial. One particular advantage of our approach is that net ben-efit has a simple clinical interpretation in terms of either a decrease in event rate while keeping the intervention rate constant or a decrease in the intervention rate while keep-ing the event rate constant. For example, the net benefit for the high-risk group is 0.0296 greater than that of not using adjuvant therapy in any patient. Thus the strategy of calculating a prediction for all patients and administering an intervention to those with a predicted risk of recur-rence ≥ 10% gives the same net benefit as a strategy (say, a change in surgical technique) that leads to the equiva-lent of about 3 fewer recurrences per 100 patients without any patients receiving adjuvant therapy. A similar calcula-tion can be conducted to determine the decrease in inter-vention rate for a constant event rate: in this case, the difference in net benefit is multiplied by the NNTt.
Sensitivity analysis
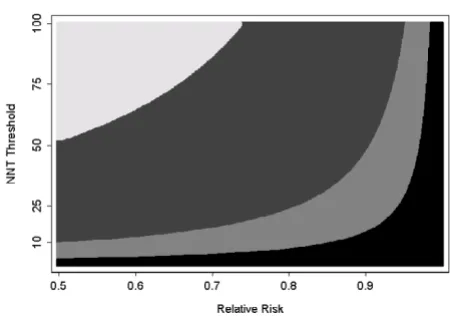
Any of the inputs required to calculate net benefit can be varied to determine whether this affects which strategy is deemed optimal. The event rate in the absence of the study intervention can usually be estimated (e.g. from cohort studies), and whether it is worth varying sensitivity and specificity will depend on the size and quality of the studies used to estimate these parameters. Hence the two most important sensitivity analyses concern NNTt – on the grounds that this is a judgment that can reasonably vary from individual to individual and place to place – and relative risk, on the grounds that this is unknown dur-ing trial planndur-ing.
[image:4.612.56.553.609.699.2]Figure 1 shows the optimal strategy for different combina-tions of NNTt and relative risk. In accordance with intui-tion, figure 1 shows that the more effective and tolerable the intervention, the more likely we are to selecting inter-vening in all patients rather than just a high-risk group; the less effective and tolerable the intervention, the more likely we are to chose to treat only a high-risk group, or
Table 2: Calculations to determine whether to treat the whole population or just a high-risk group.
Strategy Sensitivity Specificity Intervention rate Event rate Decrease in
event rate (benefit)
Net benefit (benefit – intervention rate ÷
NNTt)
Treat none 0% 100% 0.0% 20.00% 0% 0
Treat high-risk (risk 10% +) 91% 57% 52.60% 15.45% 4.55% 0.02956 Treat high-risk (risk 50% +) 47% 96% 12.60% 17.65% 2.35% 0.01968
Treat all 100% 0% 100.0% 15.00% 5.00% 0.01970
The relative risk of the intervention is 0.75, the NNTt is 33 and the event rate in the absence of intervention is 20%. The decrease in event rate is
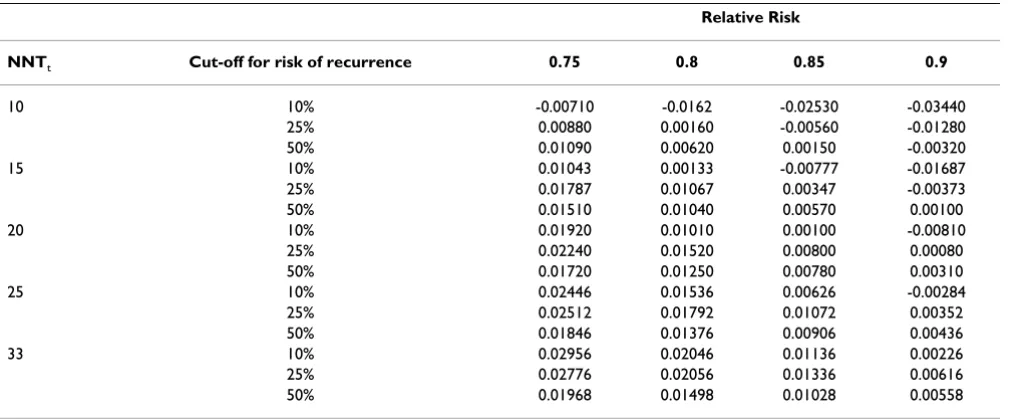
no-one at all. Let us imagine that one investigator is of the opinion that interventions are rarely as effective or tolera-ble as hoped. If we reduce relative risk or NNTt from the base scenario of 0.75 and 33, we sometimes choose a cut-off of 10% and other times a cut-cut-off of 50%. The investi-gator therefore suggests examining a cut-off of 25% to define high-risk. This is associated with a sensitivity of 72% and a specificity of 84%. The net benefit for this def-inition of high-risk is shown in table 3 for various combi-nations of NNTt and relative risk. The new definition is superior for most scenarios. The investigators decide to run the trial using a predicted risk of recurrence of at least 25% as the inclusion criterion for the trial.
Our method assumes that, following a positive trial result, all or nearly all high risk patients will receive the interven-tion, and none, or nearly none, of the low risk population will be treated. This might be seen as a somewhat unreal-istic ideal of evidence-based medical practice. However, it is easy to adjust estimates of event rates and intervention rates in the presence of variation from this standard by specifying a proportion of high risk patients are not treated and a proportion of low risk patients who inap-propriately receive intervention (see Appendix [Addi-tional file 1] for formulae).
Applying the method to other sample scenarios
In tables 4 and 5, we create a number of different scenar-ios to illustrate the circumstances in which it is preferable
to select a high-risk group for intervention. Table 4 shows that the value of selecting a high-risk group, in compari-son to the whole population approach, is greater as the event rate decreases. In table 5, the value of selecting high-risk patients is associated with lower tolerability or lesser effectiveness of the intervention. If an intervention is either very effective or highly tolerable, the high-risk approach is only of benefit if selection criteria are highly sensitive, in other words, in the case that nearly all those who could benefit from the intervention receive it. Con-versely, if the effectiveness of the intervention is moderate, or it is poorly tolerated, selection criteria must be specific, that is, only those patients who would benefit are selected. These considerations suggest that focusing on a high-risk group might be of particular value for screening or preven-tion trials, as these typically involve low event rates, inter-ventions of moderate effectiveness and a population with a low tolerance for adverse treatment effects.
The final two rows of table 5 demonstrate the value of a decision analytic approach to the problem of risk group selection. In one scenario, selection criteria that have near perfect sensitivity and specificity are useless because the intervention is highly effective and tolerable, and there-fore there is little downside to treating all patients. In another scenario, selection criteria that are only margin-ally better than random guessing should be used to select a high-risk group because intervening is of extremely mar-ginal benefit.
Sample size considerations
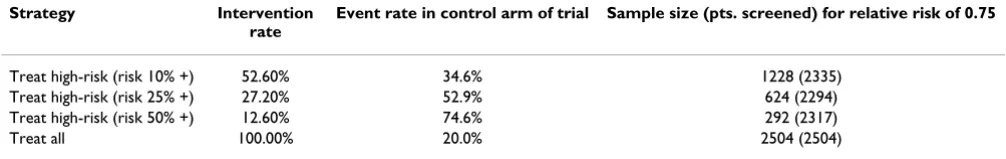
[image:5.612.65.290.90.251.2]We can derive additional simple formulae to help deter-mine sample size (see Appendix [Additional file 1]). The proportion of events in the control arm of the trial is: sen-sitivity × event rate in the absence of intervention ÷ inter-vention rate. This number can be entered into a standard sample size calculation for a difference between propor-tions. We can then calculate the number of patients that need to be screened as number of patients in trial ÷ inter-vention rate. Table 6 gives number of patients in a trial and number to be screened where sample size is calcu-lated assuming a 25% risk reduction from intervention. Sample size varies considerably between samples, although the number of patients who would need to be screened is reasonably constant. As a worked example, we will look at the first row, the strategy of including all patients with a risk of recurrence of 50% or more. The cal-culation for the intervention rate has already been described above. The formula for the event rate in the con-trol group of the trial is: sensitivity × event rate in the absence of intervention ÷ intervention rate, i.e. 47% (from table 2) × 20% ÷ 12.6% = 74.6%. To calculate the event rate in the treatment arm, this is multiplied by the relative risk, i.e. 74.6% × 0.75 = 55.95%. Using the sampsi func-tion on Stata 9.2 (Stata Corp., College Stafunc-tion, Texas), a Sensitivity analysis for a prostate cancer adjuvant trial
Figure 1
trial with 90% power to detect a difference at a signifi-cance level of 5% between an event rate of 74.6% and 55.95% requires 292 patients. As we include 12.6% of patients on trial (the intervention rate) to obtain 292 patients we would have to screen 292 ÷ 12.6% = 2317.
The general approach we suggest is only based on net ben-efit in the eligible population after completion of the trial, and does not take into account the sample size considera-tions. If there is an upper bound on the sample size due to budget constraints, the risk group selected should be that group with highest net benefit among those under consid-eration that satisfy the budget for the trial. Alternatively, one could consider a more complex calculation of net benefit subject to a constraint on total trial costs[6].
Discussion
Determining who should receive an intervention is a key aspect of medical practice. It is inevitable that, although some interventions should be applied to all members of
an at-risk population (e.g. antibiotics before surgery), oth-ers should be restricted to those at high-risk (e.g. β-block-ers before surgery). To our knowledge, no previous investigators have described a simple strategy for deter-mining whether a trial should accrue patients selected from the whole at-risk population or only to those from a high-risk subgroup. Moreover, criteria for determining the appropriate definition of high-risk subgroup have not been developed systematically, for example, by quantita-tively comparing different definitions.
[image:6.612.55.568.101.311.2]Accordingly, prior approaches to issues of patient selec-tion in randomized trials have been rather informal. For example, at a National Cancer Institute workshop on risk prediction models, it was reported that participants "repeatedly discussed the use of cancer risk prediction models for high-risk versus population approaches to can-cer prevention". Yet the only guidance given was that a population prevention strategy would be optimal unless a predictive model had "high discriminatory power" to
Table 4: Net benefit for treating high-risk and all patients, varying the event rate in the absence of intervention.
Event rate in the absence of intervention Net benefit (high-risk) Net benefit (treat all) Net benefit compared to treat all
50% 0.09713 0.12000 -0.02288
10% 0.01803 0.02000 -0.00198
7.5% 0.01308 0.01375 -0.00067
5% 0.00814 0.00750 0.00064
2.5% 0.00319 0.00125 0.00194
1% 0.00023 -0.00250 0.00273
[image:6.612.54.555.617.710.2]Results are for a scenario where relative risk = 0.75; sensitivity = 80%; specificity = 65% and NNTt = 200
Table 3: Sensitivity analysis. Net benefit when relative risk and NNTt are varied.
Relative Risk
NNTt Cut-off for risk of recurrence 0.75 0.8 0.85 0.9
10 10% -0.00710 -0.0162 -0.02530 -0.03440
25% 0.00880 0.00160 -0.00560 -0.01280
50% 0.01090 0.00620 0.00150 -0.00320
15 10% 0.01043 0.00133 -0.00777 -0.01687
25% 0.01787 0.01067 0.00347 -0.00373
50% 0.01510 0.01040 0.00570 0.00100
20 10% 0.01920 0.01010 0.00100 -0.00810
25% 0.02240 0.01520 0.00800 0.00080
50% 0.01720 0.01250 0.00780 0.00310
25 10% 0.02446 0.01536 0.00626 -0.00284
25% 0.02512 0.01792 0.01072 0.00352
50% 0.01846 0.01376 0.00906 0.00436
33 10% 0.02956 0.02046 0.01136 0.00226
25% 0.02776 0.02056 0.01336 0.00616
50% 0.01968 0.01498 0.01028 0.00558
The relative risk of the intervention is 0.75, the NNTt is 33 and the event rate in the absence of intervention is 20%. The decrease in event rate is
identify those who will develop a disease[7]. This begs the question of just how good a model has to be, and omits what we have demonstrated to be the key variables of the underlying event rate, intervention effectiveness and toler-ability.
A debate concerning the inclusion criteria for the National Lung Screening Trial is similarly illustrative. In the origi-nal trial protocol, the investigators set inclusion criteria of a 30 pack-year or greater smoking history and no more than 15 years since quitting[2]. No clear rationale was given for this threshold. Subsequently, a separate group of investigators created a risk prediction model for lung can-cer and argued that, because its predictive properties were well understood, this might be used to select patients for a clinical trial[2]. However, these investigators did not demonstrate clearly that any specific set of criteria derived from their model was superior to those used in the trial.
Given the apparent advantages of our method, we should discuss some of its limitations. One important assump-tion of the method is that the relative risk for intervenassump-tion versus no intervention is constant over the choice of risk groups. Generally speaking, we do not know whether this is true: indeed, two of us have previously used possible inconstancy of relative risk to argue against accruing only high-risk patients and then applying the results to the whole eligible population[3]. However, we think there is
an important difference between using a certain assump-tion to help design a trial and using it to make a clinical decision. In case of a clinical decision about treatment, patients could be harmed if assumptions about relative risk do not hold. We would therefore like to avoid any such assumptions. In the case of trial design, any design we choose necessarily involves assumptions, explicit or otherwise, about the relationship between relative and absolute risk. Moreover, these assumptions can be tested once the trial is completed and further research recom-mended if appropriate.
An apparent disadvantage of our method is that it involves a subjective judgment of NNTt, and a prediction as to relative risk. However, these would be needed for other design decisions even if an investigator chose not to follow our recommendations. For example, the NNTt is equivalent to the "minimum clinically significant differ-ence" that is used in standard sample size calculations; predictions as to event rates are similarly part-and-parcel of sample size estimation.
An alternative to the approach suggested here would be to conduct a trial including all patients, use the trial data to build a predictive model and then select a high-risk group accordingly. The principal advantage is that we can model treatment benefit, rather than baseline risk, and therefore do not need to make assumptions about a constant
rela-Table 6: Sample size requirements for different scenarios. Sample size is calculated using 90% power and 5% alpha
Strategy Intervention
rate
Event rate in control arm of trial Sample size (pts. screened) for relative risk of 0.75
Treat high-risk (risk 10% +) 52.60% 34.6% 1228 (2335) Treat high-risk (risk 25% +) 27.20% 52.9% 624 (2294) Treat high-risk (risk 50% +) 12.60% 74.6% 292 (2317)
[image:7.612.56.557.100.262.2]Treat all 100.00% 20.0% 2504 (2504)
Table 5: Net benefit for treating high-risk and all patients, varying the effectiveness and tolerability of intervention.
Scenario Relative
Risk
NNTt Sensitivity Specificity Net benefit
(high-risk)
Net benefit (treat all)
Net benefit: high-risk – treat all
Effective intervention 0.50 100 40% 80% 0.00790 0.01500 -0.00710 Effective intervention, high sensitivity 0.50 100 95% 45% 0.01805 0.01500 0.00305 Highly tolerable intervention 0.75 500 40% 80% 0.00458 0.01050 -0.00592 Highly tolerable intervention, high
sensitivity
0.75 500 95% 40% 0.01064 0.01050 0.00014
Adverse intervention 0.75 40 40% 80% -0.00025 -0.01250
-Adverse intervention, high specificity 0.75 40 30% 90% 0.00100 -0.01250 0.01350 The ideal intervention, high sensitivity and
specificity
0.25 500 95% 90% 0.03534 0.03550 -0.00016
Questionable intervention, poor sensitivity and specificity
0.80 100 51% 51% 0.00019 0.00000 0.00019
[image:7.612.54.557.651.730.2]tive risk. This approach has been pioneered successfully with respect to adjuvant chemotherapy[8]. However, in practice, clinicians and statisticians are uncomfortable recommending interventions to sub-groups of patients unless these have demonstrated clinical and statistical sig-nificance in the primary analysis of a randomized trial. It is quite plausible that an intervention with a modest effect size, or one targeting a moderately prevalent disease, will not show sufficient overall effectiveness in definitive trial and will be dropped from consideration, even though it would be of important benefit to a sub-group of high-risk patients. An illustrative recent example is the Women's Health Initiative study of calcium and vitamin D for frac-ture prevention. Overall, this study found rather small benefits of supplementation[9], the key conclusion being that treatment "did not significantly reduce hip fracture". Many of the women in this study were at very low risk: for example, 37% of the participants were aged 50 to 59 and the rate of fracture in this sub-group was only about 0.3%. It is entirely possible that supplementation is of impor-tant benefit for older women at higher risk of fracture, but that the use of supplementation in the community will decline given the rather negative overall study results.
In this paper, we have introduced a statistical method to determine whether or not to restrict a study to a high-risk population and, if so, to determine which of several com-peting definitions of high-risk is optimal. Our method is simple and produces results with direct clinical applicabil-ity. It should appeal to clinicians since the quantitative results are in concert with clinical intuition. However, we feel that the mathematical details of our method are per-haps less important than our overall message, which includes four main points. First, it may be more rational to focus on high-risk groups than to treat everyone at risk. Second, whether or not to restrict an intervention to a high-risk group is a question that can be informed by data and statistical analyses. It is our impression that current decisions about whom to include in trials have not been statistically based, rather, they appear to have depended on informal judgment. Third, trial eligibility criteria in tri-als that attempt to identify high-risk subjects (such as pack years in a lung cancer screening trial) can be seen as pre-dictions with certain statistical properties. We have chosen to describe these in terms of sensitivity and specificity, on the grounds that these terms are readily understood by most clinicians. Fourth, we can compare different approaches to trial eligibility using formal statistical anal-ysis. We believe that a more systematic approach to patient selection will maximize the benefits of rand-omized trials for human health.
Additional material
Acknowledgements
Dr Vickers' work on this research was funded by a P50-CA92629 SPORE from the National Cancer Institute. The sponsor had no role in design and conduct of the study; collection, management, analysis, and interpretation of the data; and preparation, review, or approval of the manuscript. Dr Michael Morris, Memorial Sloan-Kettering Cancer Center, provided advice on adjuvant trials in prostate cancer; Dr Mike Kattan, Cleveland Clinic Foundation, provided raw data to calculate the properties of his nomo-gram.
References
1. Gohagan JK: The prostate, lung, colorectal and ovarian (PLCO) cancer screening trial. Controlled Clinical Trials 2000,
21(6, Supplement 1):249S.
2. Bach PB, Kattan MW, Thornquist MD, Kris MG, Tate RC, Barnett MJ, Hsieh LJ, Begg CB: Variations in Lung Cancer Risk Among Smokers. J Natl Cancer Inst 2003, 95(6):470-478.
3. Baker S, Kramer B, Corle D: The fallacy of enrolling only high-risk subjects in cancer prevention trials: Is there a "free lunch"? BMC Medical Research Methodology 2004, 4(1):24. 4. Stephenson AJ, Scardino PT, Eastham JA, Bianco FJJ, Dotan ZA,
DiBla-sio CJ, Reuther A, Klein EA, Kattan MW: Postoperative Nomo-gram Predicting the 10-Year Probability of Prostate Cancer Recurrence After Radical Prostatectomy. J Clin Oncol 2005,
23(28):7005-7012.
5. Sinclair JC, Cook RJ, Guyatt GH, Pauker SG, Cook DJ: When should an effective treatment be used?: Derivation of the threshold number needed to treat and the minimum event rate for treatment. Journal of Clinical Epidemiology 2001, 54(3):253. 6. Baker SG, Heidenberger K: Choosing sample sizes to maximize
expected health benefits subject to a constraint on total trial costs. Med Decis Making 1989, 9(1):14-25.
7. Freedman AN, Seminara D, Gail MH, Hartge P, Colditz GA, Ballard-Barbash R, Pfeiffer RM: Cancer Risk Prediction Models: A Workshop on Development, Evaluation, and Application. J Natl Cancer Inst 2005, 97(10):715-723.
8. Gill S, Loprinzi CL, Sargent DJ, Thome SD, Alberts SR, Haller DG, Benedetti J, Francini G, Shepherd LE, Francois Seitz J, Labianca R, Chen W, Cha SS, Heldebrant MP, Goldberg RM: Pooled Analysis of Fluorouracil-Based Adjuvant Therapy for Stage II and III Colon Cancer: Who Benefits and by How Much? J Clin Oncol
2004, 22(10):1797-1806.
9. Jackson RD, LaCroix AZ, Gass M, Wallace RB, Robbins J, Lewis CE, Bassford T, Beresford SAA, Black HR, Blanchette P, Bonds DE, Brun-ner RL, Brzyski RG, Caan B, Cauley JA, Chlebowski RT, Cummings SR, Granek I, Hays J, Heiss G, Hendrix SL, Howard BV, Hsia J, Hubbell FA, Johnson KC, Judd H, Kotchen JM, Kuller LH, Langer RD, Lasser NL, Limacher MC, Ludlam S, Manson JAE, Margolis KL, McGowan J, Ockene JK, O'Sullivan MJ, Phillips L, Prentice RL, Sarto GE, Stefanick ML, Van Horn L, Wactawski-Wende J, Whitlock E, Anderson GL, Assaf AR, Barad D, the Women's Health Initiative I: Calcium plus Vitamin D Supplementation and the Risk of Fractures. N Engl
J Med 2006, 354(7):669-683.
Additional file 1
Appendix. The appendix gives the statistical derivation of the formulae used in the text.
Click here for file