A RECONFIGURABLE SOC ARCHITECTURE FOR SHIP
INTRUSION DETECTION
1
P. LATHA, 2DR. M. A. BHAGYAVENI, 3STEFFI LIONEL
1, 3Department of ECE, St. Joseph’s College of Engineering, Tamilnadu, Chennai, INDIA 2Department of ECE, College of Engineering, Guindy, Anna University, Chennai, INDIA
E-mail: [email protected], [email protected], [email protected]
ABSTRACT
Monitoring of the marine environment has come to be a field of research in the last ten years. Wireless sensor network has been one of the most emerging techniques for the application of surveillance. Wireless Sensor Nodes are highly attractive for oceanography because they are easy to deploy, operate and inexpensive. Currently used methods for ship intrusion detection are costly. In this paper, we emphasize advantages of Wireless Sensor Networks (WSN) in oceanography. We propose Reconfigurable SoC (RSoC) architecture for ship intrusion detection. The proposed FPGA-based Wireless sensor node is interfaced with tri-axis digital accelerometer sensor. Signal processing techniques are used to detect any unauthorized ships by distinguishing the ship-generated waves from the ocean waves. A three-level intrusion detection system has been designed, with which we can detect the intrusion of any ship irrespective of their sizes. The proposed system is simulated using Xilinx ISE simulator.
Keywords: Wireless sensor network, Surveillance, Oceanography, Accelerometer sensor, Reconfigurable
SoC,
1. INTRODUCTION
The advances in Reconfigurable System on Chip (RSoC) technology offer the possibility of realizing the function of wireless sensor network node in a single chip. Based on the environment of applications, wireless sensor networks can be divided into different types and With the combination of static and dynamic node, all networks are more flexible. Reconfiguration is an important feature and sensor networks can take advantage of it in order to improve the performance. A reconfigurable platform for sensor networks has features that allow easy reuse of node in several applications avoiding redesigning the system from scratch. Thus, one of the main applications of WSN is surveillance and in our work we have used WSN in the surveillance of ships.
Surveillance is a critical problem for harbor protection, border control and the security of commercial facilities. The effective protection of vast near-coast sea surfaces and busy harbor areas from intrusions of unauthorized marine vessels of
pirates, smugglers or, illegal fishermen, is particularly challenging.
Ship intrusion detection method is classified into three types:
• Radar based ship intrusion detection • Satellite imaging for ship intrusion
detection
• Intrusion detection using terrestrial sensor
Radar Based Ship Intrusion Detection
locations detected by the HF radar using the proposed adaptive technique are passed to a tracking filter to track the ship position. It is difficult for it to detect a small ship or boats due to the noise generated by the uneven sea surface which leads to a number of false alarms. Hence the detection ratio decreases resulting in a number of false alarms.
Intrusion Detection Using Satellite Imaging
The architecture of a ship detection prototype based on an object-oriented methodology to support the monitoring tasks is based on satellite imaging [2]. The system’s architecture comprises a fully-automatic coastline detection tool, a tool for fully or semi-automatic ship detection in off-shore areas and a semi-automatic tool for ship detection within harbor areas. Satellite images at times do not give the correct detection because satellite images are easily affected by cloud cover. As a result, the intrusion of small sized ship or boat cannot be detected. Further they are very expensive.
Intrusion Detection Using Terrestrial Sensor
Intrusion detection using terrestrial sensor is widely discussed [3], [4], [5].Terrestrial intrusion detection with Wireless Sensor Networks (WSNs) has recently been developed. These networks deploy magnetometers, thermal sensors, and acoustic sensors in monitored areas to detect the presence of intruders [6]. Though such networks may work well on land, it is challenging to deploy these sensors on the sea surface for ship detection. The main challenge is that when sensors are deployed on the sea surface, they are not static and get tossed by ocean waves, which makes them move around randomly. The random movement of the node makes it difficult for most sensors to detect an intrusion. Due to stability requirements, camera sensors cannot work well either.
Here, we propose an innovative solution for ship intrusion detection by taking advantage of the characteristics of ship-generated waves with WSNs. The sensor used for ship intrusion detection is 3-axis accelerometer as the sensors can sense any slight variation or disturbances that occur on the ocean. Based on this, we have proposed a three level detection system for ship intrusion detection.
The contents of this paper are explained as follows: In section 2 we explain the related work. In section 3, we propose RSoC Architecture for ship intrusion detection system. In section 4, we
discuss the simulation results. Concluding remarks and future work are presented in the last section.
2. RELATED WORKS
The study about Lightweight Detection and Classification for Wireless Sensor Networks in Realistic Environments [3] explores how to design efficient sensing and classification algorithms. Considering the demanding requirements and strict resource constraints, a hierarchical classification architecture that naturally distributes sensing and computation tasks at different levels of the system is designed. Such a distribution allows multiple sensors to collaborate on a sensor node, and the detection and classification results to be continuously refined at different levels of the WSN.
The application of sensor networks to the intrusion detection problem and the related problems of classifying and tracking targets is described [4]. This approach is based on a dense, distributed, wireless network of multi-modal resource-poor sensors combined into loosely coherent sensor arrays that perform detection, estimation, compression, and exfiltration. They explore the design space of sensors, signal processing algorithms, communications, networking, and middleware services.
Wireless sensor networks (WSNs) play a crucial role in audio and visual surveillance for automatic object detection [7], [8]. In this paper a WSN framework based on line sensor architecture capable of capturing a continuous stream of temporal one Dimensional image (line image). The associated one Dimensional image processing algorithms are able to achieve significantly faster processing results with much less storage and bandwidth requirement while conserving the node energy.
accept signals in analog form as well as TTL logic levels. The microcontroller continuously monitors the output signals from all the sensors. As a microcontroller does not consume as much power as an FPGA does, keeping it in power on for long periods of time is feasible. Upon exceeding the threshold limit of each of these three sensors, the microcontroller sends an alert signal through a wireless interface to the FPGA nodes. The specifications of the wireless interface between the microcontroller and the FPGA include an RF encoder whose serial output is sent to a 433.92 MHz ASK modulation RF transmitter. At the second level node, an RF receiver tuned to the same frequency feeds the output to an RF decoder chip. The alert signal thus obtained is transmitted to the FPGA.
In our second work [10], we proposed a new reconfigurable WSN node for video sequence in surveillance application. The main aim of this reconfigurable node is to detect the presence of an intruder in the environment and to determine the number of intruders in the environment. The proposed node in the application is composed of a high performance FPGA that can be dynamically reconfigured for different applications, interfaced with the camera. The algorithm for Histogram equalization is implemented in the proposed node for enhancing the clarity of the captured video frames.
A three-tier ship intrusion detection system using tri-axis digital accelerometer sensor has been proposed [11]. In this paper, the PXA271 processor based iMote2 sensor node is used to detect ship waves. In our work, we have proposed a Reconfigurable System-on-Chip sensor node for ship intrusion detection. The module for network-level detection to detect unauthorized ship as intruded ship in the region under control is included in our work. Our proposed algorithm for node-level, cluster-level and network-level were simulated in Xilinx ISE 9.1i Simulator.
After a thorough review of literature, it was identified that works reported in this field do not include FPGA-based reconfigurable sensor node to detect ship intrusion. Hence, in our work, reconfigurable wireless sensor node is proposed. Our Reconfigurable SoC architecture for ship intrusion detection interfaced with 3-axis digital accelerometer sensors can be deployed onto the sea surface to detect unauthorized ships.
3. RSoC ARCHITECTURE
The aim of this proposed system is to develop an architecture for the detection of ship intrusion based on the Kelvin’s ship wave pattern. The proposed system consists of three levels of detection they are described as follows:
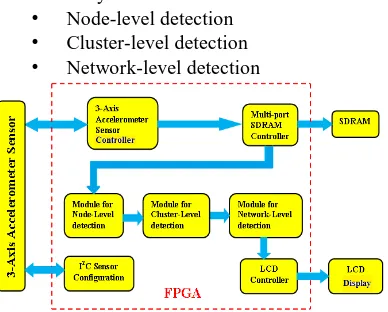
[image:3.612.316.510.160.316.2]• Node-level detection • Cluster-level detection • Network-level detection
Figure 1: Reconfigurable SoC Architecture
The proposed three-level detection system is developed in order to find effectively the intruding ship on the sea surface with the help of a 3-axis accelerometer sensor. Compared to the existing methods, the proposed system is cost efficient and easy to deploy as it occupies less area. A functional diagram of the modules implemented in the FPGA device is presented in Figure 1. The important modules are:
3-Axis Accelerometer Sensor
A 3-axis accelerometer sensor is a single monolithic measuring system. It has a measurement range of ±3 g minimum. It contains a polysilicon surface, micro-machined sensor and signal conditioning circuitry to implement an open-loop acceleration measurement architecture. The proposed architecture contains a 3-axis ST-Micro LIS3L02DQ accelerometer. It is a 3-axis digital output linear accelerometer that includes a sensing element and an IC interface able to take the information from the sensing element and to provide the measured acceleration signals to the external world through an I2C/SPI serial interface. The sensing element, capable of detecting the acceleration, is manufactured using a dedicated process called Thick Epi-Poly Layer for Microactuators and Accelerometers (THELMA) developed by ST to produce inertial sensors and actuators in silicon.
3-Axis Accelerometer Sensor Controller:
between Accelerometer sensor and SDRAM Controller.
SDRAM Controller:
The SDRAM controller, located between the SDRAM and the bus master, reduces the user’s effort to deal with the SDRAM command interface by providing a simple generic system interface to the bus master. It consists of three modules: the main control module, the signal generation module and the data path module. The main control module, containing two state machines and a counter, is the primary module of the design which generates proper outputs according to the system interface control signals. The signal generation module generates the address and command signals required for SDRAM. The data path module performs the data latching and dispatching of the data between the bus master and SDRAM.
SDRAM:
SDRAM is the conventional Single-Data-Rate (SDR) SDRAM memory interface. The SDRAM interface allows the storage of a large amount of data. This data can be accessed in bursts at 133MHz allowing the FPGA to process that data in real time, or to create a storage element such as a large FIFO. The SDRAM is organized as 32-bit wide memory. Its interface always runs at 133MHz. Therefore, once a row is opened, data can be written in a burst of consecutive clock cycles at a data rate of 532Mbytes/sec. 3-Axis accelerometer readings are stored in SDRAM in our proposed architecture.
LCD Controller:
The LCD controller acts as an interface between the module for network-level detection and the LCD display unit.
LCD Display Unit:
Ship intrusion is detected and it is displayed in the display unit. If the intruding ship has an ID, the message “Authorized ship” is displayed in the display unit. If the intruding ship does not have an ID, the message “Unauthorized ship” is displayed in the display unit.
I2C Interface:
The I2C is a bus slave. The acceleration data may be accessed through an I2C interface thus making the device particularly suitable for direct interfacing with FPGA. The I2C is employed to write the data into the registers embedded in LIS3L02DQ digital 3-axis accelerometer. The content of the register can also be read back.
3.1 Region under Surveillance for the Proposed System
[image:4.612.334.501.124.242.2]The experimental setup for this proposed work is explained with the help of the following diagram:
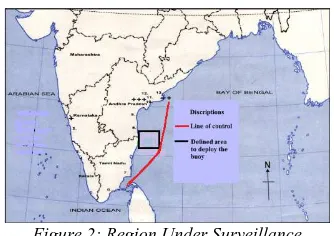
Figure 2: Region Under Surveillance
Figure 2 shows the region under surveillance. The red line indicates the Line of Control (LOC) which means that any ship entering that particular area is under surveillance. For our experimental purpose we select 2000m x 2000m region which is denoted by the black line. The entire region is divided into 5 clusters. Each cluster in the region consists of 4 buoys. The buoys on which the sensors are fixed are uniformly distributed along the region of interest. Based on this model the various levels of ship intrusion detection algorithm are implemented and their corresponding results are explained in section 4.
3.2 Kelvin’s Ship Wave Pattern
A V-shaped wake and its resulting waves are generated by a ship passing through water [12]. Every ship irrespective of its size and shape makes this V-shape pattern. Ship intrusion detection is achieved by considering the characteristics of ship-generated waves with WSN.
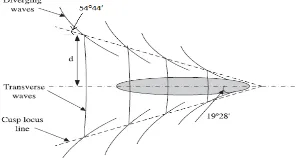
When a ship moves across a surface of water, it generates waves which comprise divergent and transverse waves as shown in Figure 3. The V-shaped patterns are formed by two locus of cusps whose angle with the sailing line is 19˚28’ in deep water [12], and the angle between the sailing line and the diverging wave crest lines at the cusp locus line is 54˚44’. This pattern is independent of the size and velocity of the ship.
ship-generated wave train has a limited duration [14]. The maximum wave height Hm at distance d from the sailing line can be expressed by the following equation:
3 / 1 −
=
cd
H
m (1)Where c is a parameter related to the speed of the passing ship. The speed of the ship-wave Wν can be
predicted by the following equation.
θ
cos
×
=
V
W
v (2)Where V is the ship speed and θ=35.27(1-e12 (Fr-1)).
Fr is the Froude number related to the traveling ship. For a ship, the Froude number is defined as [15],
gL
v
Fr
=
(3) [image:5.612.120.269.364.443.2]Where v is the velocity of the ship, g is the acceleration due to gravity, and L is the length of the ship at the water line level. It is an important parameter with respect to the ship's resistance, including the wave making resistance.
Figure 3: Ship Generated Wave Model
The sensors deployed are responsible for identifying the waves with this property. Based on this wave pattern our proposed architecture is designed.
3.3 Node-Level Detection
In node-level detection, the task of a single node is to detect ship waves generated by a nearby passing ship. In order to do that, the individual node periodically samples the event and processes the sampled data to extract features for node-level detection. The node first samples for a period of time T after being deployed, then filters out any frequencies above 1 Hz. We assume the sample signal value at time t1 as a1. Similarly, the samples
for various time periods such as t2,t3,…etc and the
corresponding sample signal values a2, a3,…etc are
determined. The average sample value of time period T is computed as follows:
∑
==
ni i
a
n
nodeA
1
1
(4)
Where nodeA represents the average sample
value at node A and a1, a2, a3 …etc represent the
sample values collected at various time intervals and n represents the total number of sample values collected during time period T. Threshold value is determined by finding the median value from the obtained sample values. The median value can be computed as follows:
(5) Where MA is the median value of samples collected from node A during the time period T. The sample values collected from node A are arranged in ascending order and the median value MA is computed using equation (5). The threshold value is defined as Dth = MA. If the average sample value nodeA > Dth, intrusion is detected in node A.
However, we cannot conclude that there is an intrusion based on one single node because this may be a false alarm because of the external changes or external disturbances. In order to reduce this problem, the other neighboring nodes present near them are considered. An analysis is made based on the report obtained from the other nodes. This method is explained by means of using the following diagram.
Figure 4: Working Of Node-Level Detection
Figure 4 shows the working of the node-level detection. The first diagram shows that there are four sensor nodes placed at distance d from each other and a ship is arriving. In diagram b, Node A detects the ship’s arrival which indicates an intrusion is said to have occurred. As the ship moves continuously on the sea surface the other node B which is near to the node A also detects the ship’s intrusion which is shown in diagram c. Average sample values and median values for each neighboring nodes are computed similar to node A. A term known as deviation is calculated for the individual nodes. The expression for deviation is
[image:5.612.315.529.432.534.2]Where i=1, 2, 3, 4.
In (6), N is node designation and nodeN is the average sample value of node N. Let us consider four nodes A, B, C and D. Once the average sample values are calculated for every node we have to check if it crosses the threshold value, then their corresponding deviation value is set to ‘1’. If the value does not cross the threshold, then the value is set to ‘0’ as in equation (6). Now, the intrusion on the ship is calculated based on the deviation values as follows.
(7)
Based on the equation (7), ship intrusion in node level is calculated. If the output value equals ‘1’an intrusion of ship is said to have been detected. If the output is ‘0’ it indicates that there is no intrusion of ship. In this way, the number of false alarms can be reduced as much as possible at node-level detection. However, due to hardware failure, a few nodes may not able to detect the intruded ship. This problem of node-level detection can be overcome by the cluster-level detection.
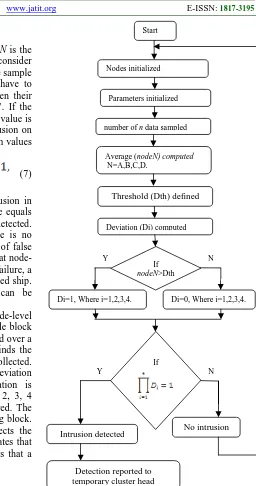
[image:6.612.267.523.73.559.2]Figure 5 shows the flowchart for node-level detection. The first block is the input sample block where the sensor sample values are collected over a regular interval of time. The next block finds the average for all the sample values collected. Computing deviation block computes the deviation for each and every node where deviation is represented as Di, where i range from 1, 2, 3, 4 representing the number of nodes considered. The threshold (Dth) is set in the threshold setting block. Then the module intrusion detection detects the ship’s intrusion. If the output is 0, it indicates that there is no intrusion and if it is 1 it shows that a ship’s intrusion is detected.
Figure 5: Flowchart For Node-Level Detection
3.4 Cluster-Level Detection
In spite of the fact that a passing ship might be discovered by a single node, many factors influence the discovery results. A case in point is that wind might influence the sensors and make a flurry of false positives by straightforward moving sensors. Creatures, for example winged animals or fish, might additionally upset the sensor readings. Also, a few nodes with hardware failures may not locate the ship when it is passing. Indeed, with immaculate location, its sure report may not be transmitted exactly because of wireless
Nodes initialized
Parameters initialized
number of n data sampled
Average (nodeN) computed N=A,B,C,D.
Threshold (Dth) defined
Deviation (Di) computed
If
Intrusion detected No intrusion
N Y
Detection reported to temporary cluster head
Start
If
nodeN>Dth
Di=1, Where i=1,2,3,4. Y
communication failure [16] and conceivable network congestions [17].
To improve the detection performance we use cluster formation of nodes, i.e., four nodes form a cluster. In this manner, five such clusters are formed along the surface of the sea in the region under control of 2000m x 2000m. Each node present in the cluster performs the same as in node level detection. The working of the cluster level detection is explained in Figure 6 and Figure 7.
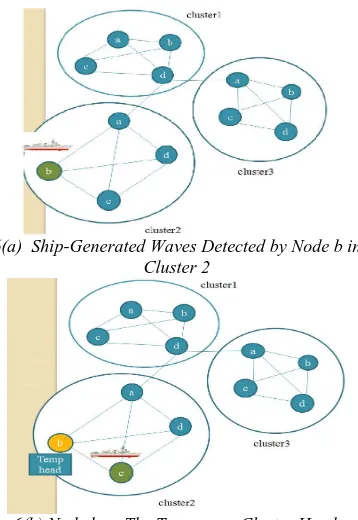
6(a) Ship-Generated Waves Detected by Node b in Cluster 2
[image:7.612.316.517.83.392.2]6(b) Node b as The Temporary Cluster Head.
Figure 6: Cluster-Level Detection Scenario-I
Figure 6 shows the cluster level detection. There are three clusters with each cluster having four nodes. Figure 6 (a) shows that a ship comes in contact with node b in cluster 2. The ship moves further and is detected by another node c in cluster 2. Now the node b sets itself as the temporary cluster head as shown in Figure 6 (b). The temporary cluster head is responsible for the transmission of information to the Network Coordinator.
Now let us consider Figure 7 (c) which shows that node d in cluster 2 also detects the intrusion of the ship. Thus, two nodes, i.e. node c and node d report to the temporary cluster head in one hop as shown in Figure 7 (d). The temporary cluster head sends the information to the Network Coordinator for further processing. Each node present in the cluster performs the same as in node level detection
and computes required parameters using equations (4) to (7).
7(c) Node d in Cluster 2 Detecting the Intrusion of the Ship
7(d) Node c and Node d Reporting to the Temporary Cluster Head b
Figure 7: Cluster-Level Detection Scenario-Ii
In case the intrusion of ship is detected by two or more cluster nodes, the node which has the highest energy will be assigned as the temporary cluster head. An average detection ratio is calculated in order to obtain better results for detection. The threshold for cluster-level detection is defined as
(8)
Where n is the total number of nodes in a cluster. Intrusion detection in cluster-level can be computed using equation (9).
(9)
In (9), Cp is the total number of active nodes that
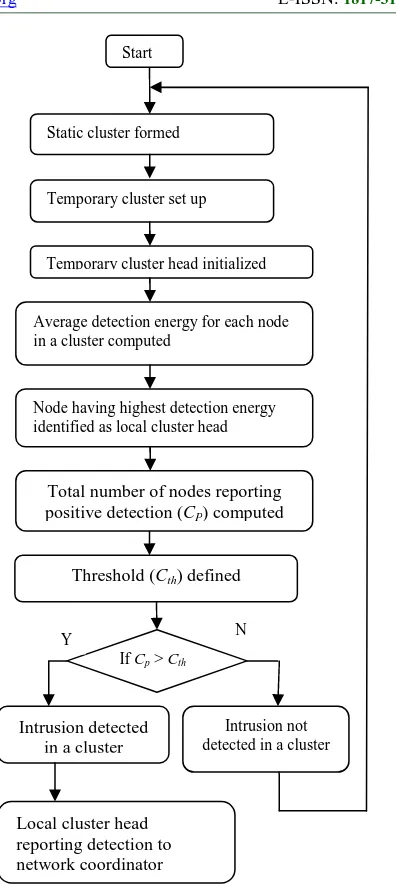
[image:7.612.106.285.217.477.2]Figure 8 shows the flowchart for cluster-level detection. The first block in this level of detection is the cluster declaration where the grouping of nodes to form a cluster and the processing of cluster numbering are done in this module. The next block is processing of nodes in the cluster. In this block, each node works as mentioned in the node-level detection and finds the average detection energy. Total number of nodes that report positive detection, CP is computed. Threshold Cth is defined.
Once the ship’s intrusion is detected, the local cluster head reports to network coordinator. In this way, we can detect the intrusion of a ship in cluster-level. However, more advanced detection would make the result more accurate and is achieved in network-level detection.
3.5 Network-Level Detection
As surveillance in oceanography is required to be an accurate detection system, we have proposed a network-level detection. In this particular system of detection, the entire network details are stored in a data base. In this level of detection, a specific ID is given for every authorized ship. As our main aim for ship’s detection is to identify an enemy ship or any unauthorized ship from the authorized one. Thus in the network-level detection the unauthorized ships are detected and declared as intruded ships. We have designed a system that will report a ship’s intrusion only when it finds an unauthorized ship.
Here, as in cluster-level detection the clusters are considered. The size of the clusters can be made smaller, thereby making the detection more effective. Once the cluster finds the intrusion, the node will see if the intruding ship has an ID or not. If the ID is not present, it will indicate that there is a ship’s intrusion. In this way, any unauthorized ship can be detected from the other group of authorized floating vessels. Thus, when compared to the traditional methods of ship’s intrusion detection, this proposed method is cheaper and efficient in the detection of smaller ships and boats. The various limitations in the traditional methods are overcome by this proposed method.
Figure 8: Flowchart For Cluster-Level Detection
4 RESULTS AND DISCUSSION
4.1 Node-Level Detection
The proposed algorithm for ship intrusion detection is implemented using VHDL, with behavioral description language. The VHDL code was simulated by means of the Integrated Synthesis Environment (ISE) simulator. The design unit consisted of 12 adder/subtractors circuits, 6 registers and 4 comparators were created using 102 LUTs. The device property is shown in Table 1.
Static cluster formed
Temporary cluster set up
Temporary cluster head initialized
Average detection energy for each node in a cluster computed
Node having highest detection energy identified as local cluster head
Total number of nodes reporting positive detection (CP) computed
If Cp> Cth
Intrusion detected in a cluster
Intrusion not detected in a cluster
N Y
Local cluster head reporting detection to network coordinator
Threshold (Cth) defined
[image:8.612.315.513.82.525.2]Table 1: Design Utilization Summary For Node-Level Detection
Device parameter
Used Available Utilization Selected
device
- 3s400pq208-4 - Total slices 58 3584 1% Total LUTs 102 7168 1% Total IOs 114 - - Total Bonded
IOBs
114 141 80%
[image:9.612.315.521.209.302.2]The functionality of the proposed module was verified using ISE simulator. The simulation result is shown in Figures 9 and 10. In the design module of single output signal, intrusion is evaluated based on the input values. The intrusion is calculated as follows: when the node’s value is greater than the threshold value, then an intrusion is said to have occurred as in Figure 9; else there is no intrusion or can be considered as the false alarm as shown in Figure 10.
Figure 9: Node-Level Detection During A Ship’s Intrusion
Figure 10: Node-Level Detection In The Absence Of A Ship’s Intrusion
In Figure 9 the brown line indicates that there is a ship intrusion which is represented by means of logic 1. Similarly, in Figure 10 the red line indicates that there is no ship’s intrusion which is represented by means of logic 0. In this way, the node-level detection is simulated in Xilinx ISE 9.1i.
4.2 Cluster-Level Detection
The second level detection is the cluster level detection. In cluster level detection, four nodes together form a cluster. The design unit consists of 16 adder/subtractors circuits, 32 registers, 4 comparator and 4 latches have been created using 34 LUTs. The device property is shown below in Table 2.
Table 2: Design Utilization Summary For Cluster-Level Detection
Device parameter
Used Available Utilization Selected device - 3s400pq208-4 - Total slices 23 3584 0% Total LUTs 34 7168 0% Total IOs 26 - - Total Bonded
IOBs
26 141 18%
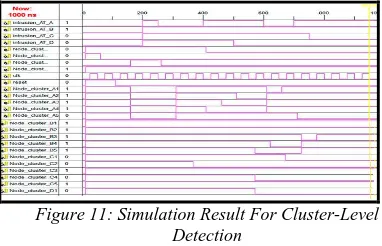
[image:9.612.106.284.338.616.2]The simulation result for cluster-level detection is shown in Figure 11. The outputs from all the nodes inside a cluster are observed to check if there is an intrusion of the ship. The detection in each node is the same as that of a node-level detection. The number of nodes that report the detection is calculated in order to reduce the false alarm rate.
Figure 11: Simulation Result For Cluster-Level Detection
The yellow line points to an intrusion at cluster A and B. In this way, the cluster level detection is simulated.
4.3 Network-Level Detection
[image:9.612.314.505.400.523.2]Table 3: Design Utilization Summary For Network-Level Detection
Device parameter
Used Available Utilization Selected
device
- 3s400pq208-4 - Total slices 26 3584 0% Total LUTs 36 7168 0% Total IOs 51 - - Total Bonded
IOBs
51 141 36%
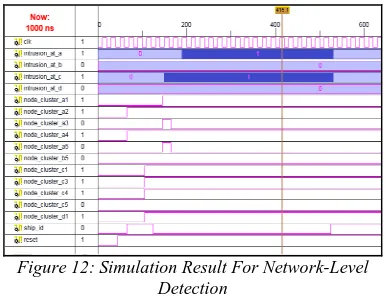
[image:10.612.98.291.325.473.2]The simulation result for network level detection is shown in Figure 12. The output of network level is similar to cluster level detection. The Ship ID is given for all authorized ship in network level detection. The intrusion detection is reported only when the intruding ship does not have an ID which means an unauthorized intruding ship is detected. This is shown in the simulation result in Figure 15.
Figure 12: Simulation Result For Network-Level Detection
The red pointer indicates that cluster a and c detect a ship because the average node’s detection inside their corresponding cluster is above the defined value. The ship’s ID is also not present which is indicated by the low line (logic 0). Thus, an intrusion of ship is detected by means of network-level detection.
5. CONCLUSION AND FUTURE WORK
We present a three-level intrusion detection system by using Digital 3-axis accelerometer sensor to detect ship intrusion in oceanography. We device a frame work to implement the existing Ship Intrusion Detection Algorithm in Reconfigurable System on Chip (RSoC). In [11], the PXA271 processor based iMote2 sensor node is used to detect ship waves. In our work, we have proposed a Reconfigurable System-on-Chip sensor node for ship intrusion detection. The module for network-level detection to detect unauthorized ship as
intruded ship in the region under control is included in our work. Compared with the traditional ship detection methods which can monitor a large area (e.g., radars or satellites) but cost a lot, our methods can be cheaper. Moreover, the satellites cannot perform real-time monitoring. With radar, we need some place to set up the equipment, and it is difficult to detect small boats. The schemes with WSNs are cheaper and can be deployed almost anywhere we want. More importantly, it can perform real-time monitoring and provide more information of the monitored targets. Node-level, Cluster-level and Network-level models for ship intrusion detection have been simulated using Xilinx ISE 9.1i simulator.
Our future work will mainly concentrate on implementing a system with less power consumption and developing a model under faulty conditions of the sensor. Further, we may design a system to support online intrusion detection in future.
REFERENCES:
[1] A.Dzvonkovskaya, K. W Gurgel, H. Rohling, T. Schlick, “HF Radar WERA Application for ship detection and Tracking” pp. 18
[2] G. Willhauck. JJ. Caliz, C. Hoffmann and I. Lingenfelder, “Object-Oriented ship detection from VHR Satellite Images”, Semana Geomatica, Barcelona, Spain, 2005.
[3] L. Gu et al., “Lightweight Detection and Classification for Wireless Sensor Networks in Realistic Environments,” Proc. Third Int’l Conf. Embedded Networked Sensor Systems (SenSys ’05), pp. 205-217, 2005.
[4] A. Arora et al., “A Line in the Sand: A Wireless Sensor Network for Target Detection, Classification, and Tracking,” Computer Networks, vol. 46, no. 5, pp. 605-634, 2004.
[5] M. Duarte and Y. Hen Hu, “Vehicle Classification in Distributed Sensor Networks,” J. Parallel and Distributed Computing, vol. 64, no. 7, pp. 826-838, 2004.
[6] S. Kumar, T. Lai, and A. Arora, “Barrier Coverage with Wireless Sensors,” Proc. MobiCom, pp. 284-298, 2005.
Targets in Wireless Audio-Sensor Networks,” Computer Networks, vol. 52, no. 13, pp. 2582-2593, 2008.
[8] M. Chitnis, Y. Liang and P. Pagano, “ Wireless line sensor network for distributed visual surveillance”, Proc. 6th ACM symposium on PE-WASUN’09, pp. 71-78, 2009.
[9] Latha P. and Bhagyaveni. M. A.,
“Reconfigurable FPGA Based
Architecture for Surveillance Systems in WSN” in Proc. IEEE International
Conference on Wireless Communication and Sensor Computing (ICWCSC), 2010,
pp. 1–6.
[10] Latha P., Bhagyaveni. M. A. and J. Ancilin, “VLSI Implementation of Reconfigurable WSN Node for Surveillance” Published in European Journal of Scientific Research, ISSN 1450-216X Vol. 92 No 2 December, 2012, pp.238-256.
[11] Hanjiang Luo, Kaishun Wu, Zhongwen Guo, Lin Gu, and Lionel M. Ni, “Ship Detection with Wireless Sensor Networks” in IEEE Transactions On Parallel and Distributed Systems, Vol. 23, No. 7, July 2012
[12] F. Ursell, “On Kelvin’s Ship-Wave Pattern,” J. Fluid Mechanics Digital [13] T. Havelock, “The Propagation of Groups
of Waves in Dispersive Media, with Application to Waves on Water Produced by a Travelling Disturbance,” Proc. Royal Soc., pp. 398-430, 1908.
[14] A.T. Chwang and Y. Chen, “Field Measurement of Ship Waves in Victoria Harbor,” J. Eng. Mechanics, vol. 129, pp. 1138-1148, 2003.
[15] Newman, John Nicholas (1977). Marine
hydrodynamics. Cambridge,
Massachusetts: MIT Press. ISBN 0-262-14026-8.,p.28.
[16] K. Wu, H. Tan, Y. Liu, Q. Zhang, and L.M. Ni, “Side Channel: Bits over Interference,” Proc. MobiCom, 2010. [17] K. Wu, H. Tan, H. Ngan, and L.M. Ni,