© 2015, IRJET ISO 9001:2008 Certified Journal
Page 428
Optimal Allocation of Wind Power DG in Power Systems
Mallipeddi Keerthi, T. Purnachandar Rao
PG Student, EEE, V R Siddhartha Engineering College (Autonomous), Andhra Pradesh, India
Assistant professor, EEE, V R Siddhartha Engineering College (Autonomous), Andhra Pradesh, India
---***---
Abstract -
Renewable energy based DistributedGenerators (DGs) play a dominant role in electricity production with increase in the global warming. Wind energy is one of the most available and feasible forms of renewable energy due to their advantages. The integration of Distributed Generation (DG) into the distribution system brings technical and economic benefits to the grid. Yet installation of non optimized sizes of DGs at arbitrary locations can result in degraded voltage profile and increased system losses. Therefore it is expedient that the sizing and location of DG units should be deliberately planned and determined. DG unit sizing and siting are calculated using a sensitivity index that combines the exact loss formula and voltage sensitivity coefficients.
In this paper the Squirrel Cage Induction Generator (SCIG) is considered as wind generator. This paper provides the comparison between the economic load dispatch by conventional method and economic load dispatch by non conventional method by using PSO. Gives an analytical technique to determine the optimal siting and size of DGs in a distribution system for power loss reduction. Also the system performance at different penetration levels of wind DG is observed. The proposed model is implemented in MATLAB/SIMULINK.
Key Words:
Distributed Generation (DG), optimum
size, optimum location, power loss, voltage profile,
Power system, Squirrel Cage Induction Generator
(SCIG), Wind Penetration, Distribution System (DS),
Optimal Power Flow (OPF).
1. INTRODUCTION
The increase in need for electrical power generation, steady progress in the power deregulation, utility restructuring, tight constraints over the construction of new transmission lines for long distance power transmission, the problem of global warming and fatigue of fossil fuel have increased the usage of Distributed Generation (DG) sources closer to load demands in the distribution system. These include cogeneration of thermal efficiency, clean natural energy generation, and many others. Most especially the DGs are variable
Renewable Generation (RG) which imposes new challenges to the distribution system over centralized expected production due to their intermittency and variable characteristics [2]. The integration of DGs into the DS that is close to the consumer point of common coupling (PCC), changes the traditional flow from a unidirectional flow (Generation, transmission and distribution) to a bidirectional flow that may bring imbalance to energy production and consumption [3]. Therefore, it is required that the whole network operational system should be revisited and managed in a more new way than with the usual manner.
In order to minimize the negative impact and bring benefits, technical constraints concerning the integration of DG units and their penetration levels are being gradually adopted. The optimal sizing and siting of DG units are used in order to decrease the power loss, increase the power transfer capability, increase system power quality, reliability, and improve the voltage profile [4]. Inappropriate installation of DGs at random locations can result in a rise in system losses and poor voltage profile. Optimal sized DG units should be located properly in the system in order to obtain wide benefits.
Integrating wind generator to the power system will have a big impact on the system safety and economical operation. By the use of Optimal Power Flow (OPF) calculation we can find out the impact of wind power on the systems. The OPF is an important tool that system operator require in order to operate the grid with high penetration of wind power more efficiently while maintaining all constraints within restricted limits.
The Optimal Power Flow (OPF) optimizes the operating condition of a power system. The main benefits of Optimal Power Flow (OPF) are:
To ensure the security of quality of service by imposing limits on system operation,
To optimize reactive-power/voltage scheduling
To improve economy of operation through the full utilization of the system’s feasible operating range and by the accurate coordination of transmission losses.
© 2015, IRJET ISO 9001:2008 Certified Journal
Page 429
minimizes the cost of the thermal plants and the system losses at different levels of the wind power generated.
As modern power systems are more complex planning, operation and control of such systems by conventional methods leads to many difficulties. Intelligent system has been developed and applies for solving such problems.
In order to avoid the effects of the conventional methods, Evolutionary techniques have been proposed; they are Expert System (ES), Genetic Algorithm (GA), Tabu Search
(TS), Evolution Strategy (ES), Particle Swarm
Optimization (PSO), etc.
In this paper, Particle Swarm Optimization (PSO) method is proposed to solve the optimal power flow problem. Particle swarm optimization (PSO) is a population-based optimization method first proposed by Kennedy and Eberhart in 1995, inspired by social behavior of bird flocking or fish schooling[5].
2. DISTRIBUTED GENERATORS (DG):-
“Distributed Generation (DG) is the generation of electricity by facilities that are sufficiently smaller than central generating plants so as to allow interconnection at nearly any point in a power system”.
Generally, Distributed Generation (DG) is located at the point where the energy is essentially needed. The DGs are classified mainly based on the type of resources and based on interfacing technologies to the power system.
The different types of DGs base on the power penetration given as follows:
Type 1 DG: is capable of injecting both real and
reactive power (e.g., synchronous generators).
Type 2 DG: is capable of injecting real power but consuming reactive power (e.g., induction generators).
Type 3 DG: is capable of injecting real power only (e.g., PV and fuel cells).
Type 4 DG: is capable of delivering reactive
power only (e.g., synchronous compensators, capacitor).
3. WIND GENERATOR MODELING
The fixed-speed, Squirrel Cage Induction Generator (SCIG) is connected directly to the distribution grid through a transformer. Representation of fixed speed Induction Generator is shown in Fig 1.
Fig.1 Representation of the fixed speed induction
generator
There is a gear box which scepters the generator’s speed to the frequency of the grid. During high wind speeds, the power extracted from the wind is limited by the stall effect of the generator. This prevents the mechanical power extracted from the wind from becoming too large. In most cases, a capacitor bank is connected to the fixed speed wind generator for reactive power compensation purposes. The capacitor bank minimizes the amount of reactive power that the generator draws from the grid [6].
The Squirrel Cage Induction generator model is shown in Fig. 2. Where Rs represents the stator resistance, Xs represents the stator reactance; Xm is the magnetizing reactance, while Rr and Xr represent the rotor resistance and reactance, respectively.
Fig.2 Equivalent circuit of the Squirrel Cage Induction generator
[image:2.595.324.520.109.217.2] [image:2.595.330.538.443.532.2] [image:2.595.351.561.669.771.2]© 2015, IRJET ISO 9001:2008 Certified Journal
Page 430
Where Vs is the stator voltage while Vr represents the rotor voltage, λs and λr are the stator and rotor flux respectively, while ωs is the synchronous speed. The rotor voltage is zero because the rotor has been short-circuited in the Squirrel cage induction generator. The model is completed by the mechanical equation as given below [7].
Where, H represents the inertia constant, Tm represents the mechanical torque,
Te represents the electrical torque and
ωr represents the generator speed.
4. ECONOMIC LOAD DISPATCH
The basic OPF problem can described mathematically as a minimization of problem of minimizing the total fuel cost of all committed plants subject to the constraints.
Where, Fi (Pi) represents the fuel cost equation of the ith
plant. It is the variation of fuel cost ($ or Rs) with generated power (MW). Normally it is expressed as continuous quadratic equation.
The total generation should meet the total demand and transmission loss. The transmission loss can be determined from power flow.
Vimin≤Vi≤ Vimax (9)
5. QUADRATIC PROGRAMMING
Quadratic Programming is an effective optimization method to find the global solution if the objective functions is quadratic and the constraints are linear. It can be applied to optimization problems having non-quadratic objective and nonlinear constraints by
approximating the objective to quadratic function and the constraints as linear. For all the four problems the objective is quadratic but the constraints are also quadratic so the constraints are to be made linear.
Minimize 0.5 (X.H.XT ) + FTX,
Subject to KX ≤ R, Xmin ≤ X ≤ Xmax
X = [x1, x2, x3…….xn] T
f = [f1, f2, f3…….fn] T
R = [R1, R2, R3…….R] T (10)
Where, H represents Hessian matrix of size nxn A is an mxn matrix representing inequalities.
To solve the economic dispatch with losses the Quadratic Programming can be effectively implemented by defining the matrices H, f, K and R.
,
1xn matrix
6. OPTIMAL POWER FLOW
Optimal Power flow (OPF) is allocating loads to plants for minimum cost while meeting the network constraints. It is formulated as an optimization problem of minimizing the total fuel cost of all committed plant while meeting the network (power flow) constraints.
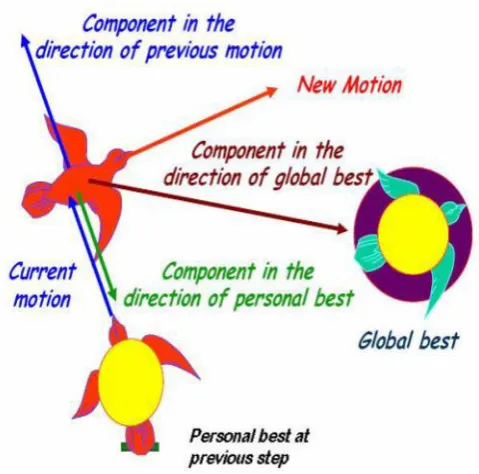
The PSO as an optimization tool provides a population-based search procedure in which individuals called particles change their position (state) with time. In a PSO system, particles fly around in a multidimensional search space. During flight, each particle adjusts its position according to its own experience (this value is called
© 2015, IRJET ISO 9001:2008 Certified Journal
Page 431
Fig 3: Concept of searching mechanism of PSO
The velocity of each agent is updated by the following equation:
(11)
Using the above equation, a certain velocity, which gradually gets close to pbest and gbest, is calculated. C1
and C2 take the values ranging between 1 &2. r1 and r2
are two different randomnumbers in the range 0 to1. The current position (searching point in the solution space) is modified by the following equation:
(12)
i=1, 2, 3…n d=1,2 ,3….m
Where, Sk the current searching point,
sk+1 the modified searching point,
vk the current velocity,
vk+1 the modified velocity of agent i,
ωi the weight function for velocity of agent i,
ci the weight coefficients for each term.
The following weight function is used:
(13)
Where, ωmin and ωmax are the minimum and maximum
weights respectively. k and kmax are the current and
maximum iteration. Appropriate values for ωmin and ωmax
are 0.2 and 0.9 respectively.
7. OPTIMAL LOCATION AND SIZING
There are lots of benefits in installing distributed energy resources in Distribution systems. The major technical benefits are as follows:
Line-loss reduction
Voltage profile improvement
Improvement in the reliability and continuity of power supply
Modularity
Though interaction of DG units into distribution systems has got the above mentioned advantages, they need to be placed in appropriate location as well as of appropriate sizing. If DG units are improperly located and sized, there can be a steep increase in power losses as well s voltage constraint at the buses would be violated. Hence, to minimize losses, it is important to find the best location and size, given the option of resources availability.
7.1 OPTIMAL LOCATION
Optimal location of can be given by using sensitivity index. Sensitivity index is of many types. In this paper power loss of the system is to be reduced, sensitivity index of exact loss formula [8] is considered to determine the optimal location of DG.
Whereas the exact loss formula is as follows,
Where,
Sensitivity index is given by,
(15)
7.2 OPTIMAL SIZING
In this paper wind generator has been used. And the sizing of wind DG is given by
© 2015, IRJET ISO 9001:2008 Certified Journal
Page 432
Where,
Sign=(-1), DG injecting reactive power
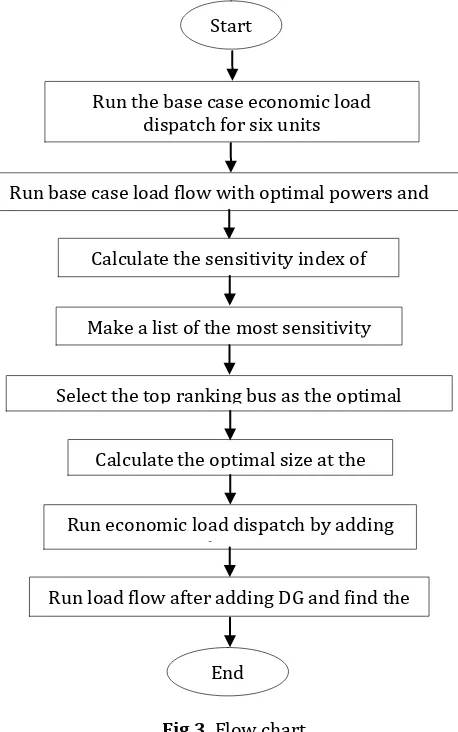
[image:5.595.328.547.131.320.2]From equation (15) sensitivity index at each bus is calculated. Select the top ranking bus as the optimal location for the installation of DG in the system. Figure 3. gives the detailed procedure for determining the optimal location and sizing of wind DG.
Fig.3. Flow chart
8. SYSTEMS UNDER STUDY
The system under study is a typical 30-bus distribution system, contains 30 buses and 41 branches as shown in Figure 4. It is a system with a total load of 2.834 MW and 1.262 MVAR [9]. A computer program is written in
MATLAB 7.8 to find the economic load dispatch for the six units by using quadratic programming and PSO.
Fig.4. Single line diagram of the IEEE 30-bus system
Table - 1. Power Generation Limits and Cost coefficients
Bus No
Pmin (MW)
Pmax (MW)
Cost Coefficients
A B C
1 50 200 0.00375 2 0
2 20 80 0.0175 1.75 0
5 15 50 0.0625 1 0
8 10 35 0.0083 3.25 0
11 10 30 0.025 3 0
13 15 40 0.025 3 0
9. SIMULATION RESULTS
This section presents computer simulation studies with programs developed in MATLAB software version 7.8 to give the comparison between the conventional method by quadratic programming and non-conventional method by PSO. Table.2. gives the optimal powers, cost and power loss of the system without DG.
Table - 2. Comparison for Quadratic programming and
PSO without DG Quadratic Programming
PSO
Pg 1 (p.u) 1.96 1.9676
Pg 2 (p.u) 0.4668 0.4687
Pg 5 (p.u) 0.1907 0.1912
Pg 8 (p.u) 0.1109 0.1
Pg 11 (p.u) 0.1 0.1
Pg 13 (p.u) 0.12 0.12
Cost ($/h) 767 767.6
Start
Run the base case economic load dispatch for six units
End
Run base case load flow with optimal powers and find losses
Calculate the sensitivity index of each bus
Make a list of the most sensitivity buses
Select the top ranking bus as the optimal location for DG
Calculate the optimal size at the location
Run economic load dispatch by adding the DG
[image:5.595.41.270.307.673.2]© 2015, IRJET ISO 9001:2008 Certified Journal
Page 433
P loss (MW) 10.8 10.88
From equations (15), (16) the optimal location of wind DG is given as 30th bus and the optimal sizing is given as
[image:6.595.325.549.133.292.2]15MW. Table.3. gives the optimal powers, cost and power loss of the system by installing DG.
Table - 3. Comparison for Quadratic programming and
PSO with DG Quadratic Programming
PSO
Pg 1 (p.u) 1.8356 1.8356
Pg 2 (p.u) 0.4435 0.4435
Pg 5 (p.u) 0.1842 0.1842
Pg 8 (p.u) 0.1 0.1
Pg 11 (p.u) 0.1 0.1
Pg 13 (p.u) 0.12 0.12
DG (p.u) 0.15 0.15
Cost ($/h) 716 716
P loss (MW) 9.61 9.61
From Table.2. and Tale.3. the cost obtained by conventional and non-conventional method is almost same. After adding the DG at 30th bus of 15MW cost is
reduced by 5.9% and power loss reduced by 11.9% and are almost same in two methods are same. This paper proposes the PSO method is best.
Fihure.4. shows the voltage profile of the system with DG and without DG. Voltage profile is increased by installing the DG.
Fig.4. Voltage profiles of the system with and without DG
As the speed of wind is not constant the power penetrated into the system by DG also varies. Table.4.
gives the optimal powers, cost and power loss at different penetration levels.
Table - 4. Penetration level of wind DG
30% 50% 70% 100%
Pg 1(p.u) 1.94 1.93 1.87 1.8356
Pg 2(p.u) 0.4662 0.462 0.4511 0.4435
Pg 5(p.u) 0.1905 0.15 0.1863 0.1842
Pg 8(p.u) 0.1 0.1 0.1 0.1
Pg11(p.u) 0.1 0.1 0.1 0.1
Pg13(p.u) 0.12 0.12 0.12 0.12
DG (p.u) 0.045 0.075 0.105 0.15
Cost($/h) 62.5 743 732.32 716
Plos(MW) 10.6 10.47 9.8 9.61
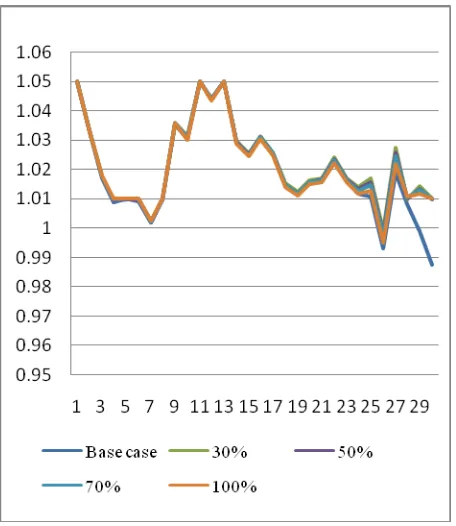
[image:6.595.316.544.348.611.2]From Table.4. cost and Power loss decreases with the increase in the penetration level of DG. Figure.5. shows the voltage profile at different penetration levels.
Fig.5. Voltage profiles at different penetration levels
10. CONCLUSION
In this paper economic load dispatch is done by Quadratic programming and PSO. And proposed that PSO is also better than Quadratic programming. After installing the DG of 15MW at 30th bus the power losses
[image:6.595.51.267.485.678.2]© 2015, IRJET ISO 9001:2008 Certified Journal
Page 434
REFERENCES
[1]. Purna Chandra Rao, M. Venkata Kritiga; Optimal Siting and Sizing of Distribution Generators in
Microgrids-IEEE INDICON 2012,7th-9th
December 2012
[2]. Aghaei J, Alizadeh MI. Demand response in smart electricity grids equipped with renewable
energy sources: A Review. Renewable and
Sustainable Energy Reviews, Feb.2013; 18:64-72.
[3]. Carvalho PMS, Correia PF, Ferreira L.
Distributed reactive power generation control for voltage rise mitigation in distribution networks. IEEE Transactions on Power Systems, 2008. 23(2):766-772.
[4]. Petinrin OJ, Shaaban M. Overcoming challenges of renewable energy on future smart grid.
TELKOMNIKA Indonesian Journal of Electrical Engineering, 2012. 10(2):229-234.
[5]. Amroune Mohammed , Bouktir Tarek. Power
System Transient Stability Analysis with High
Wind Power Penetration. International
Electrical Engineering Journal (IEEJ). Vol. 4 (2013) No. 1, pp. 907-913.
[6]. K. Folly, "Impact of Fixed and Variable Speed Wind Generators on the Transient Stability of a Power System Network," in IEEE/PES Power Systems Conference and Exposition, 2009. PSCE '09, Univ. of Cape Town, Cape Town , 15-18 March 2009, pp. 1-7.
[7]. L. Holdsworth, "Comparison of fixed speed and doubly-fed induction wind turbines during power system disturbances ," IEE Proceedings-Generation, Transmission and Distribution, vol. 150, no. 3, pp. 343-352, 2003.
[8]. Acharya N, Mahat P, Mithulananthan N. An analytical approach for DG allocation in primary distribution network. International Journal of Electrical Power & Energy Systems, 2006. 28(10):669-678.
[9]. M. Iannone and F. Torelli, "Acoherency-basedmethod to increasedynamicsecurity in power systems," Electric Power Systems Research, vol. 78, no. 8, p. 1425–1436, Aug. 2008.