International Journal of Emerging Technology and Advanced Engineering
Website: www.ijetae.com (ISSN 2250-2459, ISO 9001:2008 Certified Journal, Volume 7, Issue 10, October 2017)
80
Effect of Cutting Condition of Abrasive Water Jet on the Kerf
Geometry of Nickel Based Super Alloy
Arvind Kumar
1, Hari Singh
2, Vinod Kumar
31Department of Mechanical Engineering, C.E.C, Landran, Mohali, Punjab, India
2Department of Mechanical Engineering, N.I.T.Kurukshetra, Kurukshetra, Haryana, India
3
Department of Mechanical Engineering, Thapar University, Patiala, Punjab, India
Abstract- In this experimental study, an attempt has been
conducted to investigate the effects of abrasive water jet machine parameters on the Kerf geometry of Nickel based super alloy, Inconel 718. Experiment were carried out by varying four parameters such as water pressure , traverse speed, standoff distance and abrasive flow rate using response surface methodology (RSM) with Box Behnken Design (BBD). In order to determine the importance of each machine parameter on Kerf quality; ANOVA, was employed. Moreover by using Design Expert Software the mathematical model for Kerf width and taper were defined. It was observed that that pressure and traverse speed was the main factors which affect Kerf quality considerably.
Keywords- ANOVA, Box Behnken Design, Inconel 718,
Kerf taper, Response surface methodology.
I. INTRODUCTION
As the world is moving fast with new technology, the various industries such as nuclear, aerospace and power generation require an advanced material which should have some superior properties. One such material which can fill this void is Nickel based super alloy. Such materials are particularly well suited for the kind of services where high temperature environments, thermal shock, creep and corrosion resistance is required. It can maintain the requisite yield strength and toughness at very low and high
temperature (-250 to 7000C). These properties make them
ideal for jet engine, gas turbine and cryogenic storage tank. In this regard, Inconel 718 is used in the current investigation.
Apart from many advantages, it also possesses some limitation. Super alloy contains the constituents like Nickel or Titanium which make them difficult to machine due to
its rapid work hardening during machining by traditional
method like milling or turning. Limitation of conventional method drawn concern to use nontraditional technique for machining this kind of material. Among others, abrasive water jet machining is one of the leading nontraditional methods which now a days is used to machine very hard material.
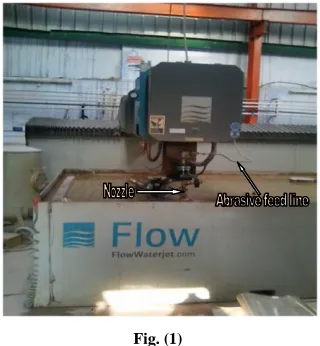
Abrasive water jet machining is most suitable method for various reasons such as no heat affected zone on work piece, multi directional cutting and its ability to cut any complex shapes [1]. The basic machine setups of AWJM are shown in Fig.1. In AWJM process, the target material is removed by the action of a high velocity jet of water mixed with abrasive particles based on the principle of erosion process which involve two distinct mechanisms depending upon whether the eroded material is brittle or ductile in nature [2-3].
Fig. (1)
Abrasive water jet machining is an unconventional machining process that has been used successfully in various industrial operations for surface preparation and peening. Considerable efforts have been made by various researchers from last 3 decades to study this cutting technology from various points of view such as depth of penetration, material removal, surface roughness, kerf geometry in order to have improved performance and thorough understanding of the process.
[image:1.612.365.525.368.541.2]International Journal of Emerging Technology and Advanced Engineering
Website: www.ijetae.com (ISSN 2250-2459, ISO 9001:2008 Certified Journal, Volume 7, Issue 10, October 2017)
81
Ay et al. [4] Hascalik et al.[5] and Ma and Deam [6] found the kerf quality of Inconel, titanium and acrylic plastic respectively by varying only traverse speed of jet. Uthayakumar et al. [7] observe the cutting performance of Inconel with three machine parameters such as pressure, traverse speed and standoff distance. Jegaraj and Babu [8] prepared a design for quality cutting of Aluminum alloy by changing the size of nozzle assembly. Palleda [9] performed number of machining trial on glass to check the effect of standoff distance on kerf taper. Shanmugam and Masood [10] used energy conservation approach to find best optimal parameters so that minimum kerf taper may produce.
On the basis of previous study it has been conclude that researchers have concentrated on a single quality characteristic as objective during optimization of AWJM. Optimum value of process parameters for one quality characteristic may deteriorate other quality characteristics and hence the overall quality. No literature is available on multi-objective optimization of AWJM on Inconel material so this paper has attempted to examine the Kerf characteristics so that an optimal combination of machine variables can be found for required engineering tolerance.
II. MATERIALS AND METHODS
Inconel 718 is Nickel based super alloy known for its tensile, high impact, and rupture strength. The chemical composition and mechanical properties are reported in Tables I and II respectively
III. EXPERIMENTAL SETUP AND PROCEDURE
Inconel 718 nickel based alloy plate of size 200*200*16 mm has been used for the present investigation. All the experiments were performed on a Flow Mach (4020B) water jet machine equipped with 5 axes cutting head and ultra-high pressure pump Fig.(1). During cutting,
parameters such as jet impact angle (900), size of garnet
abrasive (80 mesh), and focusing tube diameter(0.75mm) are kept constant while four parameters such as P, AFR, SOD & TS have been varied. Total twenty nine slots were cut in length of 10 mm on one side of the plate. The Kerf width (Wt & Wb) was measured at top as well as the bottom
face, (as shown in Fig.2) of the work piece with Mitutoyo
Profile Projector PJ-A3000. The
TABLE 1
CHEMICAL COMPOSITION OF INCONEL 78
C% Si% P% Mn% S% Cr% Ni% Mo% Al% Co% Ti% Nb% Cu%
0.08 0.35 0.015 0.035 0.015 21.0 55.00 3.3 0.80 1.0 1.15 5.5 0.30
TABLE II
MECHANICAL PROPERTIES OF INCONEL 718
Melting point
(oC)
Density g/cm3
Hardness (HV150)
Tensile strength (Mpa)
Yield strength (
Mpa)
Thermal conductivity
(W/mK)
Elastic Modulus
(Gpa)
Modulus of rigidity
(Gpa)
1336 8.19 370 800-1000 1110 11.2 204.9 77.2
Kerf angle for each slot is calculated using the following equation [4]
International Journal of Emerging Technology and Advanced Engineering
Website: www.ijetae.com (ISSN 2250-2459, ISO 9001:2008 Certified Journal, Volume 7, Issue 10, October 2017)
82
Fig.(2)[4]IV. DESIGN OF EXPERIMENTS
The machining was planned according to response surface methodology, RSM(Box-Behnken Design) with the
four parameters at three levels as shown in Table III.
Levels and parameters were selected according to the machine capability and past research work. RSM, a collection of mathematical and statistical techniques, is used for analysis of the relation between different descriptive variables and one or more response variables [11]-[13]. In this present work, design expert 6.08 version software has been used for developing the predictive model of machine parameters to obtain a good quality surface. The design of experiments (DOE) matrix with all twenty-nine experiments with the output response for the process parameters is presented in Table IV. In this study, an effort has been made to model the empirical relation among
machining parameters by using RSM. ANOVA was
applied to check the validity of regression model and determine the quadratic effect of machine parameters on
the output response function.
TABLE III
LEVELS OF MACHINE PARAMETERS
S.NO. Symbols Input Variables Levels
1 2 3
1 A Water pressure(P), psi 25000 37500 50000
2 B Abrasive flow rate(AFR), lb/min 0.7 1.1 1.5
3 C Stand-off distance(SOD), mm 0.6 3.3 6
[image:3.612.48.569.114.528.2]International Journal of Emerging Technology and Advanced Engineering
Website: www.ijetae.com (ISSN 2250-2459, ISO 9001:2008 Certified Journal, Volume 7, Issue 10, October 2017)
[image:4.612.69.551.158.530.2]83
TABLE IVDOE MATRIX WITH RESPONSE RESULTS
Machine Input Parameters Output Response
Run No. Pressure Abrasive flow rate
Stand-off distance
Traverse speed
Top Kerf Width
Bottom Kerf Width
Kerf Angle
psi lb/min mm mm/min mm mm Deg.
1 25000.00 1.10 3.30 20.00 1.019 0.749 0.484
2 50000.00 1.10 3.30 20.00 1.039 0.995 0.079
3 37500.00 1.10 0.60 60.00 0.916 0.535 0.682
4 25000.00 1.10 6.00 40.00 1.102 0.675 0.765
5 25000.00 1.10 3.30 60.00 0.936 0.524 0.738
6 37500.00 1.10 3.30 40.00 0.976 0.655 0.575
7 37500.00 1.10 3.30 40.00 0.984 0.662 0.577
8 37500.00 1.10 3.30 40.00 0.983 0.669 0.562
9 37500.00 0.70 3.30 60.00 0.994 0.512 0.863
10 50000.00 1.50 3.30 40.00 1.113 0.76 0.632
11 37500.00 1.10 6.00 20.00 0.893 0.896 0.005
12 50000.00 0.70 3.30 40.00 1.222 0.805 0.749
13 37500.00 1.10 6.00 60.00 0.98 0.594 0.691
14 37500.00 1.10 3.30 40.00 0.953 0.672 0.503
15 37500.00 0.70 3.30 20.00 0.927 0.803 0.222
16 37500.00 1.50 0.60 40.00 0.988 0.544 0.795
17 37500.00 1.50 3.30 20.00 0.837 0.76 0.138
18 37500.00 0.70 6.00 40.00 1.036 0.655 0.682
19 37500.00 0.70 0.60 40.00 0.956 0.542 0.741
20 37500.00 1.10 3.30 40.00 0.929 0.641 0.516
21 25000.00 1.50 3.30 40.00 1.182 0.532 1.164
22 37500.00 1.10 0.60 20.00 0.858 0.82 0.068
23 37500.00 1.50 6.00 40.00 0.972 0.581 0.700
24 50000.00 1.10 0.60 40.00 1.119 0.802 0.568
25 37500.00 1.50 3.30 60.00 0.975 0.491 0.866
26 50000.00 1.10 6.00 40.00 1.349 0.897 0.809
27 25000.00 0.70 3.30 40.00 0.913 0.581 0.595
28 25000.00 1.10 0.60 40.00 1.121 0.605 0.924
29 50000.00 1.10 3.30 60.00 1.319 0.625 1.242
V.RESULT AND DISCUSSION
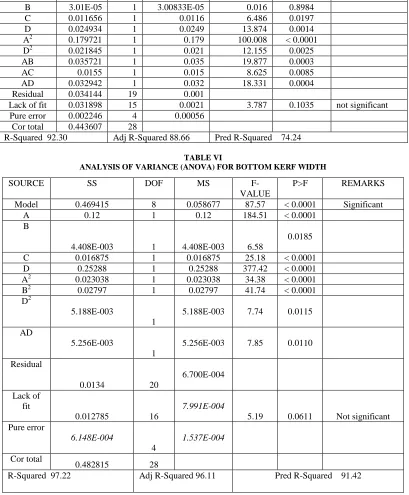
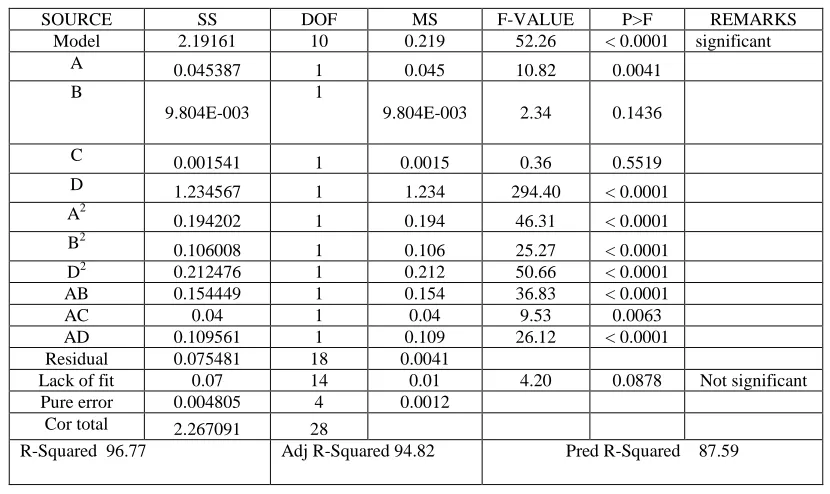
Tables V, VI and VII show the ANOVA result for top kerf width, bottom kerf width and kerf taper respectively. The p value < 0.05 (at confidence level) signify that the model is statistically significant. The model F- value 25.32, 87.57 and 52.26 from respective tables shows that model is
significant. The calculated R2 value(92.30, 97.22 and
96.67) from Table V, VI & VII showing that experimental and predicted values are in good correlation. The normal probability graph for both kerf width and taper (Fig. 3) showing that residual are coming along a straight line.
International Journal of Emerging Technology and Advanced Engineering
Website: www.ijetae.com (ISSN 2250-2459, ISO 9001:2008 Certified Journal, Volume 7, Issue 10, October 2017)
84
Top Kerf Width = +1.84166 – (7.13526E-005*Pressure) + (0.71271*AFR-0.057623*SOD) - (8.16288E-005*Traverse
speed) + (1.03275E-009*Pressure2) -
(1.40646E-004*Traverse speed2) - (1.89000E-005*Pressure*AFR) +
(1.84444E-006*Pressure*SOD) +
(3.63000E-007*Pressure* Traversespeed) Eq. 1
Bottom Kerf Width = + 0.59156 –
(1.41697E-005*Pressure) + (0.83868*AFR) + (0.013889 *SOD) –
(7.37489E-003*Traverse speed) + (3.74530E-010*
Pressure2) – (0.40300*AFR2) +(6.94257E-005*Traverse
speed2) – (1.45000E-007*Pressure*Traverse speed) Eq.2
Kerf taper = + 1.54871 – (7.95024E-005*Pressure) – (0.18083*AFR) – (0.11531*SOD) + (0.026756*Traverse
speed) + (1.08739E-009*Pressure2) + (0.78457*AFR2) –
(4.44299E-004*Traverse speed2) –
(3.93000E-005*Pressure*AFR) + (2.96296E-006*Pressure*SOD) +
(6.62000E-007*Pressure*Traversespeed) Eq.3
DESIGN-EXPERT Plot Top Kerf Width
Studentized Residuals N or m al % P ro ba bi lit y
Normal Plot of Residuals
-2.82 -1.53 -0.24 1.05 2.33 1 5 10 20 30 50 70 80 90 95 99 DESIGN-EXPERT Plot Bottom Kerf Width
Studentized Residuals N or m al % P ro ba bi lit y
Normal Plot of Residuals
-2.81 -1.73 -0.64 0.44 1.52 1 5 10 20 30 50 70 80 90 95 99 DESIGN-EXPERT Plot kerf taper Studentized Residuals N or m al % P ro ba bi lit y
Normal Plot of Residuals
-2.77 -1.62 -0.47 0.68 1.83 1 5 10 20 30 50 70 80 90 95 99
(a) (b) (c)
Fig.3 Normal Plot Vs. Residiual (a) at top kerf width, (b) bottom kerf width(c) kerf taperDESIGN-EXPERT Plot Top Kerf Width
Actual P re di ct ed
Predicted vs. Actual
0.84 0.96 1.09 1.22 1.35
0.84 0.96 1.09 1.22 1.35
DESIGN-EXPERT Plot Bottom Kerf Width
Actual P re di ct ed
Predicted vs. Actual
0.47 0.61 0.75 0.89 1.04
0.47 0.61 0.75 0.89 1.04
DESIGN-EXPERT Plot kerf taper Actual P re di ct ed
Predicted vs. Actual
-0.01 0.29 0.58 0.87 1.16
-0.01 0.29 0.58 0.87 1.16
(a) (b) (c)
International Journal of Emerging Technology and Advanced Engineering
Website: www.ijetae.com (ISSN 2250-2459, ISO 9001:2008 Certified Journal, Volume 7, Issue 10, October 2017)
85
TABLE VANALYSIS OF VARIANCE (ANOVA) FOR TOP KERF WIDTH
SOURCE SS DOF MS F-VALUE P>F REMARKS
Model 0.409463 9 0.0454 25.31 < 0.0001 Significant
A 0.065712 1 0.0657 36.56 < 0.0001
B 3.01E-05 1 3.00833E-05 0.016 0.8984
C 0.011656 1 0.0116 6.486 0.0197
D 0.024934 1 0.0249 13.874 0.0014
A2 0.179721 1 0.179 100.008 < 0.0001
D2 0.021845 1 0.021 12.155 0.0025
AB 0.035721 1 0.035 19.877 0.0003
AC 0.0155 1 0.015 8.625 0.0085
AD 0.032942 1 0.032 18.331 0.0004
Residual 0.034144 19 0.001
Lack of fit 0.031898 15 0.0021 3.787 0.1035 not significant Pure error 0.002246 4 0.00056
Cor total 0.443607 28
[image:6.612.103.512.195.690.2]R-Squared 92.30 Adj R-Squared 88.66 Pred R-Squared 74.24
TABLE VI
ANALYSIS OF VARIANCE (ANOVA) FOR BOTTOM KERF WIDTH
SOURCE SS DOF MS
F-VALUE
P>F REMARKS
Model 0.469415 8 0.058677 87.57 < 0.0001 Significant
A 0.12 1 0.12 184.51 < 0.0001
B
4.408E-003 1 4.408E-003 6.58
0.0185
C 0.016875 1 0.016875 25.18 < 0.0001
D 0.25288 1 0.25288 377.42 < 0.0001
A2 0.023038 1 0.023038 34.38 < 0.0001
B2 0.02797 1 0.02797 41.74 < 0.0001
D2
5.188E-003
1
5.188E-003 7.74 0.0115
AD
5.256E-003
1
5.256E-003 7.85 0.0110
Residual
0.0134 20
6.700E-004
Lack of fit
0.012785 16
7.991E-004
5.19 0.0611 Not significant Pure error
6.148E-004
4
1.537E-004
Cor total
0.482815 28
International Journal of Emerging Technology and Advanced Engineering
Website: www.ijetae.com (ISSN 2250-2459, ISO 9001:2008 Certified Journal, Volume 7, Issue 10, October 2017)
[image:7.612.98.513.160.407.2]86
TABLE VIIANALYSIS OF VARIANCE (ANOVA) FOR KERF TAPER
SOURCE SS DOF MS F-VALUE P>F REMARKS
Model 2.19161 10 0.219 52.26 < 0.0001 significant
A 0.045387 1 0.045 10.82 0.0041
B
9.804E-003
1
9.804E-003 2.34 0.1436
C 0.001541 1 0.0015 0.36 0.5519
D 1.234567 1 1.234 294.40 < 0.0001
A2 0.194202 1 0.194 46.31 < 0.0001
B2 0.106008 1 0.106 25.27 < 0.0001
D2 0.212476 1 0.212 50.66 < 0.0001
AB 0.154449 1 0.154 36.83 < 0.0001
AC 0.04 1 0.04 9.53 0.0063
AD 0.109561 1 0.109 26.12 < 0.0001
Residual 0.075481 18 0.0041
Lack of fit 0.07 14 0.01 4.20 0.0878 Not significant
Pure error 0.004805 4 0.0012 Cor total 2.267091 28
R-Squared 96.77 Adj R-Squared 94.82 Pred R-Squared 87.59
VI. CONCLUSION
In this study, effect of abrasive water jet machine parameters on top kerf width, bottom kerf width and kerf taper of Inconel 718 was investigated. Response surface methodology (RSM) with Box Behnken Design (BBD) was used to find the quadratic effect of water pressure, abrasive flow rate, standoff distance and traverse speed on three kerf qualities. On the basis of experimental result and ANOVA analysis the following conclusion were drawn as follows;
1. It was found that water pressure and traverse speed,
the two most significant parameters effectively controls the top and bottom kerf width while Abrasive flow rate was found as an insignificant parameter for top kerf.
2. Traverse speed was the major parameter which
controls the kerf angle produced in abrasive water jet machining.
3. ANOVA analysis revealed that the actual and
predicted values show an excellent fit between the regression model and the experimental value.
Acknowledgement
The authors highly appreciate Mr. Rishi, Dass Electronics, Dehradoon, India for providing the necessary machine facilities of abrasive water jet and their assistance during experiment work.
REFERENCES
[1] Jurisevic, B., Brissaud, D., Junkar, M. (2004): Monitoring of abrasive water jet (AWJ) cutting using sound
detection, The International Journal of Advanced Manufacturing Technology, 24: 733–737.
[2] Metin, K., Erdogan, K., Omer, E. (2011): Prediction of surface roughness in abrasive waterjet machining of particle reinforced.
[3] Chen, F.L., Siores, E. (2003): The effect of cutting jet variation on surface striation formation in abrasive water jet cutting, Journal of Materials Processing Technology, 135: 1-5. [4] Ay, M., Caydas, U., Hascalik,A.(2010): Effect of Traverse
Speed on Abrasive Water jet Machining of Age Hardened Inconel 718 Nickel-Based Superalloy, Materials and Manufacturing Processes, 25:10, pp.1160–1165.
International Journal of Emerging Technology and Advanced Engineering
Website: www.ijetae.com (ISSN 2250-2459, ISO 9001:2008 Certified Journal, Volume 7, Issue 10, October 2017)
87
[6] Ma,C., Deam,R.T.(2006): A correlation for predicting the kerfprofile from abrasive water jet cutting, Experimental thermal and fluid Science 30, pp. 337–343.
[7] Uthayakumar,M.,Khan,M.A, umaran, S.T., Slota A., Zajac,J.(2015): Machinability of Nickel-based Superalloy by Abrasive Water Jet Machining, Materials and Manufacturing Processes , pp. 1733-1739.
[8] Jegaraj,J.J.R., Babu,N.R.(2005): A strategy for efficient and quality cutting of materials with abrasive water jet Considering the variation in orifice, International Journal of Machine Tools & Manufacture, vol.45, pp1443–1450 [9] Palleda,M.(2007): A study of taper angles and material
removal rates of drilled holes in the abrasive water jet machining process, Journal of Materials Processing Technology, vol.189, pp 292–295.
[10] Shanmugama,D.K.,Masood,S.H .(2009):An investigation on kerf characteristics in abrasive water jet cutting of layered composite, Journal of Materials Processing Technology, vol. 209, pp. 3887–3893.
[11] Kumar,A.,Kumar.V,.Kumar.J.(2013):Investigation of machining parameters and surface integrity in wire electric discharge maching of pure titanium, Proceeding of the institution of mechanical peers PartB: Journal of engineering Manufacture, Vol 227, pp 972-992
[12] Mohal,S.,Kumar,H.(2016): Parametric of multiwalled carbon nanotube –assisted electric discharge machining of Al-10%SiCp metal matrix composite by response surface methodology, Materials and Manufacturing Processes,32:3, pp263-273.
![Fig.(2)[4]](https://thumb-us.123doks.com/thumbv2/123dok_us/8682278.874998/3.612.48.569.114.528/fig.webp)