2019 International Conference on Computer Science, Communications and Big Data (CSCBD 2019) ISBN: 978-1-60595-626-8
Research on Financial Fraud Forecasting Recognition
Based on Machine Learning
Jia-kun ZHAO and Peng YAO
*School of software, Xi'an Jiaotong University, Shaanxi, 710049, China
*Corresponding author
Keywords: Financial Statement Fraud, Machine Learning, Chinese listed company, Ensemble
learning.
Abstract. This paper collects and pre-processes the financial statements of listed companies from the official website of the China Securities Regulatory Commission, Shanghai Stock Exchange and Shenzhen Stock Exchange, and then uses Logistic Regression, SVM, Decision Tree, Random Forest, Adaboost and XGBoost to built predictive models of 150 fraud companies and 523 non fraud companies of similar asset sizes.
Introduction
Financial statements have always been the focus of attention of investors, audit firms, governments and other capital market stakeholders, and fraud has always affected the quality of financial statements. Therefore, we have to develop a financial fraud prediction model to ensure the authenticity of the financial statements. Therefore, the purpose of this study is to investigate whether financial fraud prediction models can be developed through financial statements and schedules from Chinese listed companies. This article uses a variety of machine learning algorithms when developing models.
Financial fraud is a world-class problem, especially after the new century, financial fraud has become more and more serious in the past decade. Forecasting financial fraud has become a hot topic. The United States has issued audit standards specifically requiring auditors to assess financial fraud, and auditors who fail to detect financial fraud will bear legal consequences. In particular, relevant companies and leaders will receive more serious financial penalties. Of course, the Chinese government has also formulated laws in a targeted manner and has increased management. Many researchers and practitioners at home and abroad are trying to find the right model to predict financial fraud. In this article, I did an in-depth study after pre-processing the public data of various financial statements. Various algorithms have a high recognition rate, and XGBoost has the highest recognition rate in identifying fraud companies. The second chapter is a literature review. The third chapter introduces the process of data collection and preprocessing, and then extracts the features. The fourth chapter introduces the algorithm and builds the model. The fifth chapter has done many experiments on various algorithms and optimized the parameters. The sixth chapter summarizes the conclusions. Chapter 7 did the next research project.
Literature Reviews
in the year before the bankruptcy of the company). And as the bankruptcy period approaches, the discriminating success rate also increases. Altman (1968) [3] proposed a multivariate linear decision model. He integrated multiple variables into the equation determined by the Z-value and then used 33 bankrupt companies and 33 non-bankrupt companies to match. After screening 22 variables and multiple experimental verifications, five characteristic variables were finally determined. Tang Qinrui, Chen Saiya, He Ying[4] selected 101 companies with financial fraud in the companies listed in Shanghai and Shenzhen during the decade from 1996 to 2005 as research objects, and then on the basis of same period of time, similar scale, same industries and same or similar products he selected 101 matching listed companies that had no financial fraud. Logistic regression, decision tree and neural network model were analyzed and compared respectively. The results show that logistic regression performs better. Chen Xiaohe and Chen Zhihong[5] When predicting ST in 2000, the best predictor combination model found was multivariate logistic regression, which correctly identified 73.68% of STs from all listed companies with ROE announcements less than 5% in the previous year. The overall accuracy of the company is 78.24%. Fang Junxiong[6] used 31 fraud indicators and 60 health companies as data samples from 1989 to 2000. Through screening, six correlation indicators were used to construct LPM and Logistic models. Through analysis, Logistic model is better for identifying financial fraud. Chen et al.[7] selected a fraudulent company that existed in 1998-2004 as a sample, and passed the T test and eliminated the highly relevant indicators, and finally selected 15 features. The recognition model was built using the logit method and achieved good accuracy. Li Jun[8] constructed a fraud identification model by using the support vector machine algorithm to select 212 companies as data sets by 1:1 ratio. In the study, the author added non-financial variables, effectively improving the accuracy of financial fraud identification, achieving a 72% accuracy rate. Zhang Xiaobao[9] identified 70 companies with financial fraud from 1,300 listed companies from 1994 to 2006, and built them through decision tree, regression tree, BPNN, KNN, logistic regression and Bayesian network. The model is analyzed and each algorithm is analyzed.
Data Sources and Feature Selection
Data Sources
This paper selects 150 companies with financial fraud from companies listed in China from 1993 to 2016 as the research object, as well as 523 matching fraud-free companies of the same period and assets. Among the 673 companies, we selected a total of 2692 data in four quarters as a sample of data. The financial fraud warning model was constructed by selecting 36 financial variables as the characteristic indicators by the fraud behavior of listed companies and the experience of the predecessors. In the 2692 data, we use the 5 fold cross validation method to select 80% of the data as the training set, and then use the remaining 20% of the data as the test set to effectively test the model.
The data in this article are all collected by individuals. The fraud samples are from the official website of the China Securities Regulatory Commission, Shanghai and Shenzhen Exchange. Before calculating the financial indicators, we filled in the missing values and deleted some data with a large amount of data to ensure the accuracy of the data.
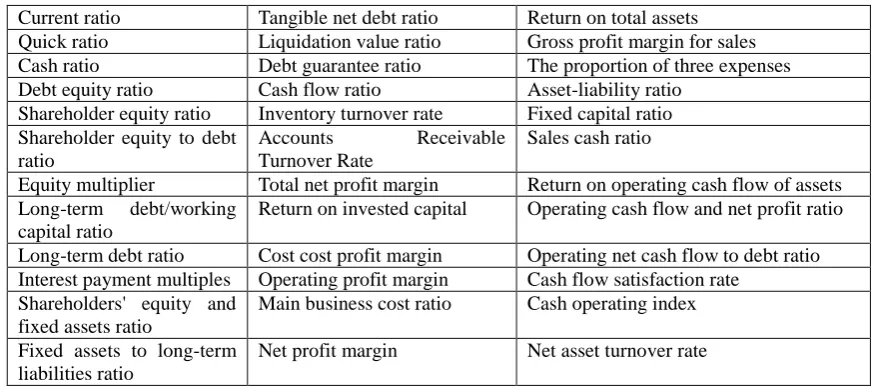
Explanation of Financial Feature
Table 1. Financial feature.
Current ratio Tangible net debt ratio Return on total assets
Quick ratio Liquidation value ratio Gross profit margin for sales
Cash ratio Debt guarantee ratio The proportion of three expenses
Debt equity ratio Cash flow ratio Asset-liability ratio
Shareholder equity ratio Inventory turnover rate Fixed capital ratio Shareholder equity to debt
ratio
Accounts Receivable
Turnover Rate
Sales cash ratio
Equity multiplier Total net profit margin Return on operating cash flow of assets Long-term debt/working
capital ratio
Return on invested capital Operating cash flow and net profit ratio
Long-term debt ratio Cost cost profit margin Operating net cash flow to debt ratio Interest payment multiples Operating profit margin Cash flow satisfaction rate
Shareholders' equity and fixed assets ratio
Main business cost ratio Cash operating index
Fixed assets to long-term liabilities ratio
Net profit margin Net asset turnover rate
Research Methods and Models
Machine learning is an interdisciplinary subject. It involves many disciplines such as probability statistics and algorithm theory. It specializes in the development of things and human behavior patterns, so as to acquire new knowledge and skills, constantly improve their abilities, and use machines to simulate people. The behavior thus helps people more effectively. It is used in many fields such as finance, medical care, and national defense security. This paper uses a variety of machine learning algorithms to make prediction models for financial fraud, including logistic regression (LR), support vector machine (SVM), decision tree, random forest, XGBoost and adaboost.
Logistic Regression
Logistic regression, as the preferred algorithm for classification, has always been the object of choice for researchers. Its core idea is to map the output x of the linear regression to h(x) and use the sigmoid function to form a probability value h_θ (x) of 0 to 1. The classification class is determined by comparison with a certain probability threshold, the loss function is derived by the maximum likelihood, and the loss function is minimized by the gradient descent method, and the optimal LR model is obtained by continuously updating.
Support Vector Machine (SVM)
The support vector machine is mainly for the two-class problem. Because it can find the optimal support vector in a training set, and then get the best classification hyperplane, it is very effective for the two-class problem. Because the dimension is too high, it is necessary to introduce a nuclear method to form a kernel function, and then find the optimal hyperplane to classify the data. With a high efficiency in training and no special requirements on the size of the data set, it has been widely used by researches.
Decision Tree (DT)
to determine the optimization points. Afterwards, the pruning method is used to avoid over-fitting and improve the generalization ability of the decision tree.
Random Forest (Random forest)
A random forest is a classifier synthesized by multiple decision trees. A strong classifier is constructed by multiple weak classifiers, which can enhance the generalization ability of the classification model. We can randomly select features to build a forest. Of course, it is different from the decision tree. It does not select features by information gain or Gini coefficient, but randomly selects them. This also ensures that it prevents most overfitting and guarantees strong generalization. Therefore, it is suitable for this study.
Adaboost
Boosting is a strong classifier algorithm that is synthesized by a variety of weak classifiers. If the weak classifier is of the same type, then it is the base learner, otherwise it is the component learner. When Adboost is running, the same weight is given to each data sample during training, and the error rate is calculated. Then, the sample weight of the last error is adjusted in the training, so that the weight is optimized after multiple repetitions of training, and the weights are summed. It has always been 1 during training. It is an adaptive algorithm that improves the loss function to an exponential loss function. Through training multiple weak classifiers on the same training data set, a strong classifier is generated after weighting the weak classfiers together.
XGBoost
XGBoost is a fast implementation of a gradient descent algorithm that adds a regular term to the GBDT algorithm to prevent overfitting. It uses the Taylor function to develop the second order expansion of the loss function. In this way, we will make the loss function only related to the previous step, and more accurate. It adds a regularization term to the cost function, which makes the model output smoother and effectively prevents over fitting. In terms of speed, first XGBoost's package is written in C/C++, which is faster. Second, it divides and sorts features so that it can parallelize calculations when looking for the best split point. In terms of speed, it is faster than GBDT. By reasonably setting the block size, the CPU cache is fully utilized for reading acceleration, so that the data reading speed is greatly improved.
Experimental Results
Algorithm Comparison
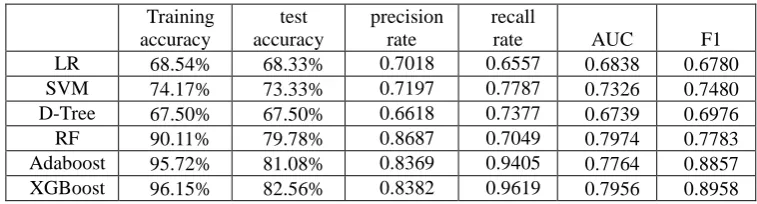
[image:4.595.107.486.614.716.2]After optimizing the parameters of the six classification algorithms by 5-fold cross-validation, the results of the samples were analyzed by using the training set and the test set samples. The results are shown in Table 2 below:
Table 2. Comparison of performance of six algorithms.
Training accuracy
test accuracy
precision rate
recall
rate AUC F1
LR 68.54% 68.33% 0.7018 0.6557 0.6838 0.6780
SVM 74.17% 73.33% 0.7197 0.7787 0.7326 0.7480
D-Tree 67.50% 67.50% 0.6618 0.7377 0.6739 0.6976
RF 90.11% 79.78% 0.8687 0.7049 0.7974 0.7783
Adaboost 95.72% 81.08% 0.8369 0.9405 0.7764 0.8857
XGBoost 96.15% 82.56% 0.8382 0.9619 0.7956 0.8958
Random forest is a strong classifier algorithm, which does not need to make feature selection. Because of the independence between trees, the training speed is faster through parallelization. Therefore, the effect of the model is greatly improved. Random forests can balance errors in dealing with imbalances. In summary, the effect of random forests reached 90.11% training accuracy and 79.78% test accuracy.
Based on the RF, the Adaboost algorithm fully considers the weight of each decision tree and cascades it by the weight of each classifier to achieve higher accuracy than RF. while Adaboost is inferior to RF only on the precision and AUC ,indicating that the two classifiers have their own advantages.
The boosting algorithm XGBoost is slightly better than Adboost, and is only lower than the random forest in the precision and AUC. Although both are lifting algorithms, XGBoost is slightly better than the Adaboost algorithm in every respect.
Variable Importance Analysis
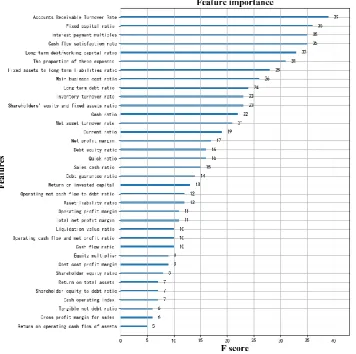
[image:5.595.123.480.310.664.2]XGBoost modeling can determine the extent to which the characteristic variables affect the model. Therefore, we are more focused on these characteristics. The importance scores (F scores) are arranged from large to small, as shown in Figure 1.
Figure 1. Characteristic variable importance.
In Figure 1, we can see that the top five most influential F scores are the accounts receivable turnover rate, fixed capital ratio, interest payment multiple, cash flow adequacy ratio and long-term debt to working capital ratio.
the net sales of credit sales to the average balance of accounts receivable. If a company's accounts receivable turnover rate is high, the faster the recovery funds, the better the business operation. On the contrary, the low turnover rate will inevitably affect the company's operating turnover. This parameter is necessary to draw attention.
2. Fixed capital ratio: refers to the ratio of fixed capital to total assets, which reflects whether the company has indicators of idle funds. If the ratio is very low, then there will be very little idle funds, the company's funds can be fully utilized, and operational capabilities will be strengthened.
3. Interest payment multiple: The ratio of interest-earning profit before interest to interest expense reflects the company's ability to pay interest on operating profit. The lower the indicator, the greater the debt pressure. It is a manifestation of a company's long-term debt repayment ability.
4. Cash flow adequacy ratio: The ratio of long-term liabilities, capital expenditures and dividend payments to the net cash flow from operating activities. It is reflected in the company's operational capabilities and profitability. When the ratio increases, it indicates that the company's income is improved and its operating capacity is enhanced. However, if the ratio is particularly large, it means that the company's funds are not suitable for use, which will inevitably affect the company's operational capacity.
5. Long-term debt to working capital ratio: refers to the ratio of long-term debt and current assets to current liabilities, reflecting an indicator of the company's long-term debt repayment ability. In the process of debt repayment, long-term liabilities slowly flow to current liabilities. The lower the ratio, not only guarantees short-term debt repayment ability, but also indicates the strengthening of long-term debt repayment ability.
These five variables have the greatest impact on predicting fraud, most likely due to improper use by managers. In addition, the importance of other features is reduced, but we cannot ignore it. When selecting variables, we need to be targeted, taking into account other variables and prioritizing them.
Conclusion
In this paper, three weak classifiers LR, SVM and D-Tree and three strong classifiers random forest, Adaboost, XGBoost are used. Artificial feature extraction and classification modeling are carried out based on the financial statements data of Chinese listed companies. The parameters in the model are optimized one by one, and the training and test accuracy, recall rate, F1 value and AUC value of the output 5-fold cross-validation operation are used to judge the pros and cons of the model. By analyzing the importance of variables, we describe the top five variables of the model contribution. This research not only has the auditor's discovery of fraud, but also has guiding significance for groups such as banks and customers, and has important practical value.
Next Step Plan
Of course, this article still has certain limitations: The first is that the sample is only for Chinese listed companies, and cannot predict the financial fraud of all companies; the second is that this article only refers to the financial statement data, and does not select non-financial data. Non-financial data such as board composition and corporate management must increase the accuracy of the model.
Acknowledgements
In the process of writing this paper, I got the careful guidance of two teachers, Jiakun Zhao and Jun Xie. In the process of completing this paper, he put forward a lot of constructive guidance to me, carefully explained the problems in my paper and encouraged me. Here I sincerely pay tribute to Teacher Zhao. At the same time, I would like to thank my school for creating a learning environment that allows me to complete my thesis in a good learning atmosphere. Finally, I would like to thank my family and my classmates for their support during this period.
References
[1] Fitzpartrick P.J.A Comparison of Ratios of Successful Industrial Enterprises with those Failed Firms [J].Certified Public Accountant, 2007(23):256-278.
[2] Beaver, William. H. Financial Ratios and Predictors of Failure. Empirical Research in Accounting[J].Selected Studies Supplement to Journal of Accounting Research, 1966(4): 223-265.
[3] Altman, Edward I. Financial ratios Determinant Analysis and the Prediction of corporate Bankruptcy [J].Journal of Finance, 1968(9):146-169.
[4] Qin-rui Tang, Sai-ya Chen, Ying He. Empirical Study on Financial Statement Fraud in China's Listed Companies--Based on Neural Network, Decision Tree and Logistic Regression Model [EB/OL]. Beijing: Science paper Online [2010-09-26].
[5] Xiao Chen, Zhi-hong Chen. Financial Distress Prediction of Chinese Listed Companies[J]. China Accounting and Finance Review, 2000(3): 55-92.
[6] Jun-xiong Fang. An empirical study on the identification of financial fraud in listed companies in China. Listed company, 2003, (4): 40-45.
[7] Shou Chen, Fang Yang, Duan Liu. Financial Fraud Identification Model of Listed Companies and Its Application[J]. Statistics and Decision, 2007(6).
[8] Jun Li. Research on Financial Fraud Identification of Listed Companies Based on SVM[D]. Hunan University, 2009.