2019 International Conference on Computer Science, Communications and Big Data (CSCBD 2019) ISBN: 978-1-60595-626-8
Study on Passenger Flow Density Classification
Method of Subway Station
Lei GU
1, Ting-yu YIN
1and Zheng-yu XIE
1,*1
School of Traffic and Transportation, Beijing Jiaotong University, Beijing, 100044, China
*Corresponding author
Keywords: Classification method, Crowd density, Subway station.
Abstract. Based on the current situation of passenger flow in Guangzhou Metro, this paper summarizes the shortcomings and possible risks of passenger transport organization. And after analyzing the current main methods of monitoring crowd density, and the crowd density detection algorithm in video surveillance and subsequent video processing, this paper proposes a crowd density classification method based on frame difference method with its application direction, which optimizes the existing subway station crowd control measures as well as helps subway station operators accurately identify the stage of crowd density in real time and take crowd control measures in time.
Introduction
Since the beginning of the 21st century, China's steady economic development has led to a sharp rise in urban traffic demand. As the backbone of modern urban public passenger transport system, urban rail transit system has entered a rapid development period. At present, metro accounts for 77.6% of the urban rail transit in China It can be seen that the subway accounts for a large proportion in urban rail transit and is one of the most important modes of transportation.
With the continuous deepening of the network operation of urban rail transit and the rapid increase of network passenger flow in China's major cities, daily operation often faces the pressure of large passenger flow under normalcy or unexpected events. The key to improve the efficiency and safety of network operation is monitoring the passenger flow and its direction at different levels of network, line and station in real time. In the urban macroscopic background, the problem of urban public security caused by the dynamic migration of passengers and the high-density distribution has attracted more and more social attention.
As a large-scale passenger flow gathering and distributing place, high-density passenger flow gathers at the station, which is very easy to cause public safety incidents, especially in the morning and evening rush hour or when large-scale events are being held. Once the passenger flow exceeds the capacity limit of the facilities in the station, the comfort degree of the passengers will severe drop; if there are vehicle accidents, train delays, station fires and other situations, it is very easy to cause large-scale disorderly crowded passenger flow in the station, resulting in serious consequences. Therefore, in order to prevent the hidden danger caused by the high density passenger flow, it is necessary for the station operators to know the passenger flow density at the key facilities of stations in real time.
Crowd Density Control Methods and Their Deficiencies
Control Measures of Guangzhou Metro Stations
incoming and outgoing passenger flow of the station is gathered through the number of people entering and leaving the station. The statistics of passenger flow on the day or history are usually generated after the daily operation of rail transit is stopped.
Deficiencies in Existing Control Methods
Although the present method is objective and accurate, station operators can only get the overall passenger flow situation of stations, rather than the passenger flow situation in stations’ functional areas and key facilities because this method is based on the incoming and outgoing passenger flow of gates. Therefore, station operators cannot grasp the dynamic passenger flow situation of the rail transit network, and it is difficult for them to formulate the passenger organization and relief plan for passenger congestion sections at early time. On the other hand, to the great extent, the time to start control measures of all levels also depends on the subjective judgment of staff. Because of the differences in work experience, professionalism, personality and other factors, the effects of passenger flow control at different stations are different, and it is difficult to form a universal standard specification. At the same time, it will lead to the passive response of passenger traffic safety emergency response, and cannot give full play to the initiative of video surveillance system.
Solutions
In order to help subway operators grasp the real-time operation status and passenger flow distribution of the line network, the existing video surveillance system should be used to monitor and count real-time passenger flow. Because the individual passenger error has little effect on the real-time passenger flow state under the condition of high-density passenger flow, so classifying the real-time passenger flow density by intelligent analysis video surveillance is a method which can satisfy requirements of timeliness and accuracy of passenger transport organization, to help operators grasp the status and distribution of passenger flow in real time and make them can adopt different operation organization measures according to the density level in time. Based on this, in order to support passenger flow early warning and control work, this paper divides the passenger flow density into three levels, low, medium, high, and uses the crowd density grading algorithm to detect the state of passenger flow density in real time .
The Crowd Density Detection Algorithm
Comparison between Main Detection Methods
Methods of Extracting the Foreground Images. In the detection, the key of detecting crowd density is to extract the foreground image of passengers. At present, the commonly used methods are background difference method, optical flow method, Gaussian mixture model based method, inter-frame difference method and so on.
Background Difference Method. Background difference method detects moving objects by comparing the current image with the background image. This method has the advantages of fast, accurate and easy implementation, but its detection effect is not stable enough, which depends on the selection of background model. In practical applications, due to the complexity, unpredictability of the scene, as well as the existence of various environmental disturbances and noises, such as sudden changes in illumination, the fluctuation of some objects in the actual background image, camera jitter, the impact of moving objects entering or leaving the scene on the original scene, the background model will need to be constantly renewing.
constant; the frame taking time of adjacent video frames is continuous or the motion of objects between adjacent frames is "small"; keeping spatial consistency, that is, the pixels of the same sub-image have the same motion. But the three hypotheses of the optical flow method are difficult to satisfy in the subway station.
Gaussian Mixture Model Based Method. It is very difficult to describe the complex background completely by using a single Gaussian model, so it is more common to use the Gaussian mixture model in video processing. However, after modeling background based on the Gaussian mixture model, the extracted binary image often contains large shadows. Besides, when the moving object changes slowly, it is easy to distinguish the target area as the background. When the subway station has a large-scale passenger flow in the rush hour, the speed of the crowd is relatively slow, so it will be difficult to ensure the accuracy of crowd density detection at this time.
Inter-frame Difference Method. Inter-frame difference method obtains moving object’s contour by differential operation between two adjacent frames in video image sequence. The algorithm can avoid updating the background model, accurately detect the pixels of the foreground target, and be realized simply, with strong adaptability to light changes, and good stability. The disadvantage is that the whole region of the object cannot be extracted, but only the boundary. In addition, the choice of time interval between frames directly affects the detection effect.
Summary. Generally speaking, although each method has different defects, the background difference method and the inter-frame difference method may be more appropriate for the passenger density detection of Guangzhou Metro Station, which has less background and light changes as well as the dual requirements of timeliness and accuracy. However, because the inter-frame difference method can extract the foreground image of the video image more quickly, the inter-frame difference method is chosen.
The Process of Passenger Flow Density Detection and Grading
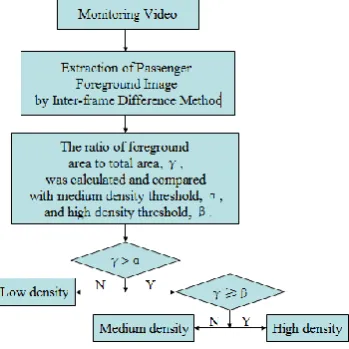
[image:3.595.213.388.517.692.2]The specific process of classification is shown in Figure 1. Firstly, the foreground image of the crowd in the surveillance video is extracted by the inter-frame difference method, and then the relationship between the ratio of foreground area to the total area, γ, and the middle density threshold, α, and the high density threshold, β, is calculated. If γ≥α, it indicates that the population density is above the medium density and continues to be judged, otherwise it will be in the low density stage. If γ≥β, the crowd density is in the high density stage, otherwise it will be in the medium density stage.
Figure 1. Flow chart of crowd density detection and classification.
measures to control and limit passenger flow, as well as using broadcasters or personnel at key facilities to strengthen guidance. When the density is high, the passenger movement is obviously hindered, and passengers have to queue up to get on the train. Operations must take immediate measures, such as restricting passenger arrivals, setting up diversion facilities, adding trains, and increasing radio propaganda to prevent accidents.
Determination of the Grading Thresholds
The determination of classification thresholds is mainly based on questionnaire survey. Firstly, the surveillance video is separated into images, and representative images with different passenger densities are selected arranged by density from low to high. Then, the passengers were randomly selected from different subway stations and asked to choose the density grading points they thought. When the sample size reaches a certain number, the average value of statistical data is calculated. The final obtained two average values are the thresholds of population density.
Application Directions
For Operational Managers
Operational managers can adopt different passenger flow control measures according to the crowd density level measured. For stations, the classification result is actually a kind of early warning about the large passenger flow, through which operators can quickly know the distribution of passenger flow in all parts of the station. Once the density of passenger reaches the medium-density threshold, managers can judge the possibility of high-density passenger flow combining with previous experience, so as to be prepared in advance and deal with it in time when various emergencies occur, and avoid issuing wrong signals, taking inappropriate measures arousing the dissatisfaction of passengers, even leading to stampede accidents and comprehensive treatment disputes because of being caught off guard.
For Passengers
As an intuitive signal, the graded distribution information of crowd density can directly and clearly tell passengers the congestion situation at the facilities of subway stations. Under alternative circumstances, passengers will not be willing to go to crowded places. Therefore, the application of crowd density classification can not only help subway operators, but also help ordinary passengers. At the same time, in order to make passengers better know the situation, stations should take various methods to broaden the information dissemination channels, such as optimizing the subway website and other existing platforms, setting up crowd density information display boards outside the station entrance, and pushing notifications with communications, news, weather and other operators. After the completion of the crowd density information dissemination system, passengers will voluntarily move to the direction of low crowd density without special reminders from subway stations, thus balancing the passenger flow and maximizing the use of train capacity.
Conclusion
References
[1] Chen Wei, Cai Shi, Jiang Qiwei. Dynamic monitoring and control decision-making system for passenger flow at subway stations based on multi-source data [J].Urban Public Transport, 2017, (4): 23-28. DOI:10.3969/j.issn.1009-1467.2017.04.007.
[2] Wang Yanhui, Luo Jun, Zhang Chenchen. Design and Implementation of Safety Risk Management Information System for Urban Rail Transit Construction Based on GIS [J]. Transportation System Engineering and Letter Interest, 2010, (4): 33-37. DOI:10.3969/j.issn.1009-6744.2010.04.005.
[3] Jiang Yanlu, Zhang Wentao. Feasibility Study and Analysis of Xi'an Metro Passenger Flow Monitoring and Early Warning Information System [J]. Urban Express Rail Transit, 2018, (2): 8-11. DOI:10.3969/j.issn.1672-6073.2018.02.002.
[4] Shen Na, Li Ning, Chang Qinglong. Population density estimation method based on improved Gaussian mixture model [J].Computer and Digital Engineering, 2012, (7): 108-111. DOI:10.3969/j.issn.1672-9722.2012.07.037.
[5] Hao Huiqin, Wang Yaoli.Moving target detection based on inter-frame difference and pyramid optical flow[J].Television technology, 2016, (7): 134-138. DOI:10.16280/j.videoe.2016.07.029.
[6] Li Liang, Luo Yi. Application of frame difference method in video surveillance [J].Journal of Sichuan Institute of Technology (Natural Science Edition), 2015, (6): 58-62. DOI:10.11863/j.suse.2015.06.12.
[7] Wang Jifang. Control Strategy of Large Passenger Flow in Guangzhou Metro Network Station [J].Modern Urban Rail Transit, 2013, (1): 73-76. DOI:10.3969/j.issn.1672-7533.2013.01.020.
[8] Liu Xiaorong, Wang Xiaofei. Video-based population density classification algorithm [J].Journal of Chengdu Institute of Technology, 2017, (4): 11-14. DOI:10.13542/j.cnki.51-1747/tn.2017.04.003.