http://dx.doi.org/10.4236/wjnse.2014.41004
How to cite this paper: Prabhu, Y.T., Rao, K.V., Kumar, V.S.S. and Kumari, B.S. (2014) X-Ray Analysis by Williamson-Hall and Size-Strain Plot Methods of ZnO Nanoparticles with Fuel Variation. World Journal of Nano Science and Engineering, 4, 21-28. http://dx.doi.org/10.4236/wjnse.2014.41004
X-Ray Analysis by Williamson-Hall and
Size-Strain Plot Methods of ZnO
Nanoparticles with Fuel Variation
Yendrapati Taraka Prabhu1*, Kalagadda Venkateswara Rao1,Vemula Sesha Sai Kumar1, Bandla Siva Kumari2
1Centre for Nano Science and Technology, IST, Jawaharlal Nehru Technological University, Hyderabad, India 2Botany Department, Andhra Loyola College, Vijayawada, India
Email: *[email protected]
Received 6 November 2013; revised 9 December 2013; accepted 16 December 2013
Copyright © 2014 by authors and Scientific Research Publishing Inc.
This work is licensed under the Creative Commons Attribution International License (CC BY).
http://creativecommons.org/licenses/by/4.0/
Abstract
In this paper, a simple and facile surfactant assisted combustion synthesis is reported for the ZnO nanoparticles. The synthesis of ZnO-NPs has been done with the assistance of non-ionic surfactant TWEEN 80. The effect of fuel variations and comparative study of fuel urea and glycine have been studied by using characterization techniques like X-ray diffraction (XRD), transmission electron microscope (TEM) and particle size analyzer. From XRD, it indicates the presence of hexagonal wurtzite structure for ZnO-NPs. Using X-ray broadening, crystallite sizes and lattice strain on the peak broadening of ZnO-NPs were studied by using Williamson-Hall (W-H) analysis and size-strain plot. Strain, stress and energy density parameters were calculated for the XRD peaks of all the samples using (UDM), uniform stress deformation model (USDM), uniform deformation energy density model (UDEDM) and by the size-strain plot method (SSP). The results of mean particle size showed an inter correlation with W-H analysis, SSP, particle analyzer and TEM results.
Keywords
Surfactant Assisted Combustion; X-Ray Diffraction (XRD); Transmission Electron Microscope (TEM); Particle Analyzer
1. Introduction
In many areas of chemistry, physics and material science transition metal oxides with nano structure have
constants. The basis of strain also includes contact or sinter stress, grain boundary, triple junction, stacking faults and coherency stress [11]. In different ways, Bragg peak is affected by crystallite size and lattice strain which increase the peak width and intensity shifting the 2θ peak position accordingly. The crystallite size varies as 1/cosθ and stain varies as tanθ from the peak width. The size and strain effects on peak broadening are known from the above difference of 2θ. W-H analysis is an integral breadth method. Size-induced and strain-induced broadenings are known by considering the peak width as a function of 2θ [12].
In this paper firstly, a simple method for the synthesis of ZnO-NPs by surfactant assisted combustion synthe-sis is disused. It was found that this method is a quick, mild, energy-efficient and eco-friendly route to producing ZnO nanoparticles. Secondly, comparative studies of the mean particle size of ZnO-NPs from TEM measure-ments and from the powdered XRD are dealt with. Using William Hall modified form strain, uniform deforma-tion model (UDM), uniform stress deformadeforma-tion model (USDM), uniform deformadeforma-tion energy-density model (UDEDM) and the size-strain plot method (SSP) provided information on the stress-strain relation, and the strain ε as a function of energy density (u) was estimated.
2. Experimental Details
2.1. Instrumentation
The crystal phases of the synthesized powders were determined by X-ray diffraction (XRD, Bruker D & Ad-vance, Germany) using CuKα as radiation source (40 kV, step size 0.02, scan rate 0.5 min−1, 20˚ ≤ 2θ ≤ 80˚). The particle size is measured by Nano Particle Size Analyzer (SZ-100 Nanoparticle, Horiba, Germany). The surface morphology of ZnO nanoparticles were studied with transmission electron microscope (Tecnai 20 T G2 (FEI)).
2.2. Preparation of ZnO Nanoparticles
The starting materials such as zinc nitrate and non-ionic surfactant are taken in same amounts for both the sam-ples and thus changing the fuels glycine and urea. Freshly prepared aqueous solutions of the chemicals were used for the synthesis of nanoparticles. At room temperature the chemicals are added one by one with the 0.1 M solution of zinc nitrate, 0.15 M solution of glycine for first sample and urea for the second sample with 0.025 M solution of non-ionic surfactant. The mixture of chemicals was then heated on a hot plate in separate beakers which led the chemical mixture to self-combustion. After combustion the final precipitate is subjected to calci-nations for 1 hr at 400˚C. Thus we successfully obtained a pure ZnO nano powders for different fuels in this synthesis.
3. Results and Discussion
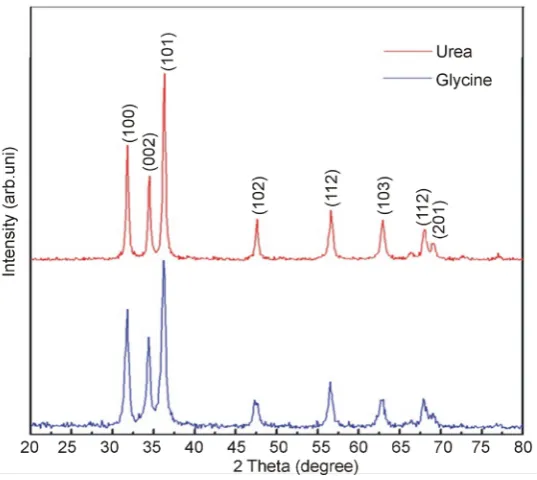
3.1. XRD
Figure 1.The XRD pattern for the nano ZnO with fuels Gylcine and urea.
dependent effects. To remove these aberrations, it is needed to assemble a diffraction pattern from the line broadening of a standard material such as silicon to determine the instrumental broadening. The instrument- corrected broadening [13]βD corresponding to the diffraction peak of ZnO was estimated using the relation. The
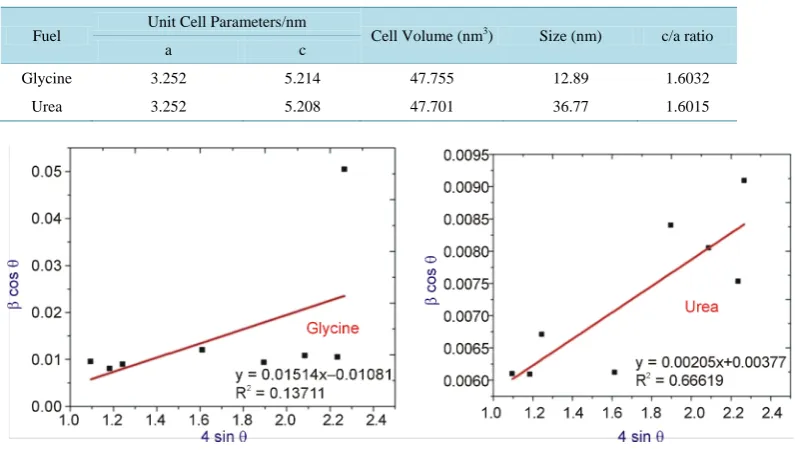
lattice constants of ZnO with varied fuels are given in the Table 1.
2 2 2
measures nstrumental
D i
β =β −β (1)
1 cos cos D D k k D D
λ θ λ
β θ β
= ⇒
(2) 3.2. Williamson-Hall Methods
Crystal imperfections and distortion of strain-induced peak broadening are related by ε ≈ βs/tanθ. There is an
ex-traordinary property of Equation (2) which has the dependency on the diffraction angle θ. Scherrer-equation follows a 1/cosθ dependency but not tanθ as W-H method. This basic difference was that both microstructural causes small crystallite size and microstrain occur together from the reflection broadening. Depending on dif-ferent θ positions the separation of size and strain broadening analysis is done using Williamson and Hall. The following results are the addition of the Scherrer equation and ε ≈ βs/tanθ.
hkl S D
β =β +β (3) 4 tan cos hkl k D λ
β ε θ
θ
= +
(4)
Rearranging Equation (4) gives:
4 sin
hkl k
D
λ
β = + ε θ
(5)
Here Equation (5) stands for UDM where it is assumed that stain is uniform in all crystallographic directions.
Figure 2.The W-H analysis of ZnO nanoparticles with fuels glycine and urea assuming UDM. Fit to the da-ta, the strain is extracted from the slope and the crystalline size is extracted from the y-intercept of the fit.
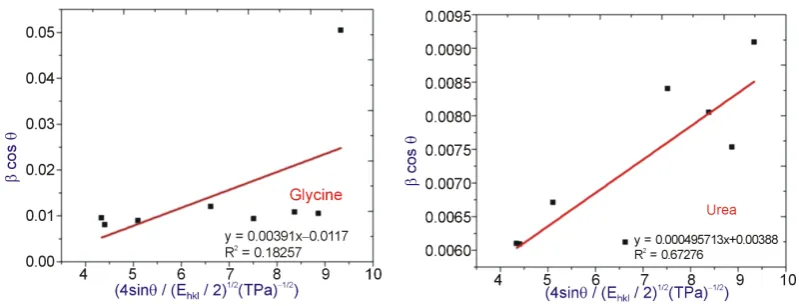
From Uniform Stress Deformation Model (USDM) strain is calculated from the Hook’s Law maintaining li-nea proportionality between stress and strain by σ = Yε, where σ is the stress and Y is the Young’s modulus. This Hook’s law is valid for a significantly small strain. Supposing a small strain to be present in the ZnO with varied fuels, Hooke’s law can be used here. Applying the Hooke’s law approximation to Equation (5) yields:
4 sin cos hkl hkl k D Y
λ σ θ
β θ= +
(6)
For a hexagonal crystal, Young’s modulus is given by the following relation [11] (Equation (7)). where S11, S13, S33, S44 are the elastic compliances of ZnO with values of 7.858 × 10⁻¹², −2.206 × 10⁻¹², 6.940 × 10⁻¹², 23.57
× 10−12 m2·N−1, respectively [11]. Young’s modulus, Y, for hexagonal ZnO was calculated as ≈130 GPa.
4 sinθ Yhkl and βcosθ were taken on x-axis and y-axis respectively. The USDM plots for ZnO with varied fuels
are shown in the Figure 3. The stress is calculated from the slope.
(
) ( )
(
)
(
)
(
)
2 2 2 2 22 4 2 2
2 2
11 33 13 44
2 3 2 2 2 3 3 hkl
h k al
h
c Y
h k al h k al
S h S S S h
c c + + + = + + + + + + + (7)
The energy density of a crystal was calculated from a model called Uniform Deformation Energy Density Model (UDEDM). From Equation (8) we need to implicit that crystals are to be homogeneous and isotropic na-ture. The energy density u can be calculated from u=
(
ε2Yhkl)
2 using Hooke’s law. The Equation (8) can be modified according the energy and strain relation.1/ 2 2 4 sin hkl hkl k u D Y λ
β = + θ
(8)
(
)
1 2 [image:4.595.150.470.512.583.2]Figure 3.The modified form of W-H analysis assuming USDM for ZnO with fuels glycine and urea. Fit to the data, the stress is extracted from the slope and the crystalline size is extracted from the y-intercept of the fit.
Figure 4.The modified form of W-H analysis assuming UDEDM for ZnO with fuels glycine and urea. Fit to the data, the density of energy is extracted from the slope and the crystalline size is extracted from the y-intercept of the fit.
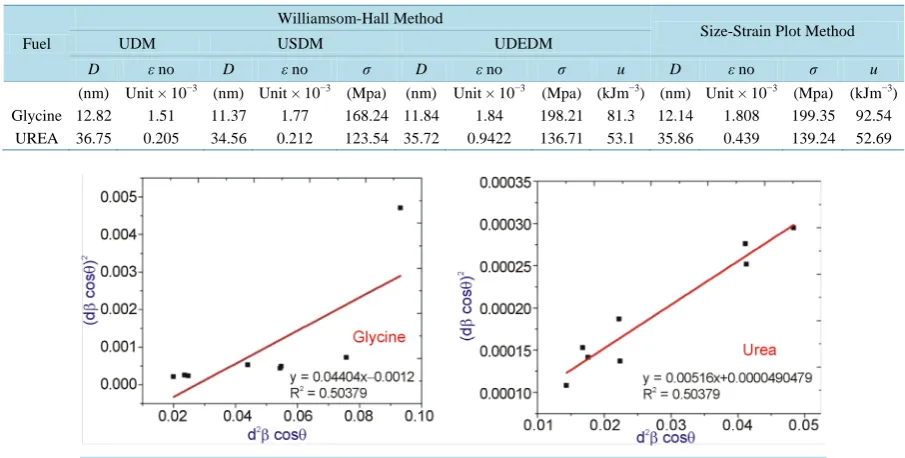
3.3. Size-Strain Plot Method
Williamson-Hall plot has illustrated that line broadening was basically isotropic. Due to microstrain contribution the diffracting domains were isotropic. Size-strain parameters can be obtained from the “size-strain plot” (SSP). This has a benefit that less importance is given to data from reflections at high angles. In this estimation, it is assumed that profile is illustrated by “strain profile” by a Gaussian function and the “crystallite size” by Lor- entzian function [14]. Hence we have
(
)
2(
2)
2cos cos 2
hkl hkl hkl hkl
k
d d
D
ε
β θ = β θ +
(9)
where k is a constant, shape of the particles for spherical particles it is given as 3/4. In Figure 5, 2
cos
hkl hkl
d β θ
and
(
dhklβhklcosθ)
2 were taken on x-axis and y-axis respectively for all peaks of ZnO-NPs with the wurtzite hexagonal phase from 2θ= 20˚ to 2θ= 80˚. The particle size is calculated from the slope linearly fitted data and the root of the y-intercept gives the strain.3.4. TEM Method
[image:5.595.113.513.280.433.2]Figure 5.The SSP plot of ZnO with fuels glycine and urea. The particle size is achieved from the slop of the liner fitted data and the root of y-intercept gives the strain.
Figure 6. TEM micrographs of ZnO na-noparticles with fuel glycine.
[image:6.595.236.388.367.703.2]3.5. Particle Analyzer
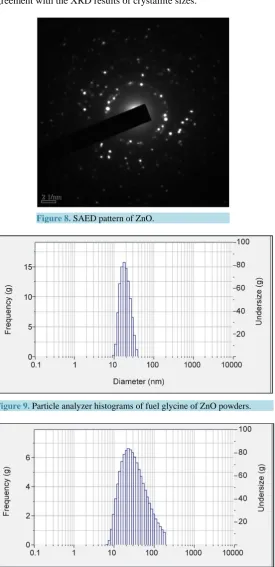
[image:7.595.179.455.133.702.2]Using Nano Particle Analyzer (SZ100) the size of the nanopowders is measured. The average particle sizes for samples with fuels glycine and urea are shown with histogram in Figures 9 and 10. All the results from particle analyzer are in good agreement with the XRD results of crystallite sizes.
Figure 8.SAED pattern of ZnO.
[image:7.595.216.413.150.342.2]Figure 9. Particle analyzer histograms of fuel glycine of ZnO powders.
References
[1] Hu, J.T., Odom, T.W. and Liebe, C.M. (1999) Chemistry and Physics in One Dimension: Synthesis and Properties of Nanowires and Nanotubes. Accounts of Chemical Research, 32, 435-445. http://dx.doi.org/10.1021/ar9700365
[2] Annapoorani, R., Dhananjeyan, M.R. and Renganathan, R. (1997) An Investigation on ZnO Photocatalysed Oxidation of Uracil. Journal of Photochemistry and Photobiology A: Chemistry, 111, 215-221.
http://dx.doi.org/10.1016/S1010-6030(97)00170-6
[3] Huang, W.-J., Fang, G.-C. and Wang, C.-C. (2005) A Nanometer-ZnO Catalyst to Enhance the Ozonation of 2,4,6-Tri- chlorophenol in Water. Colloids and Surfaces A: Physicochemical and Engineering Aspects, 260, 45-51.
http://dx.doi.org/10.1016/j.colsurfa.2005.01.031
[4] Sánchez, L., Peral, J. and Domènech, X. (1996) Degradation of 2,4-Dichlorophenoxyacetic Acid by in Situ Photogene-rated Fenton Reagent. Electrochimica Acta, 41, 1981-1985. http://dx.doi.org/10.1016/0013-4686(95)00486-6
[5] Chen, B.J., Sun, X.W., Xu, C.X. and Tay, B.K. (2004) Growth and Characterization of Zinc Oxide Nano/Micro-Fibers by Thermal Chemical Reactions and Vapor Transport Deposition in Air. Physica E, 21, 103-107.
http://dx.doi.org/10.1016/j.physe.2003.08.077
[6] Nakata, Y., Okada, T.and Maeda, M. (2002) Deposition of ZnO Film by Pulsed Laser Deposition at Room Tempera-ture. Applied Surface Science, 197, 368-370. http://dx.doi.org/10.1016/S0169-4332(02)00426-9
[7] Yoo, Y.-Z., Jin, Z.-W., Chikyow, T., Fukumura, T., Kawasaki, M. and Koinuma, H. (2012) S Doping in ZnO Film by Supplying ZnS Species with Pulsed-Laser-Deposition Method. Applied Physics Letters, 81, 3798.
http://dx.doi.org/10.1063/1.1521577
[8] Li, Y.J., Duan, R., Shi, P.B. and Qin, G.G. (2004) Synthesis of ZnO Nanoparticles on Si Substrates Using a ZnS Source. Journal of Crystal Growth, 260, 309-315. http://dx.doi.org/10.1016/j.jcrysgro.2003.08.041
[9] Yang, X.-L., Dai, W.-L., Chen, H., Cao, Y., Li, H.X., He, H.Y. and Fan, K.N. (2004) Novel Efficient and Green Ap-proach to the Synthesis of Glutaraldehyde over Highly Active W-Doped SBA-15 Catalyst. Journal of Catalysis, 229, 259-263.http://dx.doi.org/10.1016/j.jcat.2004.10.009
[10] Ramakanth, K. (2007) Basic of Diffraction and Its Application. I.K. International Publishing House Pvt. Ltd., New Dehli.
[11] Zhang, J.-M., Zhang, Y., Xu, K.-W. and Ji, V. (2006) General Compliance Transformation Relation and Applications for Anisotropic Hexagonal Metals. Solid State Communications, 139, 87-91.
http://dx.doi.org/10.1016/j.ssc.2006.05.026
[12] Suranarayana, C. and Norton, M.G. (1998) X-Ray Diffraction: A Practical Approach. Springer, New York.
http://dx.doi.org/10.1007/978-1-4899-0148-4
[13] Rogers, K.D. and Daniels, P. (2002) An X-Ray Diffraction Study of the Effects of Heat Treatment on Bone Mineral Microstructure. Biomaterials, 23, 2577-2585. http://dx.doi.org/10.1016/S0142-9612(01)00395-7