Effect of wind flow direction on the loads at wind farm
Romans Kazacoks, Lindsey Amos, Prof William Leithead
[email protected] [email protected]
Wind and Marine DTC Strathclyde University, Glasgow
G1 1XW, United Kingdom
Abstract. This paper investigates the effect of wind flow direction on the fatigue loads on wind turbine within a wind farm, to determine the most critically loaded machines within the wind farm. The fatigue loads are calculated according IEC standards. In this study, the two layouts are considered. Additionally, this paper includes the effect of wind flow direction on the power efficiency of the wind farm for the two layouts. The simulations performed by StrathFarm, which is an in-house developed wind farm modeling tool, for the below and above rated wind speed flow with turbulence. In the regular and installed regular layouts at zeros degree of the prevailing wind flow direction, the spacing among turbines is eight diameters. At 90 degrees of wind flow direction the spacing between turbines is five diameters. The simulations demonstrate that the majority of the maximum fatigue loads occur at the range 40 and 70 degrees for the two layouts. However, there is small number of machines, which are experienced the highest fatigue loads at 90 degrees of wind flow direction. For the two layout the lowest power efficiency occurs at 10 degrees of wind flow direction. The regular layout is experienced same power efficiency at five and eight diameters spacing among turbine in the wind flow direction. The highest power efficiency occurs at wind flow angles, which produce the highest fatigue loads.
1
Introduction
The wind direction varies in time and space, which obviously has an effect on a wind turbine. There are many papers, which examine the effect of wind direction on efficiency or power production of a single wind turbine and wind turbines within a wind farm. However, there is little previous work, which examines the effect of variation of wind flow direction on the loads on wind turbines within a wind farm.
The purpose of this paper is to report an investigation of the effect of wind flow direction on the loads on wind turbines within a wind farm, to determine the most critically loaded wind turbines for different wind farm layouts and their dependence on the direction of wind flow; that is, the question being addressed is as follows:
“How does the wind direction affect wind turbine loads within a wind farm?”.
addition, the impact of curtailment on the wind turbine fatigue loads is investigated. The fatigue loads are calculated according to IEC 61400 standards [1].
StrathFarm, an in-house developed wind farm modelling tool, is applied to examine the fatigue loads and power efficiency of the wind turbines within the wind farm as result of the changes in wind flow direction. StrathFarm was specifically developed for fast simulation of wind farms to enable estimation of performance over different mean wind speed, turbulence intensity and wind speed direction. Here the wind turbines are chosen to be the 5MW SuperGen turbines, which are similar to 5MW NREL wind turbine model.
2
Strathfarm overview
StrathFarm is an analysis and design wind farm model and simulation tool that meets the following requirements:
Models wakes and wake interactions.
Models the turbines in sufficient detail that tower, blade and drive train loads are sufficiently accurate to estimate the impact of turbine and farm controllers on loads.
Includes commercial standard turbine controllers.
Includes a wind farm controller.
Provides very fast simulation of large wind farms; run in real time with 100 turbines.
Complete flexibility of choice of farm layout, choice of turbines & controllers and wind conditions, direction, mean wind speed and turbulence intensity.
The tool comprises a MATLAB based interface, with user specified parameterisation of the wind farm simulation, through which a model of the wind farm is constructed from library blocks and a wind field time series is created. Different pitch regulated variable speed wind turbines can be represented by providing an appropriate parameterisation of both the wind turbine model and its controller.
2.1
Structure and Principles of the tool
The wind farm model generated by the StrathFarm tool is a Simulink model consisting of appropriately connected C-code or Simulink library blocks. Each wind turbine is represented by an individual model library block, which feeds the thrust coefficient to the wind farm wake model. The wind field, which is represented by a pre-generated time series, is then adjusted for wake effects and local wind speed information input to each wind turbine model, thereby, providing the aerodynamic coupling of the turbines within the wind farm.
In the version of StrathFarm used to produce the results in this study, the wind turbine models are continuous Simulink block based models, with discrete controllers implemented as dlls. Each wind turbine controller includes a Power Adjusting Controller (PAC) [2], which provides the connection to a central wind farm controller and enables dynamic adjustment of power output. Each PAC communicates with the wind farm controller, a function-code dll library block, using a set of input and output flags.
2.2
Wind Turbine Model
blades and tower influence the transient loads on the structure of the wind turbine, and hence its fatigue life. The dynamics of the drivetrain influence the transient loads on the drivetrain components, such as the gearbox and they also influence the control system for a pitch regulated machine. The requirements for StrathFarm include a wind turbine model, which captures the key dynamics of the wind turbine system, whilst being computationally inexpensive. Lumped parameter models are used for the rotor, drivetrain and for representing a single blade. Reformulated BEM based aerodynamic coefficient models are used to determine the thrust and torque at the rotor, including dynamic induction lag.
2.2.1
Wind Turbine Model Components
Aerodynamics: The rotor/wind field interaction employs an effective wind field model whose resolution is sufficient detailed to represent the interaction reasonable accurate up to 6P. Modified BEM based aerodynamic coefficient models are used to determine the thrust and torque at the rotor, whereby standard BEM is reformulated [2] to allow dynamic inflow effects to be modelled. The aerodynamic thrust and torques (in-plane and out-of-plane) are calculated using look up tables for aerodynamic coefficients of thrust, power and out-of-plane rotor torque, taking as inputs the pitch angle and tip-speed ratio calculated from wind turbine rotor speed and a combination of the correctly adjusted components of the wind field input.
Rotor and Tower Dynamics: The structural model of each turbine includes two blade modes and 2 tower modes [3]. Individual blade models use a lumped mass blade/hub model, which takes into consideration the distributed elastic properties of the blade with part of the mass and inertia of the blade incorporated into the hub. The fore-and-aft modes of the tower are incorporated into the rotor model and the fore-and-aft modes are incorporated into the drive-train model.
Drivetrain: the lumped parameter drivetrain model represents the rotor, hub, low-speed shaft, gearbox with damped compliant suspension, high speed shaft and generator rotor. The model is based on [3] and is represented by a linear, state-space system with two dynamic modes. The resulting dynamics are stiff.
2.2.2
Wind Turbine Model Validation
The wind turbine used is the SuperGen 5MW exemplar turbine, which is similar to the 5MW NREL turbine [4]. It has a rotor diameter of 126m, a hub height of 90m, a maximum power coefficient of 0.4878 (at a tip-speed ratio of 7.5 and pitch angle of -0.011rad), rated speeds of 1.23 rad/s (rotor) and 120 rad/s (generator).
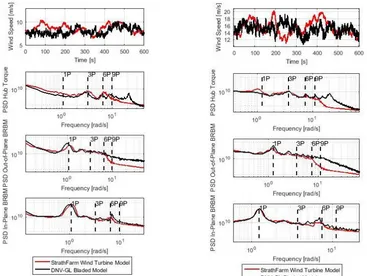
Figure 1: Comparison of the wind field time series, power density spectra of output hub torque, out-of-plane and in-plane blade root bending moments between 5MW Supergen model in StrathFarm and 5MW Supergen model in DNV-GL Bladed. Figure 1.a corresponds to a mean wind speed of 8 m/s and Figure 1.b to a mean wind speed of 15 m/s. All simulations use 10 % turbulence intensity.
2.3
Wind Field and Wake Modelling
For each wind farm simulation in StrathFarm, the wind field is defined by inputs of mean wind speed, wind direction, turbulence intensity and surface roughness. The layout and dimensions of the wind farm are also inputs to the wind field and wake models. The wind field time series are pre-generated, stored in a file from which they are read during simulation. The wake model estimates the interaction of the turbines within the farm; to determine the wind speeds for each turbine at each time step.
2.3.1
Time-Series Input Wind Field Components
Two components of the wind field are calculated and input as time series to the StrathFarm simulation model. The first corresponds to the longitudinal and lateral turbulence time series with the required characteristics. The turbulent wind field model is based on the algorithm of Veers [5]. The second corresponds to an effective wind field model, local to the rotor for each turbine [6], representing the higher frequency components of the wind. In addition, deterministic components such as wind shear and tower shadow are also modelled components.
2.3.2
Wind Field Simulation
no wakes. A value of one for the deficit represents no wake effects. As well as a drop in effective wind speed seen by a downwind turbine, wake effects also produce an increase in relative turbulence. The time series representing the low frequency correlated turbulence wind field component is then combined with the higher frequency uncorrelated turbulence component local to each wind turbine to be used in the appropriate aerodynamic calculations.
2.3.3
Wake Model Description
The wake deficits are calculated using the thrust coefficients of each wind turbine as inputs to a kinematic wake model. The kinematic wake model, based on the well-known model of Frandsen [9], uses a pre-generated lateral turbulence field to determine wake meandering, and analytically determined equations to calculate the wake diameters (wake expansion) and the effective reduction in available power experienced by downwind turbines (wake strength).
At each time step, the model iterates the wake effects downwind through the wind farm, combining the wakes of upwind wind turbines. The centre and diameter of each wind turbine wake determines which upwind turbines should be included in the deficit calculation for the downwind turbine. Partial wake cover and wake overlap is treated using a proportion based on the area of overlap between the rotor and a circle representing a wake.
3
Methodology
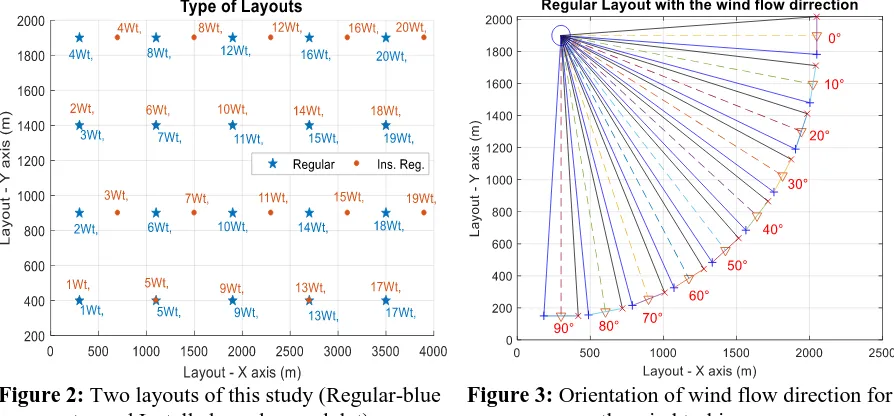
[image:5.595.79.526.540.748.2]The effect of wind flow direction on the fatigue load distribution within the wind farm and power efficiency of the wind farm is investigated for two wind farm layouts (regular and installed regular), which are depicted in Figure 2. Each of these two layouts is examined for different angles of wind flow direction, from zero to 90 degrees in 10 degrees steps (wind direction angle ∈ [0 : 10 : 90]). Figure 3 shows the direction of the wind flow from zero to 90 degrees. At zeros degree, the wind flow goes from the west to the east. At 90 degrees, the wind flow goes from the north to the south. The wind flow direction rotates clockwise. Note the rotor of wind turbines are oriented towards the wind. Therefore, there is no yaw error for the wind turbines in the StrathFarm simulation wind farm modelling tool.
Figure 2: Two layouts of this study (Regular-blue star and Installed regular - red dot).
Additionally, the effect of power curtailment on loads is examined in this study. The power curtailment is applied at the wind farm level through wind farm controller. This study assumes a 20% power curtailment. Therefore, each turbine within the layout has 20 % cut of power production. The effect of power curtailment on the loads is examined for each layout and wind flow direction.
3.1
Initial conditions
The analysis was performed using two mean wind speed (8 and 15m/s) during normal power production conditions or design load case (DLC) 1.2 with normal turbulence model (NTM) set according to the IEC standards [1], i.e. turbulence intensity 0.12. The below rated region is represented by the 8 m/s wind speed and above rated region represented by 15 m/s. In-line with IEC standards, 6 different ‘seeds’ (i.e. random initiating points of the simulation) are employed per mean wind speed to reduce the uncertainty arising from the stochastic nature of the wind field.
3.2
Damage equivalent loads
Damage equivalent loads (DELs) estimates are based on Palmgren-Miner linear cumulative damage theory [7], which assumes that fatigue damage increases linearly as a function of number of cycles, until it reaches the prescribed life exhausted of material [8]. Additionally, it assumes that only cycle load range contributes to fatigue damage, i.e. there is no contribution to fatigue damage from the mean value of cycles. Equation 1 shows the formula for the calculating DELs.
𝐿𝐷𝐸𝐿 = (
∑ (∑ 𝑛𝑖𝑝 𝑘𝑖 𝑖 𝐿𝑚𝑖 )
𝑡𝑠𝑖𝑚 𝑓 ) 1
𝑚 (1)
Where, 𝑛𝑖 is number of cycles, 𝐿𝑖is load range at bin, 𝑚 is Wöhler coefficient, 𝑡sim is simulation time
and 𝑓 is the reference frequency. The Rain flow counting (RFC) [9]–[11] is applied to count load range, mean and amount of cycles in a time series. According to the default calculation of DELs, the load range (maximum and minimum) contributes to fatigue.
3.3
Materials
DELs are used to presents the fatigue loads in this study. For the calculations of the DELs, Wöhler coefficients of 4 and 10 are used. These coefficients characterise the gradient of a material’s Wöhler SN curves. Wöhler coefficients of 4 and 10 are used for steel and composite materials, respectively. As the hub and bolts are made from steel, but the blades are from composites.
4
Results
4.1
Effect of wind direction on fatigue loads
The two layouts in Figure 2 are considered here, with and without curtailment. The wind turbine with the maximum DELs is found within each layout for each direction of wind flow in Figure 3. For each layout, the out-of-plane blade root DELs for Wohler coefficients 4 and 10 are estimated but not the in-plane blade roots DELs the latter are more dependent on gravity loads [12]–[15]. For each layout, the maximum DELs by wind direction are determined for four different conditions as shown below:
Below rated wind speed (8 m/s) with turbulence (0.12 Iref.) and no curtailment.
Below rated wind speed (8 m/s) with turbulence (0.12 Iref.) and 0.2 curtailment.
Above rated wind speed (15m/s) with turbulence (0.12 Iref.) and no curtailment.
Above rated wind speed (15m/s) with turbulence (0.12 Iref.) and 0.2 curtailment.
4.1.1
Regular layout
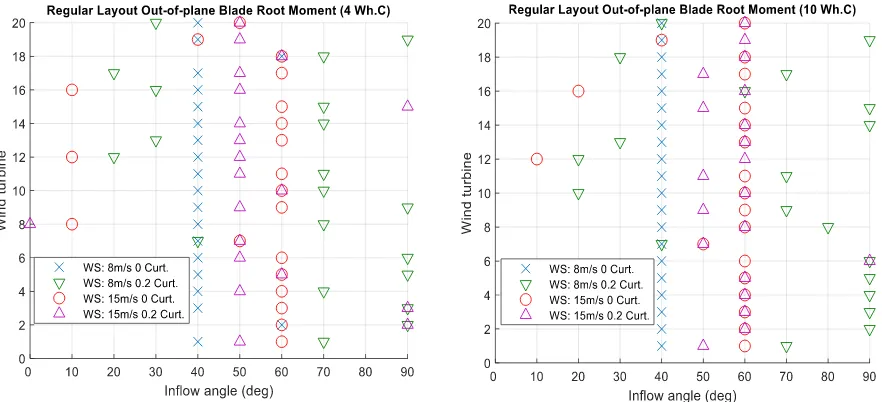
[image:7.595.82.523.466.667.2]For the regular layout, the results with Wöhler coefficients 4 and 10 are shown in Figures 4. Each figure depicts the wind turbines, which experienced the highest DELs at the specific wind flow direction. The horizontal axis is the direction of flow angle. The vertical axis is the number of the wind turbine in the layout. Figure 2 shows two layouts and how wind turbines are numbered within these two layouts. In below rated wind speed, the maximum DELs mainly occur at 40, 70 and 90 degrees of the wind flow direction, see Figures 4. For the above rated wind speed without curtailment, the highest DELs occur mainly at 60 degrees. For the above rated wind speed with curtailment, the maximum DELs occur mainly at 50 and 60. Thus with the regular layout, the maximum DELs occurred in range from 40 to 70 and 90 degrees wind flow direction.
Figure 4: The highlighted wind turbines, which are experienced the maximum DELs of out of plane blade root moment within the regular layout, at different wind flow direction angle (0:10:90°). Graph A represents Wohler coefficient 4, graph B is for Wohler coefficient 10.
in the wind flow direction affects the downwind turbines, reducing the wind speed and increasing turbulence for the downwind wind turbines. As a result, the fatigue loads increase for the downwind machines when they are located in the wake of an upwind machine [12], [13]. Therefore, smaller spacing among wind turbine in the direction of wind flow produces higher fatigue loads for the downwind machines. There are a few machines, which are experienced higher DELs at 90 degrees of wind flow direction as shown in Figure 4. However, the majority of higher DELs are spread in range 40 and 70 degrees of wind flow direction. Possibly, that is the consequences of the wake meandering through the propagation of wake downwind and other influences such the extent of below and above rated operation.
4.1.2
Installed regular layout
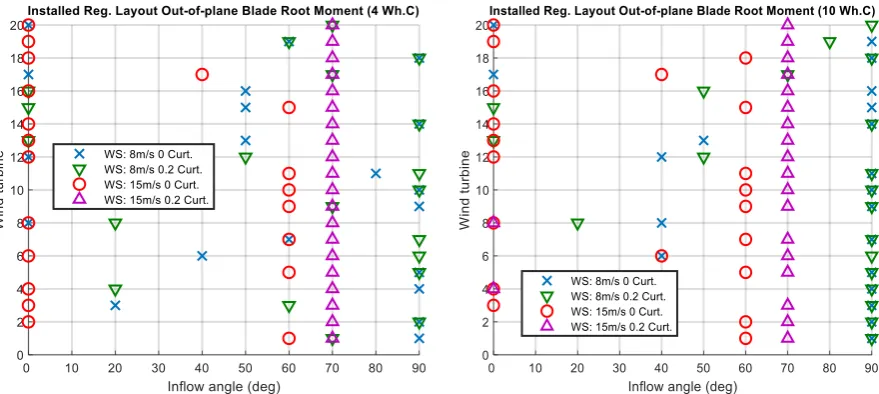
For the installed regular layout, the results with Wöhler coefficients 4 and 10 are shown in Figure 5. For Wöhler coefficient 4, the maximum DELs in below rated speed are more widely scattered throughout the layout than the maximum DELs in above rated wind speed, see Figure 5A. For Wöhler coefficient 10, the maximum DELs in below rated speed mainly occur at 90 degrees wind flow direction, see Figure 5B. The maximum DELs in the above rated speed mainly occur at 0, 60 and 70 degrees. The distribution of the maximum DELs with Wöhler coefficient 10 in above rated speed is the same as the maximum DELs for Wöhler coefficient 4.
[image:8.595.83.523.356.553.2]
Figure 5: The highlighted wind turbines, which are experienced the maximum DELs of out of plane blade root moment within the installed regular layout, at different wind flow direction angle (0:10:90°).
Graph A represents Wohler coefficient 4, graph B is for Wohler coefficient 10.
4.2
Effect of wind direction on power production
In this section, the effect of wind flow direction on the power efficiency of a wind farm is investigated. The two layouts in Figure 2 are again considered. The angle of wind flow direction varies from zero to 90 degrees in 10 degree increments. The power efficiency [12] of wind farm is calculated as in equation 2.
𝐸𝑓𝑓𝑝𝑜𝑤𝑒𝑟 =
𝑒𝑛𝑒𝑟𝑔𝑦 𝑜𝑓 𝑤ℎ𝑜𝑙𝑒 𝑤𝑖𝑛𝑑 𝑓𝑎𝑟𝑚
(𝑒𝑛𝑒𝑟𝑔𝑦 𝑜𝑓 𝑜𝑛𝑒 𝑖𝑠𝑜𝑙𝑎𝑡𝑒𝑑 𝑡𝑢𝑟𝑏𝑖𝑛𝑒) ∗ (𝑛𝑢𝑚𝑏𝑒𝑟 𝑜𝑓 𝑊𝑡𝑠 𝑖𝑛 𝑓𝑎𝑟𝑚)
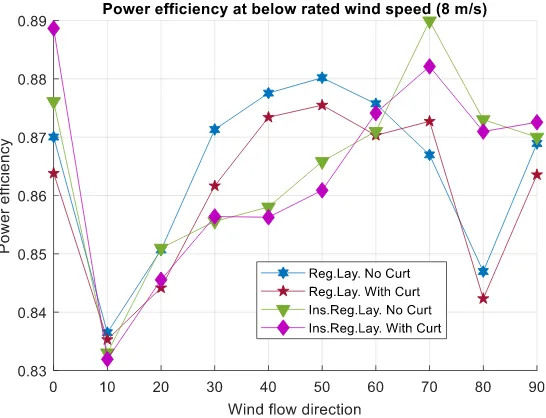
The power efficiency is calculated in below rated wind speed only as the wind speed deficit is not so significant in above rated region operation. For the above rated mean wind speed of 15 m/s chosen here, the measured minimum power efficiency is around 97.5%. Thus, only below rated wind speed is considered here. Figure 6 depicts the dependency of power efficiency on the wind flow direction for the two layouts (regular are installed regular). Figure 6 shows that the lowest power efficiency occurs at 10 degrees flow direction for the two layouts. The curtailment does not have significant effect on the power efficiency as the trends of power efficiency with curtailment are similar, slightly shifted, to the trends without curtailment for both layouts. For the regular layout, the graph of power efficiency is nearly symmetric about 45degrees, reflecting the symmetry of the layout, see Figure 2.
Figure 6: Changes power efficiency as a function different wind flow angle (0:10:90°) for the two layouts at below rated wind speed with/without curtailment.
In Lissaman et al. [16], It was shown that the geometry of turbine location and ambient turbulence intensity have high influence on power losses for a layout. Additionally, it was shown that, if the spacing among the turbines in the prevailing downwind direction is 10 diameters, then the power losses are below 10 %. In the regular layout in Figure 2 at zeros degree of prevailing wind direction, the spacing among turbines is eight diameters. In the perpendicular direction of wind flow direction, the spacing is five diameters between turbines. Figure 6 demonstrates that, with five and eight diameters spacing between turbines and a wind flow direction around 0 and 90 degrees, power efficiency is about 87%. That happens because wakes meander relative to the nominal direction of the wind, the extent, to which wakes from upstream turbines interact with a downstream turbine, varies randomly with time and the separation of the turbines, i. e. direction of wind speed. In addition, the turbulent wind speeds seen by each turbine varies randomly so that the mean wind speed seen be each turbine, also, varies randomly with its position in the array and direction of the wind speed. Consequently, due to the small number (6 seeds) and short duration of simulation runs, statistical uncertainty for each value plotted on Figure 6 remains substantial, implying that any estimation of direction of minimum power efficiency, with the same number and duration of runs as used here, would vary greatly. The shift of this estimate from the expected value of 0 degrees is thus not unexpected but gives some indication in the uncertainty in these results.
The highest power efficiency of the installed regular layout appears at 70 degrees. It again coincides with the maximum DELs in above rated wind speeds as shown in Figure 5. Therefore, there is correlation between the high power efficiency and the high DELs for the wind turbines within a layout.
5
Conclusion
This paper investigates the effect of wind flow direction on the fatigue loads on wind turbines within a wind farm, to determine the most critically loaded wind turbines for different wind farm layouts and their dependency on the direction of wind flow. Additionally, this paper focusses on power efficiency in order to explore any correlation between the wind flow direction and the power efficiency of different layout. In this study, there are two layouts of the wind farm: regular and installed regular.
Each layout is examined for four conditions: below and above rated wind flow with turbulence, 12% turbulence reference intensity, with and without curtailment (20% power curtailment in this study). The damage equivalent loads are used to calculate fatigue loads according to the IEC standards. The calculations performed by StrathFarm, which is the in-house wind farm-modelling tool.
The two layouts demonstrate that the majority of the maximum fatigue loads occur at the range 40 and 70 degrees. In the regular layout at zeros degree the spacing among turbines is eight diameters. The spacing, at 90 degrees is five diameters among turbines. In Manwell et al [8] and Burton et al [9], it is observed that the spacing in the prevailing direction affects the loads on the downwind turbines. The upwind turbines reduce the wind flow speed and increase turbulence for the downwind wind turbines. As result of increased turbulence, the fatigue loads increase for the downwind machines. Therefore, the highest fatigues loads should for a prevailing wind direction of 90 degrees. There are a few machines, which experience the highest fatigue loads at 90 degrees, but the majority with highest fatigue loads occur at 40, 50, 60. Possibly, that is the consequences of the wake meandering through the propagation downwind within the layout and other influences such the extent of below and above rated operation. To clarify this and reduce statistical uncertainty concerning all estimated values, it is clear that a greater number of simulation runs at each mean wind speed and for a larger set of mean wind speeds is required. The lowest power efficiency occurs at 10 degrees flow direction angle for the two layouts. The regular layout is experienced same power efficiency (87%) at five and eight diameters spacing among turbine in the wind flow direction. The highest power efficiency occurs at wind flow angles, which corresponds to the angles, which produce the highest fatigue loads.
Additional work is required to validate some of these results, particularly by direct comparison to the actual performance of a real wind farm with the same layout experiencing the same wind speed conditions.
Acknowledgements:
With thanks to the contributions of Adam Stock, Victoria Neilson, Lourdes Gala Santos, Saman Poushpas, Sung-Ho Hur, Giorgio Zorzi and Velissarios Kourkoulis from the University of Strathclyde.
References
[1] I. E. Commission, “Wind Turbine—Part 1: Design Requirements, IEC 61400-1,” Geneva, 2005.
[2] A. Stock, B. Leithead, and H. Yue, “Augmented control for flexible operation of wind turbines,” 2015.
[3] W. Leithead, M. R.-W. Engineering, and undefined 1996, “Drive-train characteristics of constant speed HAWT’s: Part I–Representation by simple dynamic models,” JSTOR. [4] J. Jonkman, S. Butterfield, W. Musial, and G. Scott, “Definition of a 5-MW reference wind
turbine for offshore system development,” 2009.
[5] P. S. Veers, “Three-Dimensional Wind Simulation,” J. Geophys. Res., vol. 92, no. A3, p. 2289, 1987.
[6] M. Santos, “Aerodynamic and wind field models for wind turbine control,” 2018.
[7] M. Miner, “Cumulative damage in fatigue,” Appl. Mech., vol. 12, no. 3, pp. 159–164, 1945. [8] P. Ragan and L. Manuel, “Estimation of Wind Turbine Fatigue Loads Using Time-Ragan, P.,
& Manuel, L. (2007). Estimation of Wind Turbine Fatigue Loads Using Time-Domain and Spectral Methods. 45th AIAA Aerospace Sciences Meeting and. Retrieved from
http://arc.aiaa.org/doi/pdf/10.25,” 45th AIAA Aerosp. Sci. Meet., 2007.
[9] S. Downing and D. Socie, “Simple rainflow counting algorithms,” Int. J. Fatigue, vol. 4, no. 1, pp. 31–40, 1982.
[10] G. Glinka and J. Kam, “Rainflow counting algorithm for very long stress histories,” Int. J. Fatigue, vol. 9, no. 4, pp. 223–228, 1987.
[11] ASTM E1049-85(2011)e1, “Standard Practices for Cycle Counting in Fatigue Analysis,” West Conshohocken, PA, 2011.
[12] J. F. Manwell, J. G. McGowan, and A. L. Rogers, Wind Energy Explained: Theory, Design and Application. 2002.
[13] T. Burton, N. Jenkins, D. Sharpe, B. Ervin, and D. Sharpe, Wind Energy Handbook. John Wiley & Sons, Inc., 2011.
[14] M. O. L. Hansen, Aerodynamics of wind turbines, 2nd ed. London: Earthscan, 2008. [15] R. Gasch and T. Jochen, Wind Power Plants: Fundamentals, Design, Construction and
Operation, Second. Springer, 2012.