http://dx.doi.org/10.4236/aim.2016.63017
How to cite this paper: Sukhumvittaya, S., Ampol, S., Pattanapanyasat, K. and Kantakamalakul, W. (2016) Polyfunctional T Cell and Neutralizing Antibody Responses to ACAM2000™ Smallpox Vaccine Immunization in Primary-Vaccinated Individu-als. Advances in Microbiology, 6, 169-177. http://dx.doi.org/10.4236/aim.2016.63017
Polyfunctional T Cell and Neutralizing
Antibody Responses to ACAM2000™
Smallpox Vaccine Immunization in
Primary-Vaccinated Individuals
Suchada Sukhumvittaya
1*, Silawun Ampol
1*, Kovit Pattanapanyasat
2,
Wannee Kantakamalakul
1#1Department of Microbiology, Faculty of Medicine Siriraj Hospital, Mahidol University, Bangkok, Thailand 2Center of Excellence for Flow Cytometry, Office for Research and Development, Faculty of Medicine Siriraj
Hospital, Mahidol University, Bangkok, Thailand
Received 4 February 2016; accepted 12 March 2016; published 15 March 2016
Copyright © 2016 by authors and Scientific Research Publishing Inc.
This work is licensed under the Creative Commons Attribution International License (CC BY).
http://creativecommons.org/licenses/by/4.0/
Abstract
Smallpox eradication was successful via prophylactic administration of live attenuated vaccinia virus. As a result of the discontinuation of the smallpox immunization program, many individuals are now susceptible to smallpox virus infection should it be used as a biological weapon. Presently, only individuals at high risk for exposure are required to receive smallpox vaccine, such as labor-atory personnel that handle variola/vaccinia virus. This study endeavored to investigate a one- year period of vaccinia virus-specific T cell responses using polychromatic flow cytometry and neutralizing (Nt) antibody responses using plaque reduction neutralization test (PRNT) in indi-viduals receiving primary immunization (n = 5) with ACAM2000™ smallpox vaccine. Functional and phenotypic profiles of vaccinia virus-specific T cell responses were characterized. Each single functional measurement {CD107a/b expression, production of interferon γ (IFN-γ), macrophage inflammatory protein 1β (MIP-1β), interleukin 2 (IL-2), and tumor necrosis factor α (TNF-α)} demonstrated that vaccinia virus-specific CD8+ T cells were functional at least one time point after vaccination (p ≤ 0.05). However, vaccinia virus-specific CD4+ T cells were functional only for MIP- 1β production (p ≤ 0.05). Vaccinia virus-specific CD8+ T cells induced in these individuals showed increased polyfunctionality in at least 2 phenotypes relative to pre-vaccination (p ≤ 0.05). Al-though only three of five individuals (60%) showed positive Nt antibody (titer ≥ 20) at first month after vaccination, all five individuals (100%) demonstrated Nt antibody at 2 months, post-immuni- zation. Interestingly, all vaccinees could retain the Nt antibody for 6 months after primary vacci-*S.S. and S.A. contributed equally to this article.
nation. In conclusion, ACAM2000™ smallpox vaccine induced both polyfunctional T cell-and Nt an-tibody-responses in primary immunized individuals.
Keywords
Smallpox Vaccine, Primary Immunization, T Cell, Neutralizing Antibody
1. Introduction
The smallpox vaccine is considered the gold standard of all vaccines, since its use led to the complete eradica-tion of the disease from the human populaeradica-tion. Although routine vaccinaeradica-tion against smallpox ended globally in around 1972, smallpox vaccine has recently been given to some scientists and medical professionals who work with variola and related viruses. Less virulent replication-competent vaccinia viruses and attenuated replication- defective vaccinia viruses, such as Dryvax, Modified Vaccinia Ankara (MVA), and NYVAC have been used for smallpox vaccination [1]. ACAM2000™ is a single plaque-purified vaccinia virus derivative of Dryvax, with similar induction of immunity [2]. Vaccinia virus-containing smallpox vaccines elicit strong humoral and cellu-lar immune responses that confer protective immunity against variola virus for decades after immunization [3] [4]. However, a detailed understanding of human immune responses to poxviruses is still incomplete. Smallpox vaccination provides a high level of T cell immune responses for up to 5 years [5] and neutralizing (Nt) antibo-dies at protective levels for up to 80 years [6]. The breadth of the vaccinia-specific effector T-cell repertoire at the single cell level has been demonstrated using polychromatic flow cytometry and intracellular cytokine stain-ing (ICS). Subjects who received MVA and Dryvax vaccines showed polyfunctionality of the “5+” CD8+ T cell population; specifically, CD107a/b, IFN-γ, MIP-1β, IL-2, and TNF-α [7]. In this study, we used this same ad-vanced technique to investigate virus-specific T cell response profiles and PRNT to examine Nt antibody in-duced by ACAM2000™ smallpox vaccine in primary-immunized Thai individuals.
2. Materials and Methods
2.1. Subjects
This study was conducted from May 2009 to December 2010 and received approval from the Siriraj Institutional Review Board (SIRB), Faculty of Medicine Siriraj Hospital, Mahidol University. Five healthy vaccinia-naïve adults aged 30 - 47 years provided written informed consent. Volunteer participants received ACAM2000™ smallpox vaccine as a primary immunization. Vaccines were administered percutaneously (15 punctures) using a bifurcated needle at a dose of 1 × 10⁸ PFU/ml. All participants had a primary skin reaction indicating a suc-cessful vaccination. Blood samples were collected in acid citrate dextrose (ACD) anticoagulant tubes for PBMCs preparation and as clotted blood for serum preparation at pre-vaccination, 0.5, 1, 3, 6, and 12 months, post-vaccination.
2.2. Peripheral Blood Mononuclear Cells (PBMCs) and in Vitro Stimulation (IVS)
PBMCs were prepared by standard Ficoll-Hypaque method and cryopreserved in liquid nitrogen. Cells were thawed, resuspended at 2 × 10⁶ cells/ml with RPMI growth medium (RPMI1640 supplemented with 10% heat- inactivated fetal calf serum, 100 U/ml penicillin G, and 100 µg/ml streptomycin sulfate), and left overnight at 37˚C. Unattached cells were washed and stimulated with vaccinia virus vP1170, strain WR (Virogenetics Corp., Troy, NY, USA) at 5 pfu/cell at infected:uninfected ratio of 1:5 and incubated for 1.5 hours at 37˚C/5% CO2. Recombinant human interleukin 7 (rhIL-7) (Roche Diagnostics, Indianapolis, IN, USA) was added to a final concentration of 300 U/ml. On day 7, interleukin-2 (IL-2) (Roche Diagnostics) was added to a final concentra-tion of 200 U/ml. Effector cells were then tested for vaccinia virus-specific responses on days 14 - 21, following culture initiation.
2.3. Transformed B Lymphocytes (TBLs)
described [8]. Sixteen hours prior to assay, TBLs were infected with vP1170 at 5 pfu/cell, then adjusted to 5 × 10⁴ cells/ml and used as target cells.
2.4. Antibody Panels for Polychromatic Flow Cytometry
The following antibody panel was used to independently quantify five individual T cell functions: CD3-Cy7 al-lophycocyanin (APC), CD8-Cy5.5PerCP, CD107a/b-FITC, IFN-γ-APC, MIP-1β-PE, IL-2-Cy7PE, TNF-α- Alexa700 (all from Becton Dickinson Biosciences (BDB), San Jose, CA, USA), and CD4-ECD (Beckman Coulter, Inc. Pasadena, CA, USA).
2.5. Intracellular Cytokine Staining (ICS)
Effector and target cells were resuspended in complete RPMI medium and adjusted to an effector:target (E:T) ratio of 50:1. Co-stimulatory antibodies (anti-CD28/CD49d, 1 μg/ml each; BDB), monensin (Golgistop, 0.7 μl/ml; BDB), brefeldin A (10 μg/ml; BDB), and anti-CD107a/b (BDB) were then added to all tubes. Cell sus-pensions were then incubated at 37˚C/5% CO2 for 5 hours. Following stimulation, cells were washed with PBS and then permeabilized according to manufacturer’s instructions (Cytofix/Cytoperm Kit; BDB). Cells were intracellularly stained with pretitered antibodies against CD3, CD4, CD8, cytokines, and chemokines. CD107a/b on cell surfaces was stained with specific antibody. Cells were subsequently washed in flow wash buffer (BDB) and fixed in PBS containing 1% paraformaldehyde. Cells were collected for 350,000 - 1,000,000 events per sample on an LSRII flow cytometer (BDB) configured to detect 8 fluorochromes. Analysis was performed using FlowJo software version 9.6.2 (TreeStar, Inc., Ashland, OR, USA).
2.6. Serum
All serum samples were heat-inactivated at 56˚C for 30 minutes, aliquoted, and stored at −20˚C until use. The negative-control serum sample was a non-vaccinated human pool serum. The positive-control serum sample was a post-vaccination serum sample.
2.7. Cell Line
Thymidine kinase (TK) cell line was used as susceptible cell to vaccinia virus. Cells were cultured at 37˚C/5% CO2 in Dulbecco’s modified Eagle’s medium (DMEM), supplemented with 10% fetal bovine serum, 100 U/ml penicillin G, and 100 µg/ml streptomycin sulfate.
2.8. Reference Virus
Vaccinia virus, vP1170 used in the assay was propagated in TK cells, frozen, and thawed for 3 freeze-thaw cycles. Vaccinia virus titer was then determined in term of plaque forming units (PFU)/ml. The virus was then stored at −80˚C until use.
2.9. Plaque Reduction Neutralization Test (PRNT)
2.10. Statistical Analysis
SPSS version 13.0 was used for statistical analysis (SPSS, Inc., Chicago, IL, USA). Comparison of pre-vacci- nation and post-vaccination T cell responses by different time points was performed using paired-samples t-test. Descriptive statistics were used to analyze and present results from PRNT. A p-value ≤ 0.05 was considered sta-tistically significant.
3. Results
3.1. ACAM2000™ Smallpox Vaccine Induces T Cell Functions Independently and
Simultaneously in Primary-Vaccinated Individuals
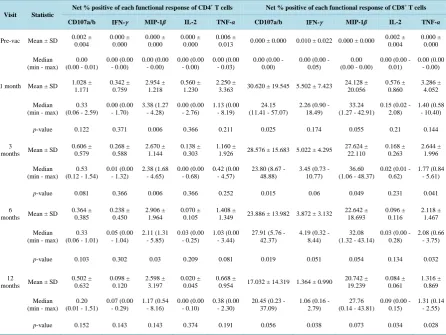
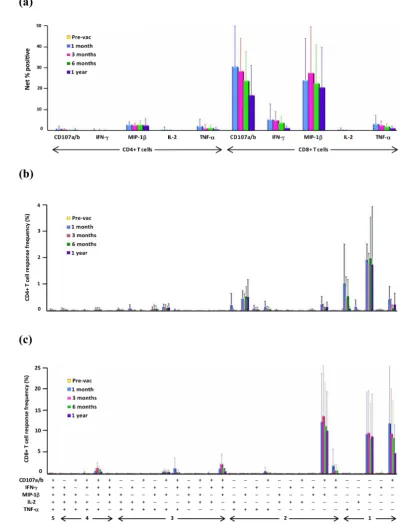
Settings for polychromatic flow cytometry to measure five T cell functions (expression of surface CD107a/b and production of IFN-γ, MIP-1β, IL-2, and TNF-α) independently and simultaneously were performed using PBMCs from vaccinia-naïve individuals stimulated with staphylococcal enterotoxin B vs. unstimulated PBMCs (data not shown). Induction of vaccinia virus-specific CD8+ and CD4+ T cells from primary-vaccinated individ-uals (n = 5) at different time points following immunization was demonstrated. Each of five functions of CD8+ T cells at least one time point (1, 3, 6, and 12 months, post-vaccination) showed significantly higher responses, compared to pre-vaccination (p ≤ 0.05). For example, CD107a/b expression of CD8+ T cells demonstrated sig-nificantly higher at 3 time points (1, 3, and 6 months post-vaccination) at p-value of 0.025, 0.015, 0.019, respec-tively. Results of CD8+ T cells showed a predominance of CD107a/b expression, with a hierarchy of CD107a > MIP-1β > IFN-γ > TNF-α > IL-2 (Table 1, Figure 1(a)). For the CD4+ T cell subset, only production of MIP-1β was significantly higher as shown at 3 time points (1, 3, and 6 months post-vaccination) at p-value of 0.006, 0.006, 0.030, respectively, when compared to that of pre-vaccination (Table 1,Figure 1(a)).
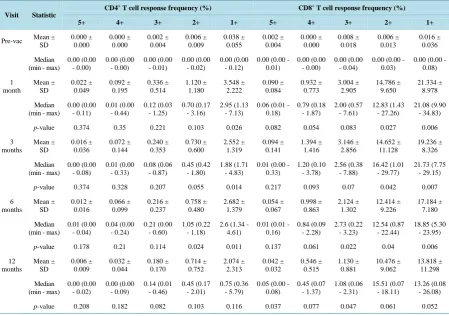
Quality of T cell responses was assessed by simultaneous measurement of all five functions. CD4+ T cells showed higher responses for only 2 phenotypes (p-value of 0.024) at one time point, 6 months post-vaccination (Table 2,Figure 1(b)). Polyfunctional CD8+ T cells, however, showed significantly higher responses in at least 2 phenotypes (p-value of 0.027, 0.042, 0.040) at three time points (1-, 3- and 6-month post-vaccination) as compared to pre-vaccination (Table 2,Figure1(c)). Moreover, these CD8+ T cells also demonstrated the higher responses for 3 phenotypes (p-value of 0.022 and 0.047) and 5 phenotypes (p-value of 0.037) at two time points (6- and 12-month) and one time points (12 months) post-vaccination, respectively.
3.2. ACAM2000™ Smallpox Vaccine Induces Neutralizing Antibody in Primary-Vaccinated
Individuals
Using PRNT to measure Nt antibody responses of primary-vaccinated individuals to vaccinia virus, three of five (60%) individuals showed Nt antibody (at titers ≥ 20) at 1-month after vaccination (Table 3). However, other two individuals demonstrated Nt antibody at 2 months, post-immunization. One individual showed peak Nt an-tibody at 2 months, while the other four participants demonstrated peak Nt anan-tibody at 3 months, post-vaccin- ation. All 5 participants were able to sustain Nt antibody responses for 6 months. Interestingly, three vaccinees (60%) showed Nt antibody responses until 12 months after primary vaccination.
4. Discussion
Variola virus, the causative agent of smallpox, was declared eradicated in 1977 after a global immunization pro-gram using live vaccinia virus [10]. Thus, a live vaccinia vaccine approach was chosen for the vaccine produc-tion for the US Strategic Naproduc-tional Stockpile. Up to now, ACAM2000™ has been replaced Dryvax for all small-pox vaccination in US since February 2008 [11]. The main advantage of live attenuated virus vaccines is that they mimic the natural infection and could induce a more balanced of both arms of immune responses than other vaccine types [12]. Moreover, the induced immunity is longer lasting. Immunologic correlates of protection against smallpox following primary vaccination are not clearly defined but are likely to involve a combination of humoral and cell-mediated immune responses [13].
Table 1. Mean values of net percent positive of each functional response of CD4+ and CD8+ T cells, demonstrated as mark-ers: CD107a/b, IFN-γ, MIP-1β, IL-2, and TNF-α at single-cell level of primary vaccinated-individuals (n = 5). Statistical differences between mean values at pre-vaccination, 1, 3, 6, and 12 months after immunization were assessed by paired- samples t-test.
Visit Statistic
Net % positive of each functional response of CD4+
T cells Net % positive of each functional response of CD8+ T cells
CD107a/b IFN-γ MIP-1β IL-2 TNF-α CD107a/b IFN-γ MIP-1β IL-2 TNF-α
Pre-vac Mean ± SD 0.002 ± 0.004 0.000 ± 0.000 0.000 ± 0.000 0.000 ± 0.000 0.006 ±
0.013 0.000 ± 0.000 0.010 ± 0.022 0.000 ± 0.000 0.002 ±
0.004
0.000 ± 0.000
Median (min - max)
0.00 (0.00 - 0.01)
0.00 (0.00 - 0.00) 0.00 (0.00 - 0.00) 0.00 (0.00 - 0.00) 0.00 (0.00 - 0.03)
0.00 (0.00 - 0.00)
0.00 (0.00 - 0.05)
0.00 (0.00 - 0.00)
0.00 (0.00 - 0.01)
0.00 (0.00 - 0.00)
1 month Mean ± SD 1.028 ± 1.171 0.342 ± 0.759 2.954 ± 1.218 0.560 ± 1.230 2.250 ±
3.363 30.620 ± 19.545 5.502 ± 7.423
24.128 ± 20.056 0.576 ± 0.860 3.286 ± 4.052 Median (min - max)
0.33 (0.06 - 2.59)
0.00 (0.00 - 1.70) 3.38 (1.27 - 4.28) 0.00 (0.00 - 2.76) 1.13 (0.00 - 8.19) 24.15 (11.41 - 57.07)
2.26 (0.90 - 18.49)
33.24 (1.27 - 42.91)
0.15 (0.02 - 2.08)
1.40 (0.58 - 10.40)
p-value 0.122 0.371 0.006 0.366 0.211 0.025 0.174 0.055 0.21 0.144
3
months Mean ± SD
0.606 ± 0.579 0.268 ± 0.588 2.670 ± 1.144 0.138 ± 0.303 1.160 ±
1.926 28.576 ± 15.683 5.022 ± 4.295
27.624 ± 22.110 0.168 ± 0.263 2.644 ± 1.996 Median (min - max)
0.53 (0.12 - 1.54)
0.01 (0.00 - 1.32) 2.38 (1.68 - 4.65) 0.00 (0.00 - 0.68) 0.42 (0.00 - 4.57)
23.80 (8.67 - 48.88)
3.45 (0.73 - 10.77)
36.60 (1.06 - 48.37)
0.02 (0.01 - 0.62)
1.77 (0.84 - 5.61)
p-value 0.081 0.366 0.006 0.366 0.252 0.015 0.06 0.049 0.231 0.041
6
months Mean ± SD
0.364 ± 0.385 0.238 ± 0.450 2.906 ± 1.964 0.070 ± 0.105 1.408 ±
1.349 23.886 ± 13.982 3.872 ± 3.132
22.642 ± 18.693 0.096 ± 0.116 2.118 ± 1.467 Median (min - max)
0.33 (0.06 - 1.01)
0.05 (0.00 - 1.04) 2.11 (1.31 - 5.85) 0.03 (0.00 - 0.25) 1.03 (0.00 - 3.44)
27.91 (5.76 - 42.37)
4.19 (0.32 - 8.44)
32.08 (1.32 - 43.14)
0.03 (0.00 - 0.28)
2.08 (0.66 - 3.75)
p-value 0.103 0.302 0.03 0.209 0.081 0.019 0.051 0.054 0.134 0.032
12
months Mean ± SD
0.502 ± 0.632 0.098 ± 0.120 2.598 ± 3.197 0.020 ± 0.045 0.668 ±
0.954 17.032 ± 14.319 1.364 ± 0.990
20.742 ± 19.239 0.084 ± 0.061 1.316 ± 0.869 Median (min - max)
0.20 (0.01 - 1.51)
0.07 (0.00 - 0.29) 1.17 (0.54 - 8.16) 0.00 (0.00 - 0.10) 0.38 (0.00 - 2.30)
20.45 (0.23 - 37.09)
1.06 (0.16 - 2.79)
27.76 (0.14 - 43.81)
0.09 (0.00 - 0.15)
1.31 (0.14 - 2.55)
p-value 0.152 0.143 0.143 0.374 0.191 0.056 0.038 0.073 0.034 0.028
We investigated whether the use of ACAM2000™ could induce T cell functions independently and/or simulta-neously and also specific neutralizing antibody in these individuals. Despite our small sample size, CD8+ T cells from these vaccinated individuals showed significantly higher virus-specific responses in both single function and polyfunctionality in phenotypes. These results were similar to those of Precopio, et al. [7]. They suggested that Dryvax offers the protection against smallpox infection because of its inherent ability to induce highly po-lyfunctional T cell responses. Our results emphasized their idea since ACAM2000™ is a derivative of Dryvax. However, Precopio, et al. reported higher frequency responses in individuals who were pre-immunized with two or three doses of MVA and challenged with Dryvax. The kinetics of each single function of CD8+ T cells in our study peaked mostly at 1 month after immunization and then gradually declined, as previously reported [15] [16]. However, the persistence of virus-specific CD8+ T cell functions was demonstrated up to at least 12 months after immunization.
Figure 1. Functional and phenotypic profiles of vaccinia virus-specific T cell responses of primary vac-cinated individuals (n = 5) at pre-vaccination, 1, 3, 6, and 12 month post-immunization. (a) Net % posi-tive responses of each function of CD4+ T cells (left panel) and CD8+ T cells (right panel). (b), (c) Re-sponse frequency (%) of functional composition of CD4+ T cells and CD8+ T cells, respectively. Every
possible combination of response is shown on the x-axis. Graph data is presented as mean values ± SD.
Table 2. Mean values of frequency (%) of polyfunctional response of CD4+ and CD8+ T cells demonstrated by simultaneous response of markers: CD107a/b, IFN-γ, MIP-1β, IL-2, and TNF-α at single-cell level of primary vaccinated-individuals (n = 5). Statistical differences between mean values at pre-vaccination, 1, 3, 6, and 12 months after immunization were assessed by paired-samples t-test.
Visit Statistic
CD4+ T cell response frequency (%) CD8+ T cell response frequency (%)
5+ 4+ 3+ 2+ 1+ 5+ 4+ 3+ 2+ 1+
Pre-vac Mean ±
SD 0.000 ± 0.000 0.000 ± 0.000 0.002 ± 0.004 0.006 ± 0.009 0.038 ± 0.055 0.002 ± 0.004 0.000 ± 0.000 0.008 ± 0.018 0.006 ± 0.013 0.016 ± 0.036 Median (min - max)
0.00 (0.00 - 0.00) 0.00 (0.00 - 0.00) 0.00 (0.00 - 0.01) 0.00 (0.00 - 0.02) 0.00 (0.00 - 0.12)
0.00 (0.00 - 0.01)
0.00 (0.00 - 0.00)
0.00 (0.00 - 0.04)
0.00 (0.00 - 0.03)
0.00 (0.00 - 0.08) 1 month Mean ± SD 0.022 ± 0.049 0.092 ± 0.195 0.336 ± 0.514 1.120 ± 1.180 3.548 ± 2.222 0.090 ± 0.084 0.932 ± 0.773 3.004 ± 2.905 14.786 ± 9.650 21.334 ± 8.978 Median (min - max)
0.00 (0.00 - 0.11) 0.01 (0.00 - 0.44) 0.12 (0.03 - 1.25) 0.70 (0.17 - 3.16) 2.95 (1.13 - 7.13)
0.06 (0.01 - 0.18) 0.79 (0.18 - 1.87) 2.00 (0.57 - 7.61) 12.83 (1.43 - 27.26) 21.08 (9.90 - 34.83)
p-value 0.374 0.35 0.221 0.103 0.026 0.082 0.054 0.083 0.027 0.006
3 months Mean ± SD 0.016 ± 0.036 0.072 ± 0.144 0.240 ± 0.353 0.730 ± 0.600 2.552 ± 1.319 0.094 ± 0.141 1.394 ± 1.416 3.146 ± 2.856 14.652 ± 11.128 19.236 ± 8.326 Median (min - max)
0.00 (0.00 - 0.08) 0.01 (0.00 - 0.33) 0.08 (0.06 - 0.87) 0.45 (0.42 - 1.80) 1.88 (1.71 - 4.83)
0.01 (0.00 - 0.33) 1.20 (0.10 - 3.78) 2.56 (0.38 - 7.88) 16.42 (1.01 - 29.77) 21.73 (7.75 - 29.15)
p-value 0.374 0.328 0.207 0.055 0.014 0.217 0.093 0.07 0.042 0.007
6 months Mean ± SD 0.012 ± 0.016 0.066 ± 0.099 0.216 ± 0.237 0.758 ± 0.480 2.682 ± 1.379 0.054 ± 0.067 0.998 ± 0.863 2.124 ± 1.302 12.414 ± 9.226 17.184 ± 7.180 Median (min - max)
0.01 (0.00 - 0.04) 0.04 (0.00 - 0.24) 0.21 (0.00 - 0.60) 1.05 (0.22 - 1.18)
2.6 (1.34 - 4.61)
0.01 (0.01 - 0.16) 0.84 (0.09 - 2.28) 2.73 (0.22 - 3.23) 12.54 (0.87 - 22.44) 18.85 (5.30 - 23.95)
p-value 0.178 0.21 0.114 0.024 0.011 0.137 0.061 0.022 0.04 0.006
12 months Mean ± SD 0.006 ± 0.009 0.032 ± 0.044 0.180 ± 0.170 0.714 ± 0.752 2.074 ± 2.313 0.042 ± 0.032 0.546 ± 0.515 1.130 ± 0.881 10.476 ± 9.062 13.818 ± 11.298 Median (min - max)
0.00 (0.00 - 0.02) 0.00 (0.00 - 0.09) 0.14 (0.01 - 0.46) 0.45 (0.17 - 2.01) 0.75 (0.36 - 5.79)
0.05 (0.00 - 0.08) 0.45 (0.07 - 1.37) 1.08 (0.06 - 2.31) 15.51 (0.07 - 18.11) 13.26 (0.08 - 26.08)
p-value 0.208 0.182 0.082 0.103 0.116 0.037 0.077 0.047 0.061 0.052
Table 3. Serum neutralizing antibody titers among primary vaccinated individuals over a one-year period following vaccina-tion.
Subject Gender Pre-vac (day 0) Post-vaccination at month
0.5th 1st 2nd 3rd 6th 12th
1 F <10 10 80 160 1280 320 20
2 F <10 <10 <10 80 160 40 <10
3 M <10 10 160 320 160 160 160
4 F <10 <10 40 40 320 80 <10
5 F <10 ND <10 40 160 160 160
effective in inducing protective humoral immunity in primary vaccination may need to be longer than the usual performed at one month time period. Nt antibody titers of most volunteers peaked at 3 months, post-vaccination. On the other hand, Walsh et al. reported that peak Nt antibody titers occurred on day 42 (14 days after second immunization) since they used 2 doses of MVA, a replication defective strain of vaccinia virus [21]. Persistence of protective Nt antibody was demonstrated for up to at least 6 months after primary vaccination in all partici-pants. Interestingly, 3 of 5 vaccinees (60%) successfully maintained Nt antibody for up to 12 months, post-vac- cination. Moreover, 2 of these 3 vaccinees were able to sustain Nt antibody for 18 months, post-vaccination (da-ta not shown). In the case of a bioterrorism, one dose of primary vaccination should be enough to induce protec-tive immunity among naïve individuals, unless a more than sufficient supply of vaccine is available.
[image:7.595.89.539.482.588.2]vari-ations in Nt antibody development after smallpox vaccination, with female shaving a significantly higher Nt an-tibody titer than males [22]. On the other hand, Troy et al, reported higher PRNT titers in men after vaccination [23]. In our study, Nt antibody titer between males and females were similar. However, the male participant showed faster Nt antibody peak (at month 2, post-vaccination) than the Nt antibody peak of the 4 female partic-ipants (at month 3, post-vaccination).
5. Conclusion
In conclusion, although the sample size of this study was extremely small for human study, our data demon-strated that primary immunization by ACAM2000™ smallpox vaccine in naïve individuals would be sufficient for induction of both single & polyfunctional CD8+ T cells and Nt antibody responses. Persistence of both im-mune responses was at least 6 months post-immunization.
Acknowledgements
The authors gratefully acknowledge the volunteers who participated as subjects in this study. We thank Mr. Su-thipol Udompunturuk for advice on statistical analysis. This study was supported by a grant from the Siriraj Re-search Development Fund (IO R015233008), Faculty of Medicine Siriraj Hospital, Mahidol University.
Conflict of Interest
The authors hereby declare no personal or professional conflicts of interest regarding any aspect of this study.
References
[1] Puissant, B. and Combadière, B. (2006) Keeping the Memory of Smallpox Virus. Cellular and Molecular Life Sciences,
63, 2249-2259. http://dx.doi.org/10.1007/s00018-006-6313-2
[2] Monath, T.P., Caldwell, J.R., Mundt, W., Fusco, J., Johnson, C.S., Buller, M., et al. (2004) ACAM2000 Clonal Vero Cell Culture Vaccinia Virus (New York City Board of Health strain)—A Second-Generation Smallpox Vaccine for Bi-ological Defense. International Journal of Infectious Diseases, 8S2, S31-S44.
[3] Kennedy, R.B., Ovsyannikova, I.G., Jacobson, R.M. and Poland, G.A. (2009) The Immunology of Smallpox Vaccine. Current Opinion in Immunology, 21, 314-320. http://dx.doi.org/10.1016/j.coi.2009.04.004
[4] Moss, B. (2011) Smallpox Vaccines: Targets of Protective Immunity. Immunological Reviews, 239, 8-16. http://dx.doi.org/10.1111/j.1600-065X.2010.00975.x
[5] Harrington, L.E., Most, R., Whitton, J.L. and Ahmed, R. (2002) Recombinant Vaccinia Virus-Induced T-Cell Immun-ity: Quantitation of the Response to the Virus Vector and the Foreign Epitope. Journal of Virology, 76, 3329-3337. http://dx.doi.org/10.1128/JVI.76.7.3329-3337.2002
[6] Taub, D.D., Ershler, W.B., Janowski, M., Artz, A., Keys, M.L., McKelveya, J., et al. (2008) Immunity from Smallpox Vaccine Persists for Decades: A Longitudinal Study. American Journal of Medicine, 121, 1058-1064.
http://dx.doi.org/10.1016/j.amjmed.2008.08.019
[7] Precopio, M.L., Betts, M.R., Parrino, J., Price, D.A., Gostick, E., Ambrozak, D.R., et al. (2007) Immunization with Vaccinia Virus Induces Polyfunctional and Phenotypically Distinctive CD8+ T Cell Responses. Journal of Experimen-tal Medicine, 204, 1405-1416. http://dx.doi.org/10.1084/jem.20062363
[8] Cox, J.H. (1999) HIV-1-Specific Cytotoxic T-Cell Assays. In: Michael, N.L. and Kim, J.H., Eds., Methods in Molecu-lar Medicine, Vol. 17: HIV Protocols, Humana Press, Totowa, 355-371. http://dx.doi.org/10.1385/0-89603-369-4:355
[9] Newman, F.K., Frey, S.E., Blevins, T.P., Mandava, M., Bonifacio, A., Yan, L., et al. (2003) Improved Assay to Detect Neutralizing Antibody Following Vaccination with Diluted or Undiluted Vaccinia (Dryvax) Vaccine. Journal of Clin-ical Microbiology, 41, 3154-3157. http://dx.doi.org/10.1128/JCM.41.7.3154-3157.2003
[10] Fenner, F., Henderson, D.A., Arita, I., Jezek, Z. and Ladnyi, I.D. (1988) Smallpox and Its Eradication. World Health Organization, Geneva.
[11] Nalca, A. and Zumbrun, E.E. (2010) ACAM2000: The New Smallpox Vaccine for United States Strategic National Stockpile. Drug Design, Development and Therapy, 4, 71-79. http://dx.doi.org/10.2147/DDDT.S3687
[12] Watson, J.C. and Peter, G. (1999) General Immunization Practices. In: Plotkin, S.A. and Orenstein, W.A., Eds., Vac-cines, 3rd Edition, WB Saunders Company, Philadelphia, 47-73.
Antiviral Immunity after Smallpox Vaccination. Nature Medicine, 9, 1131-1137. http://dx.doi.org/10.1038/nm917
[14] Basu, R.N., Jezek, Z. and Ward, N.A. (1979) Smallpox and Its Eradication from the South-East Asia Region. WHO/ SEARO, 36, 1-3.
[15] Rock, M.T., Yoder, S.M., Wright, P.F., Talbot, T.R., Edwards, K.M. and Crowe Jr., J.E. (2005) Differential Regulation of Granzyme and Perforin in Effector and Memory T Cells Following Smallpox Immunization. Journal of Immunology,
174, 3757-3764. http://dx.doi.org/10.4049/jimmunol.174.6.3757
[16] Amanna, I.J., Slifka, M.K. and Crotty, S. (2006) Immunity and Immunological Memory Following Smallpox Vaccina-tion. Immunological Reviews, 211, 320-337. http://dx.doi.org/10.1111/j.0105-2896.2006.00392.x
[17] Mack, T.M., Noble Jr., J. and Thomas, D.B. (1972) A Prospective Study of Serum Antibody and Protection against Smallpox. The American Journal of Tropical Medicine and Hygiene, 21, 214-218.
[18] Sarkar, J.K., Mitra, A.C. and Mukherjee, M.K. (1975) The Minimum Protective Level of Antibodies in Smallpox. Bul-letin of the World Health Organization, 52, 307-311.
[19] Artenstein, A.W., Iohnson, C., Marbury, T.C., Morrison, D., Blum, P.S., Kemp, T., et al. (2005) A Novel, Cell Culture-Derived Smallpox Vaccine in Vaccinia Naive Adults. Vaccine, 23, 3301-3309.
http://dx.doi.org/10.1016/j.vaccine.2005.01.079
[20] Frey, S.E., Newman, F.K., Kennedy, J.S., Ennis, F., Abate, G., Hoft, D.F., et al. (2009) Comparison of the Safety and Immunogenicity of ACAM1000 and ACAM2000 and Dryvax in Healthy Vaccinia Naïve Adults. Vaccine, 27, 1637-1644. http://dx.doi.org/10.1016/j.vaccine.2008.11.079
[21] Walsh, S.R., Wilck, M.B., Dominguez, D.J., Zablowsky, E., Bajimaya, S., Gagne, L.S., et al. (2013) Safety and Im-munogenicity of Modified Vaccinia Ankara in Hematopoietic Stem Cell Transplant Recipients: A Randomized, Con-trolled Trial. The Journal of Infectious Diseases, 207, 1888-1897. http://dx.doi.org/10.1093/infdis/jit105
[22] Kennedy, R.B., Ovsyannikova, I.G., Pankratz, V.S., Vierkant, R.A., Jacobson, R.M., Ryan, M.A., et al. (2009) Gender Effects on Humoral Immune Responses to Smallpox Vaccine. Vaccine, 27, 3319-3323.
http://dx.doi.org/10.1016/j.vaccine.2009.01.086