doi:10.4236/epe.2013.54B149 Published Online July 2013 (http://www.scirp.org/journal/epe)
A New Evolutionary Method for Solving Combined
Economic and Emission Dispatch
A. N. Afandi, Hajime Miyauchi
Computer Science and Electrical Engineering, GSST, Kumamoto University, Kumamoto, Japan Email: [email protected], [email protected]
Received April, 2013
ABSTRACT
This paper presents a new evolutionary method called in Harvest Season Artificial Bee Colony (HSABC) algorithm for solving constrained problems of Combined Economic and Emission Dispatch (CEED). The IEEE-30 bus system is adopted as a sample system for determining the best solutions of the CEED problems considering operational con-straints. Running outs of designed programs for the HSABC show that applications of various compromised factors have different implications on the CEED’s results, that minimum cost computations are started at different values, and that increasing load demands have affected costs, pollutant emissions and generated powers.
Keywords: Bees; Cost; Economic; Emission; Harvest; Minimum
1. Introduction
A power system is constructed by using interconnected structures for feeding an electric energy from generator sites to the some areas considering a sharing amount of a total power to meet a load demand at a certain period time of operation. One purpose of this strategy is to re-duce the total technical operating cost through the com-bination various types of power plants. A minimizing cost problem of power system operation can be ex-pressed by using an Economic Load Dispatch (ELD) for obtaining a minimum total fuel cost of generating units. In general, ELD’s primary objective is to schedule the committed generating unit outputs to meet a certain load demand at a certain time under some operational con-straints [1-3].
Presently, since the public awareness of the environ-mental protection has been increased to reduce atmos-pheric emissions, the ELD considers pollutant emissions in the air from combustions of fossil fuels at thermal power plants [4]. By considering an Emission Dispatch (EmD), the power system operation has to modify opera-tional strategies of the thermal power plants for reducing pollutants in the air [5]. The ELD problem has become a crucial task to optimize a fuel cost with reducing a pollu-tant emission for scheduling the generating unit outputs based on a minimum total cost [6].To avoid complexity problems of both dispatching types for determining solu-tions with difference targets, ELD and EmD are trans-formed into single objective function as a Combined Economic and Emission Dispatch (CEED).
Currently, many previous works have been success-fully applied to solve the CEED problems [5,7-11]. The proposed methods have been introduced by using appli-cations of mathematical programmings and optimization techniques [12]. Specifically, those methods can be de-vided into traditional and evolutionary types. Traditional methods cover several approaches such as linear pro-gramming, lagrangian relaxation, langrange multiplier and it can be applied to many problems [7,13-15]. On the other hand, evolutionary methods have become alterna-tive ways to solve the problems. These methods are composed by using intelligent techniques for determining an optimum result like genetic algorithm, evolutionary programming, particles swarm optimization and neural network [5,16-20].
The HSABC is introduced in 2013 and it is composed by Multiple Food Sources (MFS) for mimicing flowers of a harvest season to provides candidate solutions of the problem [27].
This paper presents the HSABC for obtaining the best solution of the CEED problems. The objective function of the CEED is subjected to some operational constraints. In these works, IEEE-30 bus system is adopted as a sam-ple system for the simulations.
2. Problem Statement
2.1. Combined Economic and Emission Dispatch
A problem of ELD is related to a nonlinear equation [28]. The ELD’s objective function is expressed by a total cost for providing a total power from generation stations and it can be computed by using equation (1). Presently, an ELD includes a pollutant emission as a constraint. Vari-ous pollutants have been come from the burning of fossil fuels in the thermal power plants [8,9,14]. The total pol-lutant emission is formulated by equation (2) as the EmD. The ELD and EmD are composed into single objective function of CEED problem with considering a price pe-nalty [8] and a weighting factor as a compromised factor [5] as formed in equation (4). The penalty factor shows the rate coefficient of each generating unit at its maxi-mum output for the given load. The compromised factor shows a sharing contribution of ELD and EmD. Several limitations for performing CEED are given by equation (5) to (10). Specifically, a total transmission loss is not constant and it depends on the power outputs of generat-ing units[28,29]. The transmission loss can be appeared from a load flow analysis. In general, the CEED problem can be formulated by using expressions as follows:
ELD minimize , (1)
EmD minimize , (2)
, (3)
CEED minimize , (4)
, (5)
, (6)
, (7)
, (8)
, (9)
. (10)
where Pi is output power of ithgenerating unit (MW), ai, bi, ci are fuel cost coefficients of ith generating unit, Ftc is total fuel cost ($/hr), αi, βi, γi are emission coefficients of
ith generating unit, Et is total emission of generating units (kg/hr), hi is individual penalty factor of ith generating unit, Pimax is maximum output power of ith generating unit, Ei is total emission of ith generating unit (kg/hr), Fi is fuel cost of ith generating unit ($/hr), Φ is CEED ($/hr), w is compromised factor, ng is number of generator, h is pe-nalty factor of ascending order selection of hi, PD is power load demand, PL is transmission loss, PGp and QGp are power injections of load flow at bus p, PDp and QDp are load demands of load flow at bus p, Vp and Vq are voltages at bus p and q, Pimin is minimum power of ith generating unit, Qimax and Qimin are maximum and mini-mum reactive powers of ith generating unit, Vpmax and Vpmin are maximum and minimum voltages at bus p.
2.2. Harvest Season Artificial Bee Colony
The HSABC algorithm is composed by MFS to presents many flowers of the harvest season located randomly at certain positions in the harvest season area [27]. Specifi-cally, HSABC is inspired by a harvest season situation in nature for providing flowers. In the HSABC, a flower is presented by a food source and MFS express many flow-ers. To exploit food sources, bees fly randomly during foraging for the foods and the position moves from a selected current food source to another one [25,30]. In the HSABC, MFS are consisted by the First Food Source (FFS) and Other Food Sources (OFS). Each position of OFS is directed by a harvest operator (ho) from the FFS. A set of OFS is preceded by foraging for the FFS. As in the ABC, the HSABC has four phases for searching the best food as a final solution, those are initial phase, em-ployed bees phase, onlooker bees phase and scout bees phase.
In general, the rules of the HSABC are a set of MFS is consisted by FFS and OFS, the FSS is followed by OFS, every food source is located at a different position, all food sources stay in the harvest season area, colony size is consisted by employed bees and onlooker bees, an employed bee of an abandoned food source becomes a scout bee. By mathematical expressions, the HSABC are presented as following expressions:
, (11)
, (12)
, (13)
, (14)
. (15)
where xij is a current food, i is the ith solution of the food source, j∈{1,2,3,…,D}, D is the number of variables of the problem, xminj is minimum limit of xij, xmaxj is maxi-mum limit of xij, vij is food position, xkj is random neighborof xij, k∈{1,2,3,…,SN}, SN is the number of solutions, Øi,j is a random number within [-1,1], Hiho is harvest season food position, ho∈{2,3,…,FT}, FT is the total number of flowers for harvest season, xfj is random harvest neighborof xkj, f ∈{1,2,3,…,SN}, Rj is a ran-domly chosen real number within [0,1], MR is modified rate of probability food, Fi is objective function of the ith solution of the food, fiti is fitness value of the ith solution and pi is probability of the ith quality of food.
3. Sample System and Procedures
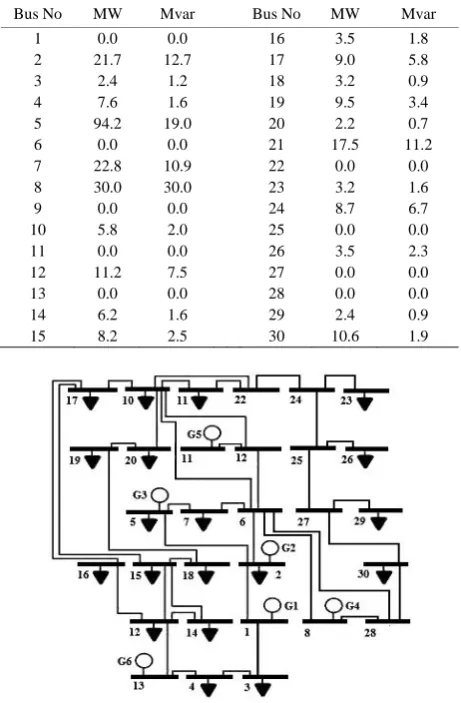
In these simulations, parameters listed in Table 1 to Ta-ble 3 are used for the sample system. Figure 1 shows the single line diagram of IEEE-30 bus system.
Designed programs of application HSABC for solving CEED problems are created by considering several steps of HSABC’s procedures as presented in Figure 2. The listing programs are categorized into three programs. The data input program is consisted by a set data of parame-ters for generating units, transmission lines, loads, con-straints, CEED’s parameters and HSABC’s parameters. The CEED program is designed for an objective function to compute a minimum total cost based on the CEED problem, compromised factors and constraints. The HSABC program is developed by using HSABC’s steps for searching the best solution of the CEED problem.
4. Results and Discussions
[image:3.595.307.540.99.207.2]These works are addressed to solve the CEED problem using HSABC algorithm for obtaining the best solution
Table 1. Fuel cost coefficients and mw limits.
Bus Gen a
($/MWh2)
b
($/MWh) c
Pmin
(MW)
Pmax
(MW)
1 G1 0.00375 2.00000 0 50 200
2 G2 0.01750 1.75000 0 20 80
5 G3 0.06250 1.00000 0 15 50
8 G4 0.00835 3.25000 0 10 35
11 G5 0.02500 3.00000 0 10 30
[image:3.595.77.288.185.312.2]13 G6 0.02500 3.00000 0 12 40
Table 2. Emission coefficients and mvar limits.
Gen α
(kg/MWh2) (kg/MWh) β γ (Mvar) Qmin (Mvar) Qmax
G1 0.0126 -1.1000 22.9830 100 -100
G2 0.0200 -0.1000 25.3130 60 -60
G3 0.0270 -0.0100 25.5050 65 -15
G4 0.0291 -0.0050 24.9000 50 -15
G5 0.0290 -0.0040 24.7000 40 -10
[image:3.595.310.539.235.343.2]G6 0.0271 -0.0055 25.3000 15 -15
Table 3. Load data for each bus.
Bus No MW Mvar Bus No MW Mvar
1 0.0 0.0 16 3.5 1.8
2 21.7 12.7 17 9.0 5.8
3 2.4 1.2 18 3.2 0.9
4 7.6 1.6 19 9.5 3.4
5 94.2 19.0 20 2.2 0.7
6 0.0 0.0 21 17.5 11.2
7 22.8 10.9 22 0.0 0.0
8 30.0 30.0 23 3.2 1.6
9 0.0 0.0 24 8.7 6.7
10 5.8 2.0 25 0.0 0.0
11 0.0 0.0 26 3.5 2.3
12 11.2 7.5 27 0.0 0.0
13 0.0 0.0 28 0.0 0.0
14 6.2 1.6 29 2.4 0.9
15 8.2 2.5 30 10.6 1.9
[image:3.595.308.539.370.722.2]Figure 2. HSABC’s flow chart for solving CEED problem.
and determining a committed power outputs of generat-ing units. The main purpose of the used compromised factors is to know the best combination of ELD and EmD from possibility values of combinations. To observe HSABC’s performances on load demand changes are studied in this section. Effects of load demand changes are also evaluated on the sample system.
These studies consider 283.4 MW of load demand, ± 5% of voltage limits, power balance and power limits. The programs are executed by using colony size = 100, number of foods = 50, limit number of foods = 50, total foraging cycles = 100 and 3 flowers. An initial popula-tion of a set candidate food is presented in Figure 3 as the candidate solutions for six generating units. The best food of each food source is located at random positions as shown in Figure 4. Determined iterations on the CEED’s minimum cost are presented in Table 4 and
Figure 5.
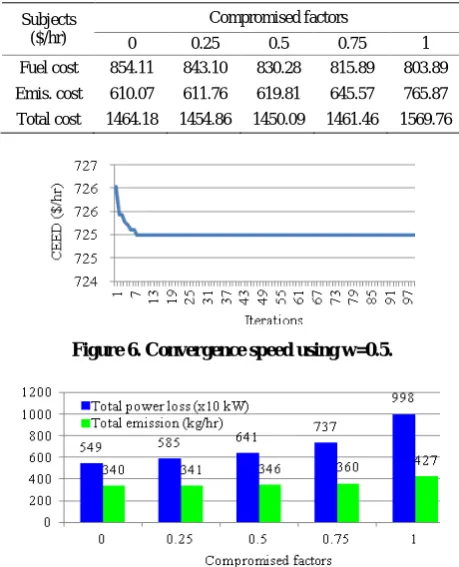
Final solutions of the committed power outputs of ge-nerating units to meet a load demand at the minimum total costs are listed in Table 5 and final minimum oper-ating costs are provided in Table 6. Power losses and pollutant emissions are presented in Figure 7. By consi-dering combinations of ELD and EmD, according to Ta-ble 6 and Figure 5, better results are obtained by using w = 0.5. For this chase, the CEED has the shortest range from a starting cost to reaches a minimum cost, the cheapest total cost is given by using w = 0.5 and the fastest convergence speed is also performed by using this compromised factor as presented in Figure 5. The con-vergence speed of the CEED used w = 0.5 is illustrated in Figure 6.
Practically, generating units are associated with load demand behaviors during operations. To performs load demand changes and evaluates it in the total cost are stu-died in these works. For these works, a sharing contribu-tion of ELD and EmD use 0.5 of compromised factor. Load demands are assumed to increase gradually at load
buses. The performances on increased load demands are listed in Table 7. By comparing costs in Table 7 to Ta-ble 6 for column w = 0.5, the percentage results are given in Table 8.
Figure 3. Populations of candidate solutions.
Figure 4. Food positions of food sources.
Table 4. CEED’s minimum of the computations.
Costs ($/hr)
Compromised factors
0 0.25 0.5 0.75 1
CEED 609.94 669.51 724.98 773.28 798.02
ELD neglected 210.78 415.14 611.92 798.02
EmD 609.94 458.73 309.84 161.36 neglected
Starting 612.36 671.14 726.04 776.05 806.15
Minimum 609.94 669.51 724.98 773.28 798.02
Table 5. Final result of committed power outputs.
Subjects (MW)
Compromised factors
0 0.25 0.5 0.75 1
G1 112.29 117.60 126.07 140.68 177.46
G2 46.96 48.26 49.74 50.66 49.35
G3 34.87 31.48 28.40 25.25 19.63
G4 31.48 31.66 31.80 30.90 22.83
G5 30.00 29.54 26.63 21.74 12.11
G6 33.29 30.71 27.17 21.54 12.00
Total power 288.89 289.25 289.81 290.77 293.38
Total loss 5.49 5.85 6.41 7.37 9.98
Table 6. Final result of minimum total costs.
Subjects ($/hr)
Compromised factors
0 0.25 0.5 0.75 1
Fuel cost 854.11 843.10 830.28 815.89 803.89
Emis. cost 610.07 611.76 619.81 645.57 765.87
[image:5.595.309.537.100.184.2]Total cost 1464.18 1454.86 1450.09 1461.46 1569.76
Figure 6. Convergence speed using w=0.5.
[image:5.595.56.286.265.549.2]Figure 7. Final results of emissions and power losses.
Table 7. Final results on various loads.
Subjects Increased load demands (MW)
20% 30% 40%
G1 (MW) 150.84 165.76 182.73
G2 (MW) 62.08 69.86 78.78
G3 (MW) 34.44 38.53 43.20
G4 (MW) 35.00 35.00 35.00
G5 (MW) 30.00 30.00 30.00
G6 (MW) 36.59 40.00 40.00
Total G (MW) 348.95 379.15 409.71
Loss (MW) 8.87 10.73 12.95
T. Emission (kg/hr) 469.55 547.48 639.21
T. Emission Cost ($/hr) 841.24 980.89 1145.20
T. Fuel Cost ($/hr) 1051.37 1170.00 1293.45
T. Cost ($/hr) 1892.61 2150.89 2438.65
Table 8. Percentage results on various loads.
Subjects
New load demands
340.08 MW (20%)
368.42 MW (30%)
396.76 MW (40%)
Fuel costs 0.2663 0.4092 0.5578
Emis. Costs 0.3573 0.5826 0.8477
Total cost 0.3052 0.4833 0.6817
From Table 7 is known that all power outputs of com-bined generating units are produced up by increased load demands. Specifically, G5 and G4 feed to the power sys-tem with 30 MW and 35 WM because of upper power limits. Generating units produces 348.95 MW to 409.71 MW of total powers with increasing losses from 8.87 MW to 12.95 MW. The most interesting point is 40% of increased load demand. In this case, all components of cost exceed 50 % as listed in Table 8. The higher load demand associates with greater payments of generating unit.
5. Conclusions
This paper presents an application of a new evolutionary method, Harvest Season Artificial Bee Colony Algorithm, for solving CEED problem using IEEE-30 bus as a sam-ple system. These works demonstrate that compromised factors give effects to the CEED’s solutions. These stu-dies indicate that increasing load demands affect gener-ated power outputs, pollutant emissions and costs. By considering compositions of ELD and EmD, the lowest total cost is obtained by CEED using 0.5 of compromised factor. In these simulations, the HSABC is tested on a standard model of IEEE, a revealing real sample system is devoted to the future works.
6. Acknowledgements
The authors gratefully acknowledge the support and thanks to Kumamoto University (Japan) and Beasiswa Luar Negeri DIKTI (Indonesia).
REFERENCES
[1] H. Chahkandi Nejad, 1R. Jahani, 1M. Mohammad Abadi, “GAPSO-based Economic Load Dispatch of Power Sys-tem”, Australian Journal of Basic and Applied Sciences, Vol. 5, No.7, 2011, pp. 606-611.
[2] M. A. Abido, “Multiobjective Evolutionary Algorithms for Electric Power Dispatch Problem,” IEEE Transac-tions on Evolutionary Computation, Vol. 10, No. 3, 2006,
pp. 315-329
[image:5.595.58.291.593.736.2][4] Y. Z. Cheng, W. P. Xiao, W.-J. Lee and M. Yang, “A New Approach for Missions and Security Constrained Economic Dispatch”, Proc. NAPS, IEEE Conference Publication, Starkville USA, 4-6 Oct 2009, pp. 1-5.
[5] M. A. Abido, “Enviranmental/economic Power Dispatch Using Multiobjective Evolutionary Algorithm,” IEEE Transactions Power Systems, Vol. 18, No. 4, 2003, pp.
1529-1537
[6] F. S. Abu-Mouti and M. E. El-Hawary, “Optimal Distri-buted Generation Allocation and Sizing in Distribution System via Artificial Bee Colony Algorithm,” IEEE Journal & Magazines, Vol. 26, No. 4, 2011, pp. 2090-2101.
[7] A. A. El-Keib, H. Ma and J. L. Hart, “Environmentally Constrained ED Using the Lagrangian Relaxation Me-thod”, IEEE Trans. Power Systems, Vol. 9, Issue. 4, 1994,
pp. 1723-1729.
[8] K. Sathish Kumar, V. Tamilselvan, N. Murali, R. Raja-ram, N. Shanmuga Sundaram and T. Jayabarathi, “Eco-nomic Load Dispatch with Emission Constraints Using Various PSO Algorithm,” WSEAS Transaction on Power System, Vol. 3, No. 9, 2008, pp. 598-607.
[9] R. Gopalakrishnan and A. Krishnan, “A Novel Combined Economic and Emission Dispatch Problem Solving Tech-nique Using Non-dominated Ranked Genetic Algorithm,” European Journal of Scientific Research, Vol. 64, No. 1, 2011, pp. 141-151.
[10] Y. Fu, M. Shahidehpour, Z. Y. Li : “AC Contingency Dispatch Based on Security Constrained Unit Commit-ment”, IEEE Transactions on Power Systems, Vol. 21, pp. 897-908 (2006).
[11] Yong Fu, Mohammad Shahidehpour, Zuyi Li, “Security Constrained unit Commitment with AC Constraints,” IEEE Transactions Power Systems, Vol. 20, No. 3, 2005,
pp. 1538-1550
[12] B. H. Chowdhury and S. Rahman, “A Review of Recent Advances in Economic Dispatch,” IEEE Transactions on Power Systems, Vol. 5, No. 4, 1990, pp. 1248-1259.
[13] A. Farag, S. Al-Baiyat and T. C. Cheng, “Economic Load Dispatch Multiobjective Optimization Procedures Using Linear Programming Techniques,” IEEE Transactions Power Systems, Vol. 10, No. 2, 1995, pp. 731-738.
[14] M. Garg and S. Kumar, “A Survey on Environmental Economic Load Dispatch Using Lagrange Multiplier Method,” International Journal of Electronics & Com-munication Technology, Vol. 3, No. 1, 2012, pp. 43-46. [15] S. Subramanian and S. Ganesa, “A Simplified Approach
for ED with Piecewise Quadratic Cost Functions,” Inter-national Journal of Computer and Electrical Engineering, Vol. 2, No. 5, 2010, pp. 793-798.
[16] I. G. Damausis, A. G. Bakirtzis and P. S. Dokopoulos, “Network Constrained Economic Dispatch Using Real Coded Genetic Algorithm,” IEEE Transaction Power
Systems, Vol. 18, No. 1, 2003, pp. 198-205.
[17] M. A. Aziz, J. I. Musirin and T. K. A. Rahman, “Solving dynamic ED using evolutionary programming”, Proc. First International Power and Energy Conference, Putra Jaya, 28-29 Nov 2006, pp. 144-149.
[18] T. Yalcinoz and M. J. Short, “Large-scale ED using an improved hopfield neural network”, IEE Proc. Gener. Transm. Distrib, Vol. 144, Issue. 22, 1997, pp. 181-185.
[19] Y. Abdelaziz, S. F. Mekhamer, M. A. L. Badr, and M. Z. Kamh, “ED using an enhanced hopfield neural network”, Electric Power Components and Systems, Vol. 36, No. 7,
2008, pp. 719-73
[20] Z.-L. Gaing, “Particle Swarm Optimization to Solving the ED Considering the Generator Constraints,” IEEE Transactions Power Systems, Vol. 18, No. 3, 2003,
pp.1187-11
[21] D. Karaboga, “An Idea Based on Honey Bee Swarm for Numerical Optimization”, Technical Report-TR06, Er-ciyes University, Turkey, 2005.
[22] M. Subotic, “Artificial Bee Colony Algorithm for Con-strained Optimization Problems Modified with Multiple Onlookers,” International Journal and Mathematical Models and Methods in Applied Sciences, Vol. 6, No. 2, 2012, pp.314-322.
[23] N. Stanarevic, M. Tuba and N. Bacanin, “Modified Ar-tificial Bee Colony Algorithm for Constrained Problems Optimization”, International Journal of Mathematical Models and Methods in Applied Science, Vol. 5, No. 3, 2011, pp. 644-651.
[24] E. M. Montes, M. D. Araoz and O. C. Dominges, “Smart Flight and Dynamic Tolerances in the Artificial Bee Co-lony for Constrained Optimization,” Proc. IEEE Con-gress on Evolutionary Computation CEC , Barcelona, 18-23 July 2010, pp. 1-8.
[25] D. Karaboga and B. Basturk, “A Powerful and Efficient Algorithm for Numerical Function Optimization: AB-CAlgorithm,” Journal of Global Optimization, Vol. 39, No. 0925-5001, 2007, pp. 459-471.
[26] C. C. Columbus and S. P. Simon, “A Parallel ABC for Security Constrained Economic Dispatch Using Shared Memory Mmodel,” Proc. 2012 EPSCICON IEEE Confe-rence Publication, Thrissur Kerala, 3-6 Jan 2012, pp. 1-6. [27] A. N. Afandi and H. Miyauchi, “Multiple Food Sources
for Composing Harvest Season Artificial Bee Colony Algorithm on Economic Dispatch Problem,” Proc. The 2013 Annual Meeting of the IEEJ, Nagoya, 20-22 March 2013, No. 6-008, pp. 11-12.
[28] H. Saadad, “Electric Power System,” Mc. Graw Hill, New York, 1999.