EUROPEAN ATOMIC ENERGY COMMUNITY - EURATOM
FUEL MANAGEMENTS FOR AN ORGEL PROTOTYPE
ORIENTATION STUDY
by
B. CHAMBAUD, J.C. CHARRAULT, A. DECRESSIN and P. YAUCH
1968
ORGEL Program
Joint Nuclear Research Center lspra Establishment - ,Italy
LEGAL NOTICE
This
doownent was prepared under the sponsorship of the Commtulonof the EUl'Opean Communities.
Neither the Commtasion of the EUl'Opean Communities, Its conh any person 'acting on their behalf :
1 nor
Male any warranty or representation, express or implied, with respe. ~he accuracy, completeness, or usefulness of the Information contained
\11
document, or that the use of anyinf
onnation, apparatus, method. or ssdtsclosed in this document may not tnfrtnge privately owned rights:
Assume any ltabiltty with respect to the use of. or for damages res, from the use of any tnf ormation, apparatus, method or process disc. in this document.
This report is on sale at the addresses listed on cover page 4
at the price of
FF
5.-FB
so.-
DM
4.-Lit.
620FI.
3.60When ordering, please quote the EUR number and the title, which are indicated on the cov• of each report.
Printed by
SMEETS
Brussels, November 1968This document was reproduced on the bu. of
the best
available copy.t·
,.
'
.,
'I
EUROPEAN ATOMIC ENERGY COMMUNITY - EURATOM
FUEL MANAGEMENTS FOR AN ORGEL PROTOTYPE
ORIENTATION STUDY
by
B. CHAMBAUD, J.C. CHARRAULT, A. DECRESSIN and P. TAUCH
1968
ORGEL Program
Joint Nuclear Research Center lspra Establishment - Italy
managements. All cases are normalized to plants of 250 MW e gross. Three managements are con5idered : on-power refuelling with axial shuffling (MA), on~power refuelling with radial shuffling (MR), and off-power refueHing with batchwise shuffling (SR); moreover, the influence of variable fuel enrichment and radial reflector thickness is investigated. A first comparison in terms of fuel enrichment shows the predomi-nant economic position of the MA management under the hypothesis of fuel bum-up being limited only by the reactivity potential.
A second comparison envisages technological restrictions which limit the maximum local burn-up of the external rods in the fuel bundle. In this context a low burn-up region up to about 12.000 MWd/tU is dearly dominated by the MR management; in a transition zone up to about 20.000 MW d/ttU the MR and MA management are economically equivalent; above 20.000 MW d/tU maximum local burn-up the MA management is more attractive.
ORGEL REACTOR ECONOMICS POWER FUEL CYCLE FUELS
KEYWORDS
1. INTRODUCTION
2. REACTOR PHYSICS
2.1. Basis of nuclear calculations
2.2. Discussion of the results
3.
THERMAL PERFORMANCES OF THE REACTORS3.1. Method of calculation
3.2. MA management
3.3.
Radial managements4.
POWER OF THE DIFFERENT PLANTS5.
COST EVALUATION5.1.
Direct costs of construction5.2.
Indirect costs of construction5 .3.
Fixed costs of plant investment5.4.
Fuel cycle costs5.5.
Operation and maintenance costs6.
ELECTRICITY GENERATING COST NORMALIZATION7. GLOBAL RESULTS
8. References
Annexes 1 and 2
Figures 1 6 6 7 10 10 10 12
13
14
14
15
16
16
17
18
19
2122 and 23
1. IN'1'RODUCTION
Early in
1967,
the Commission invited European Communityindustries to submit offers for a prototype plant with a gross
electric power output of 250 MWe, equipped with an ORGEL
(organic-cooled-heavy water moderated) reactor.
The possibility was given to the industrials to base their
reactor conceptual choices on the results of theoretical works
-parametric, dimensioning and optimization studies - carried out
by the ORGEL project in the perspective of reactors for a future
string.
Being advisable, in elaborating a prototype concept, to call
on the main characteristics of the string, it is nonetheless necessary
to consider a context peculiar to this prototype
- The installed power, at least two times lower than that of
a string reactor,
- The present status of the technology,
- And, more generally, the wish to build low-cost and reliable
equipment.
It is why, as regards the fuel management, we have planned
to establish a comparison with three clearly distinct fuel management
systems, in order to support the industrials studying the ORGEL
pro-totype in the choice of the best compromise solution. Not only the
neutronic aspect of the problem had to be considered, but also the
reactor thermal and the plant thermodynamic performances, as well
as the cost of investment •
The comparison criterion to be retained finally is the total
cost of the energy produced. Particular attention had to be given to
fuel element behaviour and, for that matter, the maximum local
burn-up rate as well as the in-pile residence time have been considered
The fuel management systems which have been confronted in
this study are :
NOTE
- The bidirectional management, which is the reference
solu-tion of ORGEL string reactors (principle used in the case
of NPD, DOUGLAS POINT, EL-~, KKN, for example). The fuel
is submitted to axial shuffling only. In each channel, one
element occupies 5 successive positions from one end to
another, the shuffling direction being opposed from one
channel to the adjacent channels. In this management, fuel
handlings take place with the reactor on-power. The sign
MA
(t!_anagement !Xial) will be used in the course of this document
when referring to this management.
- A fuel management system with fuel handlings at reactor shut-down; i t corresponds to the present status of the technology, inasmuch as the heavy water-organic test
reac-tors WR-1 and ESSOR are being loaded in this manner. Jn the
selected management, the fuel element is submitted to radial
shuffling only and occupies successively J channels in J
concentric reactor zones. The elements are moved as follows
those of the peripheral zone are transferred batch-wise in
the intermediary zone, then, at the next move, batch-wise in
the central zone of the core. In the course of this document,
this management will be referred to as SR (~hut-down Radial).
- Finally, an intermediary solution between both preceeding
manage-ments~ fuel handlings are carried out with the reactor on-power;
the fuel element is submitted to radial shuffling only. Like in SR
management, it occupies successively J channels located in J
concentric zones, but fuel transfers are carried out progressively
in time and not by batch. The MR (~anagement ~adial) sign will
refer to this management in the course of this document.
Comparison principles
Besides the nature of the fuel management, two adjustable
parameters have been considered
The relative fuel enrichment, y,varying between 1,3 and 2,2 1235
I
times the naturel
U
content,- The thickness of the radial reflector,
JR,
varying between25 and 50 cm.
The comparison was carried out in accordance with the following
scheme :
By varying the refuelling management, the fuel enrichment and
the radial reflector thickness, one has calculated :
- The neutronic and thermal performances of the reactor, the
other characteristics of which were maintained unchanged
(total fission power included).
- The performances of the associated steam cycles, by maintaining,
from one case to another, the pinch points.
Then, for each plant one has determined the costs of energy
produced. The comparison could have been carried out from this stage;
however, i t would have covered plants with powers dispersed between
245 and 270 MWe, thereby attenuating or amplifiying certain differences.
Therefore, the costs of energy produced have been further adjusted for
plants yielding the same electrical output : 250 MWe gross. Then, one
has compared the results thus obtained by representing them, for each
reactor family, characterized by the fuel management and the radial
reflector thickness, firstly in terms of relative fuel enrichment and
secondly in terms of maximum local burn-up of fuel rods. The first
comparison assesses the economical position of each management under
the hypothesis of a fuel burn-up being limited only by the reactivity
potential , whereas the second one envisages technological restrictions
Consequently, depending on the grade of confidence the industrials
would show to the maximum burn-up, they would choose a project value in
regard of which they would find the cost of energy produced by the plant
of each reactor family delivering this burn-up. The comparison between
the generating costs would then have a homogeneous base. (The other
charac-teristics that can be included in the choice: fuel enrichment and in-pile
residence time, are quoted separately).
Bases
The fixed characteristics of the above-mentioned plant (first
part) are listed below•; only the main ones are given here :
Reactor
Number of channels
Core height
Core radius
Axial reflector thickness
Thermal power
Fission power
Control rods
Thermodynamical_cycle
Pinch point at evaporator inlet
Pinch point at superheater outlet
216
400 cm
200 cm
JO
cm707 MW
752 MW
extracted
As regards the fuel element, the choice was made on the 18
rod-UC/He/SAP-bundle having a Zr-2 central rod serving as axial structure.
In all cases, a channel is filled with 5 bundles (see Annex 1).
The diameter of the UC rods, the coolant flow section and the moderation
ratio of the cell (moderator section/fuel section) have been fixed to
values which, without setting particular fabrication or behaviour problems,
should place the reactor in the field of intrinsic stability •
•
Further details of the plant referred to are described as plant C in the report "Options for a 250 MWe ORGEL Prototype plant;orientation study"
(Although this document does not aim at discussing these options, it has
appeared useful to briefly report their motivations).
Finally, in calculating the performances, on~ has limited to
425°c
the nominal temperature of the SAP sheathing and to 10 m/s the coolant flow in the channels. In this context, nominal means that thetemperature has been calculated with the THESEE 1 code (Ref. 1),
ex-cluding the flux peakings at element ends and the effect of various
2. REACTOR PHYSICS
2.1. Basis of the nuclear calculations
In order to assess the advantages and disadvantages of various
refuelling schemes against each other, it is necessary that the
nuclear calculations determine as well the burn-ups as the power
distributions.
The burn-ups of the bidirectional management (MA) have been
calculated by means of the depletion code RLT (Ref. 2). Herein, the
burn-up equations are solved in function of the flux time. On the
basis of an axial cosine flux shape, the local thermal cell
para-meters are calculated according to the fuel composition evoluting
with irradiation. The epithermal cell parameters are assumed to
remain constant during irradiation. The effective buckling is found
in applying the perturbation method by weighting the local bucklings
with their statistical weights.
The assumption of ·a cosine flux distribution along the channel
axis is acceptable for the bidirectional refuelling scheme (MA).
For the radial flux, a flat distribution within an inner
zone is needed in order to optimize the bidirectional refuelling
scheme. The flattening is obtained by adjusting the burn-ups of
the zones according to their different radial bucklings.
The buckling of the inner zone is zero by definition; that
of the outer zone has analytically been derived from a one energy
group diffusion model dealing with two zones. The reflector zone
has been taken into account by its saving.
The managements SR and MR are calculated with the code
ERUPT (Ref.
J).
This code, which is able to study the burn-up history beginning with the start-up core and ending with theequilibrium cycle, contains a coupling of the first part of RLT
and the code EQUIPOISE (Ref.
4).
The part of RLT gives the evolu-tion of the £uel composievolu-tion with.the time integrated flux. Withdirection at each time step. Nine radial and twenty axial zones of
various burn-up states can be distinguished.
The EQUIPOISE code calculated the flux distripution for a
homo-geneous reactor. The heterogeneity effects of the nuclear cell are taken
into account in the calculation of the homogeneous group constants. As
the epithermal constants are assumed to remain unaffected during irradiation
only the variation of the thermal flux depression with irradiation is
considered.
A refuelling is always executed in the moment when the reactivity of the core reaches a prescribed limit. For all managements ~ompared,
this limit was set to
fl
K = 0,017. The reactivity reserved is partlyneeded to compensate absorptions by structure materials (fuel element
end plates) and partly for control purposes.
In the SR management, at each refuelling stage the inner zone is
discharged and the fuel of the other zones is loaded in the adjacent
zone next to the center. Fresh fuel is always charged to the outer zone.
The MR management can be calculated by the ERUPT code only in a
rough approximation. Because of the fact that the code is restricted to
problems with azimuthal symmetry, the irradiation history of a single
element cannot be pursued, but only that of concentric homogeneous zones
of the core. Therefore, at each refuelling step, concentric annuli
con-sisting of several elements are moved.
Calculations perform~d later for the ORGEL Prototype core as
defined by the industrial group with the ERUPT code and the
tridimen-sional REFLOS code on the MR cycle, showed a satisfactory agreement in
the results of the two methods,
2. Discussion of the results
In Fig. 1, a typical evolution of the concentrations of the
main fissile'and fertile isotopes is given in function of the burn-up
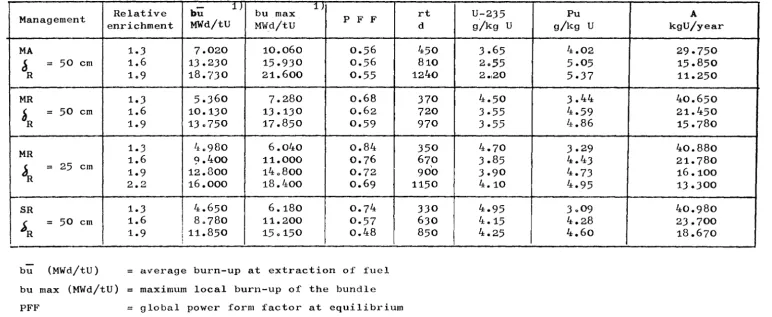
The results (average and max. burn-ups, power form factors•,
re-sidence times, etc.) of the various fuel managements reported in Table 1
are values found for the equilibrium core. The equilibrium state has
been reached when the burn-up of the discharged fuel does not change
anymore in successive refuelling steps.
Fig. 2 shows the variation of Keff and mean burn-up with time
of a core the fuel of which is managed according to the SR scheme.
Initially, it is uniformly charged with fuel of an enrichment
1.3 x Unat" The steep slopes in the Keff curve at the beginning of
a fresh fuel irradiation are due to Xenon poisoning effects. After
about 270 days of irradiation, the core reaches the limit of reactivity
set at AK= 0,017. Then the inner zone (one third of the reactor) is
discharged, the other two zones are moved in the zones closer to the
center and the outer zone is loaded with fresh fuel (enrichment 1.3 x U t). na
The volume averaged burn-up of the first discharged fuel amounts
to about 3900 MWD/TU. (In the case that the whole core would have been
discharged - batch cycle - a mean burn-up of 3700 MWD/TU would have been
attained). The SR management reaches after about two years its equilibrium
with a mean burn-up of
4650
MWD/TU. The lowest power form factor between two refuelling stages in the equilibrium state is0,74,
the lowest form factor for the uniformly enriched start-up core being 0.49.Since it is economic to design the core for the equilibrium state,
the difference in form factors between sta~t-up core and equilibrium core
means that, in the initial period, the reactor delivers less than nominal
power.••
The advantages of the SR refuelling scheme in comparison with
the corresponding batch one are evident. The mean burn-up in the cited
case is by about 25% and the minimum power form factor by about 50% higher
than in the batch cycle.
*
The power form factor (PFF) is the product of the axial form factor, the radial form factor and the bundle form factor.
For these advantages, a higher shutdown time for refuelling
operations has to be paid, thus penalizing slightly the availability
of the plant.
Fig. J shows the axially integrated flux distributions in the SR
management for various fuel enrichments. For an enrichment of 1.3 x U na t '
a rather flat flux distribution is obtained. With increasing enrichment,
there exists a marked difference in the nuclear properties between the
depleted fuel in the center of the core and the fresh fuel charged at
core edge. This leads to the decrease of the power form factor with
in-creasing enrichment, as shown in Table 1. The same trend is seen also for
the MR management, whereas the power form factors of the MA management
remain nearly constant because of the flux flattening in the reactor
center.
A smaller reflector thickness improves the form factors as can be seen comparing, in Table 1, the MR management, calculated once with
a thickness of 50 cm and once with a thickness of 25 cm. But the gain in
form factor has to be paid by a loss in burn-up. The conversion in costs
of all the effects which accompany a variation in reflector thickness
J.
THERMAL PERFORMANCES OF THE REACTORSJ.1. Method of calculation
At
reactor level, the calculation is based on the coolantchannel, the thermohydraulic performances of which are determined
by the code THESEE (Ref. 1). Once the fuel element being chosen,
the fuel bundle is divided in ax_ial zones and the zones again in
sub-channels, the latters being confined artificially by the
cons-trictions of fluid streams and connected together by mass transfer
(mixing).
The average coolant velocity being given, the local velocity
in the sub-channels is determined as to assure a constant total
pressure drop over a given height of the zoneo Then the thermal
balance of the bundle is made-up taking into account the mixing
of the different fluid streams. The local cladding temperature
of each sub-channel as defined in THESEE 1 is calculated from its
average heat transfer coefficient and from its average heat flux.
The step from the channel performances to those of the
reactor is done in supposing the maximum nominal cladding
tempe-rature being the same for all channels. In order to satisfy this
condition, a regulation device for the coolant flow at each channel
is necessary.
The important differences among the axial distribution of
power generation of the channels for the envisaged fuel managements
has brought us to deal with the problem at reactor level in two
different ways.
J.2. MA management
This management is characterized by an axial form of power
generation being identical for all channels of the reactor. As a
consequence, i t is sufficient to calculate the performances of the
most charged channel as the temperature profiles are practically
Thermohydraulic performances. of the most charged channel ••
Suppose : WR
=
NC
=
PFF =L
=
n
=
q/4
lr
=
thermal power of the reactor
number of channels
overall power form factor of the reactor
effective length of fuel
number of rods in the bundle
linear heat rating
The maximum linear heat rating is defined such that
WR = L • n • N C • PFF • ( q/
4
7r )
max.4
7r ( •)
- Calculation_hypothesis
The average inlet coolant velocity in the most charged
channel is fixed at 10 m/s. The maximum cladding temperature
(without hot spots) is taken as
420°c.
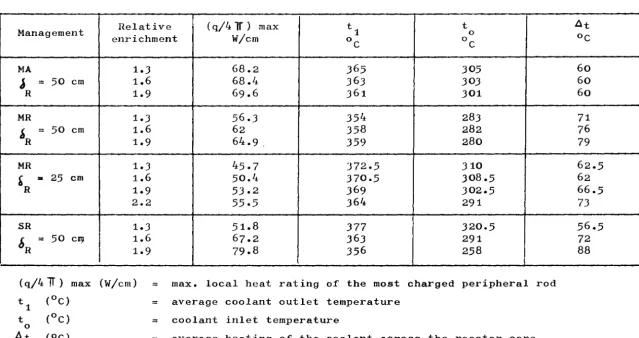
- Results
••
Fuel enrichment being without significant influence on
the overall power form factor of the reactor, the heat rating
remains sensibly constant (Table 2).
For .a relative enrichment of y = 1,6, the influence of the
direction of fuel shuffling with respect to the direction of
coolant flow has been investigated. The maximum cladding
tempe-rature is found to be about
5°c
higher for opposite circulationthan for parallel one. As a consequence, the coolant inlet
tempe-rature is determined on the basis of the "opposite circulation" in
order to guarantee the maximum cladding temperature tgm =
420°c •
Cooled by OM2 containing
5%
HB (purified by distillation)• As the reactor thermal power is kept constant for a reactor
core of given dimensions, one has :
J.J.
Radlal managements (MR and SR)The reactor core is subdivided into 9 zones having the
same volume each1 for all zones, the axial form of power
gene-ration is calculated at the moment just before fuel extraction
(see chapter 2.2.); indeed, i t may be supposed that the extraction
of fuel from one channel does not sensibly affect the general form
of power generation at reactor level. This variation will be
accoun-ted for in calculating the hot channel factors.
All channels of one zone are supposed to release the same
power. The general hypothesis concerning coolant velocity and
cladding temperature are the same as for the bidirectional
manage-ment.
- Channel_performances
The thermal performances of one channel of the most charged
zone are calculated in the same way as for the bidirectional
management.
The limitations are constituted by cladding temperature and
coolant velocity, the principal result of calculation being the
coolant inlet temperature. For all other channels, the coolant
inlet velocity is calculated starting from the limitation set by
cladding temperature and coolant inlet temperature determined for
the most charged channel. Then the thermohydraulic performances
of these channels may be determined and thus also of the zones.
- Reactor_performances
From the calculated performances of each zone of the core,
the reactor outlet temperature and the mass flow are established
4. POWER OF THE DIFFERENT PLANTS
Basic assumptions of this report are the constant thermal and
the constant fission power of the plant to be generated in a core of
fixed dimensions. Moreover, the core is calculated as to yield, in all
channels, the maximum permissible fuel cladding temperature and, for
the most charged channel, the maximum mean coolant velocity at the
entrance of i t . The maximum linear heat rating and the power form factors
being different for each plant, it is obvious that the thermal
perfor-mances of the core vary (coolant inlet and outlet temperature, coolant
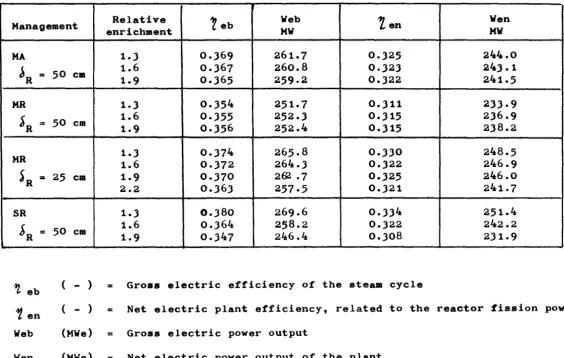
heating across the core). Hence, the thermodynamic efficiencies of the
associated steam cycles differ from each other resulting in gross
electric power output between
246
and270
MWeoThe steam cycle adopted is a classical one with superheat and
reheat by the primary coolant and feedwater heating by extraction
steam. The thermodynamic efficiency of such steam cycles has,been
evaluated under EURATOM contract, in a range of primary coolant
temperatures and steam pressures being typical for an ORGEL power
plant.
The pinch point at evaporator inlet of the steam generator was
found to yield the optimum cycle efficiency between
20
andJ0°C;
avalue of
20°c
was adopted. Superheater and reheater are arranged inparallel, the pinch points at the outlet being fixed at
10°c.
The low-pressure stages of the turbine are equipped with grooved
blades for decreasing the exhaust steam wetness at 10%; condenser
remembered that not the absolute level of costs is of importance, but
the relative position of the fuel managements among themselves.
With this aim in view, i t was p·ossible to refer to a cost
eva-luation carried out in 1962/1963 in the frame of a 250 MWe Design
Study Contract for an ORGEL power plant by the firms
BELGONUCLEAIRE-INDATOM-SIEMENS (Ref.
5).
The cost estimates established under this ~ontract were based
on the state of technological development in 1962 and had the aim of
ascertaining the investment costs for both a 250 MWe gross ORGEL
proto-type and an already industrially mature ORGEL power plant of 250 MWe
gross (t~te de fili~re). The estimates made hereunder refer to the
ORGEL plant 11t~te de fili~re11 •
5.1. Direct cost of construction
The direct plant investment was calculated by adjusting
the results of the above-mentioned Design Study Contract. In order
to escalate these 1962 cost figures to 1966 figures, a rate of
2,4% per year was assumed, totalling a 10% escalation in 4 years.
The direct construction costs include the reactor, its
primary circuits, fuel handling devices, steam generators, D 2
o-moderator and organic coolant, but not the first charge of fueland fuel reserve. In addition, they include the site clearance and
construction work, auxiliary work, turbogenerator unit, electrical
equipment, main step-up transformers. The land is not included.
Heavy water is estimated a t $ 20/lb.
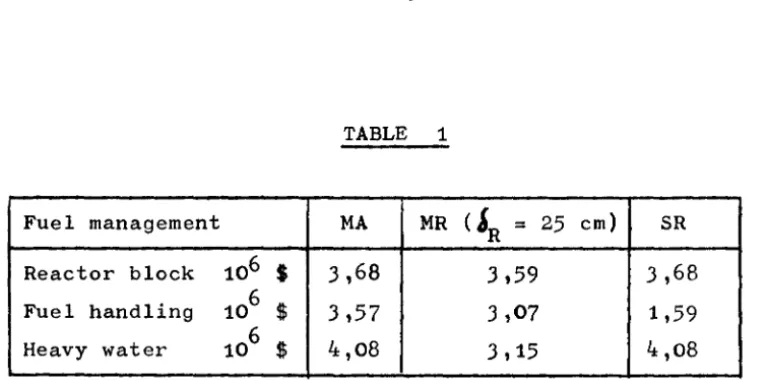
Certain cost components vary from one fuel management to
another. Table 1 gives the most significant changes in direct
TABLE 1
Fuel management MA
MR
(~R = 25 cm) SRReactor block 106 $ 3,68 3,59 J,68
Fuel handling 106 $ J,57 3,07 1,59
Heavy water 106 $ 4,08 3,15 4,08
The cost variations for the reactor block and the heavy
water are due to a change in radial reflector thickness from
!R = 50 cm (for MA and SR) to
JR
= 25 cm (for MR). Fuel handlingdevices will be less complicated for an off-power refuelling
management (SR) than for on-power refuelling (MA and MR).
The power plants will differ one from another in net power
output due to slight changes in operating temperatures.
Thus, the cost of the secondary installations which are
mainly a function of the installed electric power, vary also
(between 1J,82 and 1J,05 million$).
5.2. Indirect costs of construction
These costs are calculated as percentage of the direct
costs of construction. They include engineering
(6%),
overheads and administrative costs (6%), interest during construction (12%),contingencies and possible price increases t i l l putting in
ope-ration (10%), miscellaneous (1%).
The percentages adopted here (J5% in total) are based on
the results of the Symposium on Technical and Economical Problems
for Proven-Type Reactors held in Venice, October 1963.
Taxes on capital and return on capital during construction
are not included in view of the fact that their volume, which
depends on the tax system applicable in the country where
[image:21.716.77.462.107.299.2]5.3.
Fixed costs of plant investmentThe fixed costs due to plant investments (annual
interest on money, amortization and taxes on revenues.
The total annual instalment rates vary considerably in the
of the European Community, between 8,1% (France), 10% (Italy, the
Nether-lands), and 13% (Belgium, Germany). In this economic evaluation, a rate
of "t" = 10% is adopted for annual instalment.
Interest rates are in general between
5,5
and7% •
.Amortization rates are based on estimated plant lifetime between 20 andJO
years for proven-type reactors; in Germany and The Netherlands, plant lifetimeis shorter for fiscal reasons. Thus, the amortization rates in the
Community are related to plant lifetimes between 15 and
JO
years. Taxes on revenues also differ considerably, ranging from exemption (France,The Netherlands) to
J-4
per year on the revenues (Belgium, Ger•'1ly).The annual plant load factor is taken as 0,8 equal to 7000 h of
full load operation per year for the plants having fuel managements with
on-power refuelling (managements
MA·
and MR). In the case of off-powerrefuelling (management SR), the load factor will decrease the more the
shorter the in-core residence time of the fuel elements, i.e. as a
function of the number of refuelling operations per year.
5.4.
Fuel cycle costsFuel costs
The costs of the enriched UF
6 are taken from the USAEC price list dated July 1962. Conversion costs for converting UF
6 into UC rods ready for cladding amount to 40 $/kg
u,
costs of finned SAP sheaths to 5 $/kgu.
The costs of cladding, assembly and inspection are 14 I/kgu.
Then, thetotal costs of fresh fuel elements will be 100 $/kg U, 120 $/kg U, 140 $/kg
160 $/kg
u,
respectively for relative enrichments of 1.3, 1.6, 1.9 andFuel_cycle_cos~s
The calculations were made for the reactor being at equilibrium.
In computing the fixed costs of the fuel cycle, the half first-charge
costs are amortized over the whole plant lifetime·. The interest rate
on spare fuel (equal to 10% of a core) is 6%. Annual instalment rate and
plant load factor are the same as described under 5.3.
The variable costs -of the fuel cycle (fuel consumption costs) are
calculated with and without Pu-recovery. Only the extracted Pu-isotopes
are credited at 8 $/g Pu of all isotopic composition, the residual
U-235 is not considered. Reprocessing and transportation Gosts are
estimated at 21 $/kg U.
,5. Operation and maintenance costs
These costs include only organic make-up costs and
n
2
o
losses. All other costs for operation, maintenance and insurance are omittedbe-cause of their dependence on local conditions and the operation
stra-tegy of the plant owner.
Organic coolant make-up costs are calculated for an equilibrium
content of 5% HB• to be maintained by distillation. Cost of fresh
coolant is O,J $/kg.
From operating experiences with other D
20-moderated and-cooled reactors, one may reasonably assure yearly D20 losses of about 0,5% of total inventory for the D
20-moderated ORGEL reactor, which is operated at small D
20 pressures only.
6.
ELECTRICITY GENER.I.TING COST NORMALIZATION TO PLANTS OF 250 MWe GROSSPOWER OUTPUT
In an early study, the power generating costs of ORGEL type
plants have been evaluated in the range of 100 to 1000 MWe gross.
These plants were quite similar in construction, only the fuel
ele-ment performances were assumed to be slightly higher for the larger
plants ( ~ 500 MWe gross). The fuel element was always the same.
Electricity generating cost showed to follow fairly well an
exponential law:
w
=
w0 (mill/kWh)
in the range of Web= 200 to 1000 MWe gross.
These generating costs are computed in the same way as
des-cribed in chapter 5 and contain the following cost elements:
- fixed costs due to direct and indirect plant investments;
- fixed costs of the fuel cycle
- costs of organic coolant make-up and
n
2o
losses.By arranging the cost elements of the plants with different
power output in the same way as in the above-mentioned early study,
this cost variation law may be applied to normalize all generating
costs to plants having 250 MWe gross output. Such a normalization
being performed in a small region around the nominal output of
250·MWe will give a fair approximation of production costs.
It is obvious that a normalized plant will no longer have the
same postul&ed fission power of 752 MW. At fixed mean maximum cladding
temperature of the fuel element and fixed maximum coolant entrance
velocity, the thermal performances of the core will slightly change
as to yield the thermal power necessary to produce 250 MWe gross.
Generally, the exact design parameters and performances of the
norma-lized plant have to be found by iteration, but, in this study with
maximum electric power deviations of
8%
the difference in net powerplant efficiency,
b
'len is only0,3% (0,335
for the normalized plantto be compared with O,JJ4 for the actual plant). So, the fission power
Wfo of the normalized
(Web0 - Wa)/,en' the
7.
GLOBAL
RESULTSThe first part of the comparisons is done under the hypothesis
that the fuel burn-up is limited only by the reactivity potential. As
a consequence, figures
4
and5
show quantitatively the 1act that, undercertain circumstances, energy generating costs can be cut down
substan-tially by a higher enrichment of fuel which increases the mean burn-up.
In the range of relative fuel enrichm·ent investigated, the
dif-ferences in power generating costs of the normalized plants are quite
large (0,5 to 0,8 mills/kWh), the
MA
fuel management yielding thelowest and the SR fuel management the highest costs (Fig.
4).
The sameresult shows up also in the case where reprocessing of the spent fuel
is envisaged (Fig.
5);
the absolute level of power generating costsbeing about 0,15 mills/kWh lower than without fuel reprocessing.
The surprisingly large gap between the
MA
and the MR fuelment can be explained, at least partially, by the fact that the MA
manage-ment has been studied thoroughly in the last years and refers to well
op-timized power plants, whereas much less effort is spent for the MR and
also for the SR management. Indeed, this orientation study was conducted
in choosing a well defined core (optimized for an
MA
management) and tosee which power can be extracted from that core in utilizing or an MR or
an SR fuel management without reoptimizing the core dimensions according
to the adopted fuel management. More detailed studies would probably
reduce the differences between the managements.
The mean burn-up attainable - being economically of great
impor-tance for the fuel cycle cost - is shown in Table 1 for each management
in function of the relative enrichment. Thus, for a given enrichment,
the mean burn-up of the investigated MR management is in general about
25% lower than for an MA management (at equal radial reflector thickness
of 50 cm). Upon reducini the reflector thickness of the MR management in
order to raise the global power form factor and to shorten the fuel in-core
residence time the mean burn-up attainable will be about JO% lower as
The second part of the comparisons investigates the economical
position of the different fuel managements, taking into account the
maximum local burn-up of the most charged rod in the fuel bundle.•
Such a comparison gives a better view on the potential of each
management in the case that a limitation is set by the maximum local
burn-up.
Plotting the power generating costs over the maximum local burn-up
(figures
6
and7),
it is obvious that the SR management is ruled out atonce against the MR one for its poor burn-up performances and for the
lower load factor due to off-power refuelling.
On the other hand, the MR management now competes excellently
with the MA scheme and yields even appreciably lower energy generating
costs at least in the region below about 12.000 MWd/TU.
In a transition zone situated between 12.000 to 20.000 MWd/TU,
the MR and MA management show about the same economical performances
with slight advantages for
MA
at higher burn-up.Finally, a third zone with maximum local burn-up in excess of
20.000 MWd/TU is clearly dominated by the
MA
management.Another feature of some interest, the in~core time of the fuel
elements, is also indicated in figures
6
and7.
In general, fuel managedaccording to a
MA
scheme has the shortest residence time in the core andthe MR management yields longest one at any maximum local burn-up
con-sidered here.
On the basis of this comparison and looking after figures
6
and7,
it seems that the MR management is adapted for a 250 MWepro-totype, burning enriched Uranium, the aimed burn-up of which being
re-latively low •
8.
REFERENCES
(1) THESEE 1 : Code de calcul des performances d'un canal de
r~acteur du type ORGEL.
B. Chambaud, P. Civardi, G. Di Cola, R. Di Cola
EUR-3905.f (1968)
(2) Variation de la r~activit~
!
long terme pour diff~rents types de circulation du combustibleG. Blaesser, G. Casini, J. Pillon
EUR-129 f (1962)
(1)
ERUPT: A two-dimensional two energy group fuel management program for the IBM-360 computer.W. Boettcher, A. Decressin, F. Lafontaine
EUR •••o (to be pubHshed) (1968)
(4) EQUIPOISE-3 : A two-dimensional two-groups neutron diffusion
code for the IBM 7090 computer
I.B. Fowler, M.L. Tobias - ORNL-3199
(5) ORGEL Reference Design (Contract 042-62-1 ORG C)
ANNEX 1
GEOMETRICAL CHARACTERISTICS OF THE REACTOR UNIT CELL
Unit cell
Lattice pitch (square)
Ratio of moderator to fuel volume
Coolant channel inner diameter
Fuel element
Number of elements per channel
Number of rods per element
Overall length of the element
Length of fuel core
Diameter of the UC fuel pins
Carbon content in UC (wt.%)
Cladding material
Cladding material thickness (between fins)
Height of fins
Finning ratio
Fuel cross section
Cladding cross section
Coolant cross section
Ratio of coolant to fuel cross section
24,2
cm9
11,0
cm5
18
Bo
cm75,5
cm1,830
cm4,9
%
SAP
0,0915
cm0,075
cm1,75
-47,34
cm2
214,1
cm2 J 111 cm
-ANNEX 2
CLADDING TEMPERATURES FOR MA MANAGEMENT IN ANY TWO CHANNELS
Suppose
w
1 and
w
2 the power generated in any two channels of the reactor; under the hypothesis of equal heating of the coolantin all channels, the mean coolant velocity Vis directly proportional
to the power generated :
In this case, the cladding temperature
the channel is equal to
.
.
tg 1
=
t + A W1w
10
v1 + B V10,9
tg2
=
t + A w2 w20
v2 + B V20,9
ior the channels 1 and 2 respectively, where
t = coolant inlet temperature
0
A,B= constants
(1)
at a given point of
(2)
The last term represents the temperature difference between
wall and fluid which is inversely proportional to the heat transicr
coefficient, then to
v
0 ,9•In combining equations (1) and (2), one gets
= t g
1 + B _w_2 __
v
20,9
Nu~erical example
Taking an extreme case of the power of the least charged
channel being only
65%
of the most charged one, and consideringw
a maximum temperature difference B 2
8o
0c,
one gets :v
20,9 =
tgm
2 = tgm1 -
J,5
(
0
c)
Thus, in first approximation, the cladding temperature
Management
enrichment MWd/tU MWd/tU P F F d gfkg
u
MA 1.3 7.020 10.060 0.56 450 3.65
J
=
50 cm 1.6 13. 2.30 15 .930 0.56 810 2o55R 1o9 18.730 21.600 0.55 1240 2.,20
MR 1.3 5.360 7.280 o.68 .370 4.50
bR
=
50 cm 1.6 1.9 10.1.30 13 0 750 1J .130 17.850 0.62 0.59 970 720 3.55 3.55MR 1.J 110980 6.040 o.84 350 4.70
=
25 cm 1.6 9.400 11.000 0.76 670 J .85JR 1.9 12.800 14-0800 0.72 900 ' 3.90
2.2 16.000 18.400 0.69 1150 4.10
SR 1.3 4.650 6.180 0.74 .330 4.95
SR
=
50 cm1.6 8.780 11.200 0.57 630 4.15
1.9 I 11.850 150150 o.48 850
I
4.25l
bu (MWd/tU) = average burn-up at extraction of fuel
bu max (MWd/tU) = maximum local burn-up of the bundle
PFF = global power form factor at equilibrium
U-235 (g/kg U) = final concentration of' U-235 at fuel extraction
Pu (g/kg U) = total Pu concentration at fuel extraction (all isotopes)
A (kgU/year) = average Uranium throughput/year
l)calculated at 200 MeV/fission
g/kg
u
4.02 5.05 5 • .37
3.44 4.59 4.86 3 .29 4.43 4.73 4.95
.3 .09 4.28 4.60 kgU/year 29.750 15 .850 11.250 40.650 21.450 15. 780 40.880 21.780 16.100 13 .JOO
40.980 23.700 18.670
I\)
[image:31.886.23.796.90.407.2]MA
J
=
50 cmR
MR
~R
=
50 cmMR
'
R • 25 cm SR6R
=
50 Cl:9(q/4
1f)
maxt1 (oC)
t (oC)
0
L\t (OC)
enrichment W/cm oC oC
1.J 68.2 365 J05
1.6 68.4 363 JO)
1.9 69.6 361 301
1.3 56.3 354 283
1.6 62 358 282
1.9 64.9 . 359 280
1.3 45.7 372.5 310
1.6 50.4 370.5 308.5
1.9 53.2 369 302.5
2.2 55.5 364 291
1.3 51.8 377 320.5
1.6 67.2 363 291
1.9 79.8 356 258
(W/cm)
=
max. local heat rating of the most charged peripheral rod=
average coolant outlet temperature= coolant inlet temperature
= average heating of the coolant across the reactor core
[image:32.887.76.715.270.608.2]Management
MA
~R
=
50
cmMR
iR =
50
cmMR
)R =
25
cmSR
bR
=
50
cm·'I.
eb (-
)"/, en (
-
)Web (MWe)
Wen (MWe)
Relative
1
eb Web !en Wen
enrichment MW MW
1.3
0.369
261.7
O.J25
244.o
1.6
O.J67
260.8
O.J23
243.1
1.9
0.365
259.2
0.322
241.5
1.3
0.354
251. 7
0.311
233.9
1.6
O.J55
252.3
0.315
236.9
1.9
0.356
252.4
O.J15
238.2
1.J
0.374
265.8
0.330
248.5
1.6
0.372
264.3
0.322
246.9
1.9
0.370
262 .7
0.325
246.o
2.2
0.363
257.5
0.321
241.7
1.3
0.380
269.6
0.334
251.4
1.6
0.364
258.2
O.J22
242.2
1.9
0.347
246.4
0.308
231.9
= Gross electric efficiency of the steam cycle
=
Net electric plant efficiency, related to the reactor fission power=
Gross electric power output= Net electric power output of the plant
I\)
[image:33.876.133.697.108.466.2]6.0
10000
rt
BE-frtttE-!~fi±l:±+E'b.:!:f-:f.+::H(d)
0
'i
22
1.6
500
0
y
2.2
and Documentation (CID). For subsq:iption (1 year: US$ 15, I 63) or free specimen copies please write to :
Handelsblatt GmbH "Euratom Information" Postfach 1102
D-4 Diisseldorf (Germany)
or
Office central de vente des publications des Communautes europeennes 2, Place de Metz Luxembourg
To disseminate knowledge is to disseminate prosperity - I mean
general prosperity and not individual riches - and with prosperity
disappears the greater part of the evil which is our heritage from
All Euratom reports are on sale at the offices listed below, at the prices given on the back of the front cover (when ordering, specify clearly the EUR number and the title of the report, which are shown on the front cover).
OFFICE CENTRAL DE VENTE DES PUBLICATIONS
DES COMMUNAUTES EUROPEENNES
2, place de Metz, Luxembourg (Compte cheque postal No 191-90)
BELGIQUE - BELGiit
MONITEUR BELGE
40-42, rue de Louvain - Bruxelles BELGISCH STAATSBLAD Leuvenseweg 40-42, - Brussel
DEUTSCHLAND
BUNDESANZEIGER Postfach - Kelln 1
FRANCE
SERVICE DE VENTE EN FRANCE
DES PUBLICATIONS DES COMMUNAUTES EUROPEENNES 26, rue Desaix - Paris 15•
ITALIA
LIBRERIA DELLO STATO Piazza G. Verdi, 10 - Roma
LUXEMBOURG
OFFICE CENTRAL DE VENTE DES PUBLICATIONS DES COMMUNAUTES EUROPEENNES 9, rue Goethe - Luxembourg
NEDERLAND
STAATSDRUKKERIJ
Christoffel Plantijnstraat - Den Haag
UNITED KINGDOM
H. M. STATIONERY OFFICE
P. 0. Box 569 - London S.E.l
EURA TOM-C.I.D. 51-53, rue Belliard Bruxelles (Belgique)