http://dx.doi.org/10.4236/gep.2016.47006
How to cite this paper: Wang, H., Yao, J.L. and Li, Y.Q. (2016) An Analysis of Water Environment Factors and an Evaluation of Water Quantity of Liangzi Lake. Journal of Geoscience and Environment Protection, 4, 44-51.
http://dx.doi.org/10.4236/gep.2016.47006
An Analysis of Water Environment Factors
and an Evaluation of Water Quantity of
Liangzi Lake
Hong Wang
1,2, Junlan Yao
1*, Yanqiang Li
11Faculty of Resource and Environmental Science, Hubei University, Wuhan, China
2Hubei Key Laboratory of Regional Development and Environmental Response, Wuhan, China
Received 8 June 2016; accepted 18 July 2016; published 21 July 2016
Abstract
The experiments of single factor evaluation method, principal component analysis and voronoi area weighting factor method on the sample data of Liangzi Lake in October 2012 combined with the national surface water environment quality standards can get the map of comprehensive wa-ter quality distribution by Kriging inwa-terpolation. The analysis shows, the grades of comprehensive water quality gained by three methods are all only class III or class IV, and the quality of water is different from east and west that the water quality of east is better. However, the percent of IV class water is higher in the result of single factor evaluation method means class IV is the main grade of water quality. The result of principal component analysis shows the percent of class Ⅲ
water is higher than other classes. The result of voronoi area weighting factor method shows the percent of IV class is higher than other classes. CODMn is the main factor that influences the method
of singal factor evaluation and reduces the grade of water quality overall. The effect of single fac-tor is reduced by principal component analysis, and the analysis on water quality is more accurate. The voronoi area weighing factor method reduces the effect of single factor and extends the con-tent, can make a comprehensive evaluation on water quality.
Keywords
Factor Analysis, PCA, Voronoi, Area Weighting Method, Water Quality Assessment
1. Introduction
Water is the important environmental factor for the survival of people. The comprehensive evaluation on water quality is an important fundamental work to the treatment of water environment. Only evaluating the monitoring data of water quality reasonable can formulate scientific renovation plan and take effective measures. Nowadays the common methods to water quality evaluation contains single factor evaluation method, principal component analysis, fuzzy comprehensive evaluation method, grey evaluation method, matter element analysis method and so on [1]-[3].
Paper comprehensive evaluates the water quality of Liangzi Lake by three methods with the sample data in October 2012. Ammonia nitrogen, total nitrogen, total phosphorus, permanganate and dissolved oxygen are se-lected as the water quality factors. Five factors are operated with kriging interpolation in single factor evaluation method, and then the evaluation of water quality can be gained by overlaying the distribution maps of five fac-tors. The main factor to water quality is extracted by principal component analysis and then the synthetic evalu-ation function is extracted. Calculating the data of comprehensive water quality by synthetic evaluevalu-ation function and kriging interpolating the comprehensive water data of sample point can get the result of water quality evalu-ation. The voronoi area weighting factor method creating voronoi from sample data first, and then calculates the grade of water quality by single factor analysis and area weighted method; the result of water quality evaluation is gained by overlay analysis.
2. Study Area
Liangzi Lake is the second largest fresh water lake in Hubei province. It locates in the southeast of Hubei prov-ince, south bank of middle reaches of Yangtze River. It crosses Wuhan and Ezhou, spreads from north latitude 30˚04' to 30˚20' and east longitude 114˚31' to 114˚42'. The average water depth of the lake is 2.51 m. The exist-ing water area of the lake is about 225 km2 andthe river basin area is about 2083 km2. Liangzi Lake is the core area of the Wuhan city circle according to its unique natural ecological environment and special geographic lo-cation. It has important function in draining flood control, industrial and agricultural production, ecological en-vironmental protection, and so on [4].
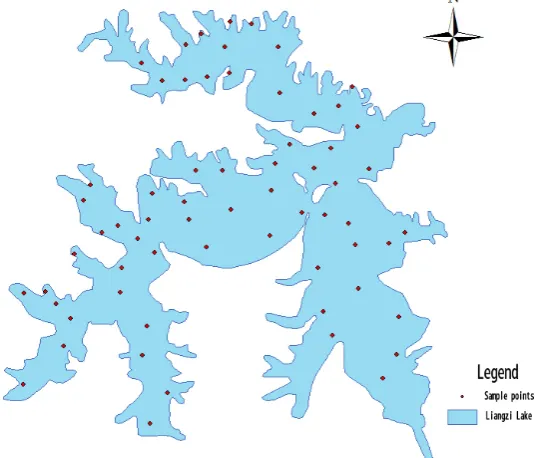
Water quality sample data statistics of Liangzi Lake was made in October of 2012. It was required that at least 40 sampling points uniformly distributed on the lake surface should be covered. Based on the hydrological cha-racteristics of Liangzi Lake, 64 sampling points are designated, of which the distribution is as shown in Figure 1. Water quality evaluation is performed in line with the Environmental Quality Standards for Surface Water, so that the water of Liangzi Lake is grouped into five classes by the quality, namely Class I, Class II, Class III, Class IV, and Class V [5].
3. Results and Analysis
3.1. Water Quality Evaluation Based on Single Factor Analysis
[image:2.595.182.450.469.698.2]Single factor water quality evaluation refers to grading each single water quality factor based on the standard
content value of underground water, and determining the water quality grade of the factor which is most serious polluted as the overall water quality grade on this basis. Single factor evaluation is to compare the representative parameter values of concentration against the evaluation criteria one by one, and determine the lowest grade among the items as the total water quality grade [6]. Besides, spatial interpolation is carried out to single water quality factors to analyze the temporal and spatial changes and distribution characteristics of water quality fac-tors.
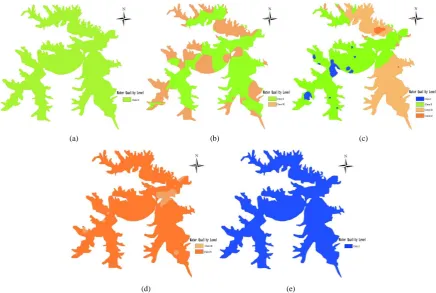
Firstly, five water quality factors are selected for single factor analysis, including ammonia nitrogen, total ammonia, total phosphorus, permanganate index, and dissolved oxygen. Then, ArcGIS software is employed to perform kriging interpolation. The respective grading results of water quality obtained in the two procedures are as shown in Figure 2.
According to Figure 2(a), the water quality of Liangzi Lake is graded as Class II by single factor analysis of 4
NH -N+ . The content of NH -N4+ all over the lake is within a reasonable range. The water quality of Liangzi Lake is graded as Class II and Class III by single factor analysis of TN, in which Class II water accounted for 44.4% and Class III for 55.6%. Class II water is slightly more than Class III water. According to Figure 2(b), TN factor mainly existed in the entrance of the lake near land. This indicates that there are pollution-producing facilities around the lake, which resulted in increase of TN content, and is liable to cause eutrophication. The water quality of Liangzi Lake is graded as Class I, Class II, Class III and Class IV by single factor analysis of TP, in which Class I accounted for 1.6%, Class II for 61.0%, Class III for 36.9%, and Class IV for 0.5%. Class II water dominated. According to Figure 2(c), the concentration of TP in the east is different from that in the west, and the content increased progressively from the west to the east. The water quality of Liangzi Lake is graded as Class III and Class IV by single factor analysis of CODMn, in which Class III accounted for 3.2%, and Class IV for 96.8%. Class IV water dominated. According to Figure 2(d), the content of CODMn in the whole lake is high, indicating that the water is polluted by organic and inorganic oxidizable substances. The water quality of Liangzi Lake is graded as Class I by single factor analysis of DO, indicating that the water of Liangzi Lake is highly pable of self-cleaning. This is because that the value of DO (Dissolved Oxygen) is a proof of self-cleaning ca-pacity of water.
(a) (b) (c)
[image:3.595.95.532.406.699.2](d) (e)
Figure 2. Single factor analysis of water quality classification. (a) NH -N4
+
3.2. Water Quality Evaluation Based on PCA
Principal component analysis refers to a multivariate statistical analysis method based on well-established theo-ries which is to make quantitative study by including multiple factors in one system [7]. The function of princip-al component anprincip-alysis is to summarize multiple indicator variables into a few aggregative indicators that are princip- al-most sufficient to reflect the information contained in the original variables based on research on correlation among the variables from the angle of dimensionality reduction, with the minimum information loss [8].
The comprehensive water quality evaluation function is obtained via principal component analysis. SPSS software is employed to standardize the water quality indicators in October, and obtain the total variance, cumu-lative contribution rate (Table 1) and initial factor load matrix (Table 2) of indicator explanation in this month. The initial factor load matrix is obtained via SPSS calculation, while the principal component load matrix is ob-tained by dividing the data of the initial factor load matrix by the square roots of the characteristic values in cor-respondence with the principal components. After the coefficients of all indicators contained in the 2 principal components are obtained, the corresponding principal load values (Table 3) are calculated out.
In Table 4, F1 refers to the first principal component, representing ammonia nitrogen, total phosphorus, and permanganate index; F2 to the second principal component, representing total nitrogen and total phosphorus. The expression of principal component obtained with λ1 = 2.066 and λ2 = 1.016 is as below:
1 1 2 3 4 5
F =0.519962X +0.314678X +0.520637X +0.490250X +0.345741X (1)
2 1 2 3 4 5
F =0.267536X +0.650972X −0.327417X +0.085959X −0.623929X (2) Water quality assessment integrated function for:
1 2
[image:4.595.86.540.422.489.2]F=0.671669219F +0.328330781F (3) According to the total variance and accumulated contribution rate, the contribution rate of the first principal component is 43.853%; according to the initial factor load matrix, the load of ammonia nitrogen, total phospho-rus, and permanganate index in the first principal component is high, indicating that the first principal compo-
Table 1. Each index explain of the total variance and cumulative contribution rate.
Component
Initial eigenvalues Extraction sum of squares
Total Variance % Cumulative % Total Variance % Cumulative %
1 2.193 43.853 43.853 2.193 43.853 43.853
[image:4.595.90.539.520.570.2]2 1.072 21.440 65.293 1.072 21.440 65.293
Table 2. Component matrix.
4
NH -N+ TN TP CODMn DO
Component 1 0.770 0.466 0.771 0.726 0.512
Component 2 0.277 0.674 −0.339 0.089 −0.646
Table 3. Load matrix.
Feature vector NH -N4
+
TN TP CODMn DO
F1 0.519962 0.314678 0.520637 0.490250 0.345741
F2 0.267536 0.650972 −0.327417 0.085959 −0.623929
Table 4. Grade evaluation of water quality standard values in normal water period.
Water quality I II III IV V
[image:4.595.89.539.600.654.2] [image:4.595.86.537.682.719.2]nent basically reflect the information of these indicators; the load of total phosphorus in the second principal component is high. Through analyzing the variance and contribution rate, it is found that the variance and con-tribution rate of the first principal component are larger than that of the second principal component. Thus, the main influencing compositions are controlled by the first principal component, namely ammonia nitrogen, total phosphorus, and permanganate index. The main pollution problems are eutrophication and organic pollution.
3.3. Water Quality Evaluation Based on Voronoi Area Weighting Factor Method
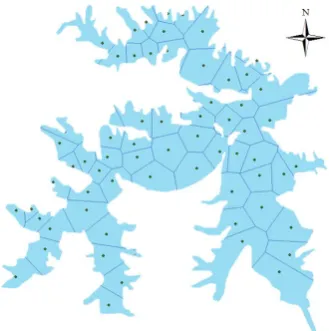
Voronoi is composed of a group of continuous polygons formed by perpendicular bisectors of straight lines formed by connecting two adjacent points. Thiessen polygon is applied for qualitative analysis, statistical analy-sis, proximity analyanaly-sis, and son on [9]. Area-weighting method refers to a trend predication method of calculat-ing out the weighted arithmetic average of multiple observed values of a same variable that are sequenced with the area as the weights, and obtaining the predicated value of the variable in future based on the average. Con-cerning the application of this method in this case, the proportion of the sum of water areas (which are known) represented by the point locations of each water quality grade to the total area of water under evaluation (namely weighted area) is calculated out to reflect the overall water quality of the lake [10]. A Thiessen polygon is built with ArcGIS based on the data of the sampling points, with the range restrict according to the outline of the lake, as shown in Figure 3.
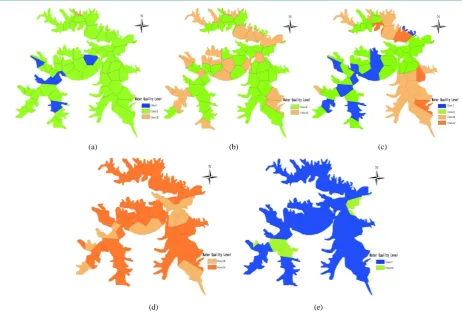
After the Thiessen polygon being built, the attribute data of the sampling points are associated with the poly-gon, assigning the attribute data of the five water quality factor to it. Single factor analyses are made in line with the standards for surface water, and the results are shown in Figure 4.
4
NH -N+ factor analysis result dedicates class I, II, III and IV water, which class I account for 7.6%, class II accounts for 92.1%, and class IV accounts for only 0.3%, indicating water quality mainly dominated by class II water. From Figure 4(a) can be drawn, NH -N4+ factor has reached a reasonable range in the lake. The water quality obtained by TN factor analysis shows class II and class III water, which class II accounts for 63.9% and class III accounts for 36.1%.Different from the result of single factor analysis, it is conclud that the class II water is more than the class III water. At the same time can be from Figure 4(b) indicates that the TN factor mainly exists in close to the land of lake’s entrance. TP factor analysis result is class I, II, III and IV water, which class I account for 23.1%, class II accounts for 40.0%, class III accounts for 32.4%, and class IV accounts for only 4.5%, indicating water quality mainly dominated by class II water. CODMn factor analysis result displays class III and class IV water, which class III account for 23.7%, class IV account for 76.3%, meaning mainly in the class IV of water quality. Water quality result is class I and class II by use of DO factor analysis and class ac-counts for 93.9%.
3.4. Comprehensive Water Quality Grade Distribution and Analysis
Overlay analysis is made on the abovementioned single factor analysis results with the worst factor
[image:5.595.229.394.530.696.2](a) (b) (c)
[image:6.595.76.539.78.390.2]
(d) (e)
Figure 4. Single factor analysis of water quality classification. (a) NH -N4+ ; (b) TN; (c) TP; (d) CODMn; (e) DO.
tion method [11] (namely identifying the water quality grade of all pixels, and taking the lowest grade as the comprehensive water quality evaluation grade), and a distribution diagram of comprehensive water quality grades of October is drawn, as shown in Figure 5(a). The factor values of all sampling points are put in the comprehensive water quality evaluation function (formula 3) of October obtained via principal component anal-ysis, to calculate out the value F of comprehensive water quality evaluation function of all sampling points. Common kriging interpolation and semi variable function model for geostatistical analysis are employed in combination with ArcGIS software to obtain a water quality grade evaluation diagram of Liangzi Lake in vari-ous periods.
The spatial water quality grading standard for Liangzi Lake in October is worked out based on the critical values of the content of the five water quality factors via principal component analysis in accordance with GB 3838-2002, as shown in Table 4.
The common kriging interpolation results are reclassified according to the grading standard shown in Table 5
to obtain a spatial water quality grade distribution diagram in October, as shown in Figure 5(b).
The third method of comprehensive water quality evaluation is to make overlay analysis of results of Figure 4
with the worst factor discrimination method to obtain a comprehensive water quality evaluation grade distribu-tion diagram in October, as shown in Figure 5(c).
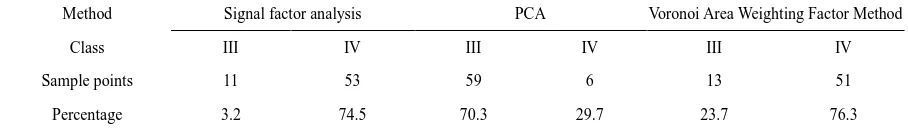
According to the results of single factor analysis, the water quality of Liangzi Lake are graded as Class III and Class IV only, and the number of observation points meeting the requirements of Class III surface water reached 11, accounting for 3.2%; the number of observation points meeting the requirements of Class IV surface water reached 53, accounting for 74.5%. According to Figure 5(a), the water quality of Liangzi Lake in this period reached the requirements of Class IV water, the spatial water quality distribution is uniform, the water quality in the northeast (the entrance to the Yangtze River) is good, and that in other areas is Class IV. Comparison with
(a) (b) (c)
Figure 5. Grade evaluation map of space water quality.
Table 5. Statistical comparison of the result of the three analysis methods.
Method Signal factor analysis PCA Voronoi Area Weighting Factor Method
Class III IV III IV III IV
Sample points 11 53 59 6 13 51
Percentage 3.2 74.5 70.3 29.7 23.7 76.3
According to the results of principal component analysis, the water quality of Liangzi Lake are graded as Class III and Class IV only, and the number of observation points meeting the requirements of Class III surface water reached 59, accounting for 70.3%; the number of observation points meeting the requirements of Class IV surface water reached 6, accounting for 29.7%. It is thus clear that Class III water dominated Liangzi Lake dur-ing the wet season. Accorddur-ing to Figure 4, the water quality of Liangzi Lake in this period basically reached the requirements of Class III water, the spatial water quality distribution is uniform, the water quality in the east is different from that in the west, and the water quality at the outlet in the north and in some areas in the southwest is poor, just meeting the requirements of Class IV water. The results obtained with this method indicated that the water quality is good. The results are relatively objective, for the water quality factors are all taken into account.
Comparing the results obtained via area-weighting analysis with Thiessen polygon with that obtained via sin-gle factor analysis, it is found that in the former one, the percentage of Class III water is higher, and the influ-ence of single factors is lowered; comparing the results obtained via area-weighting analysis with Thiessen po-lygon with that obtained via principal component analysis, in addition to comprehensive evaluation, single fac-tor analysis is added, making the research process complete. Because single facfac-tor analysis is still employed, however, the grade standard of the overall water quality are affected due to excessive content of CODMn.
4. Conclusions
The paper uses single factor evaluation method, principal component analysis and voronoi area weighting factor method to comprehensively evaluate water quality of Liangzi Lake based on sample data. The obtain data with respect to comprehensive water quality can be used to judge the level of water quality. The analysis shows, the grades of comprehensive water quality gained by three methods are all only class III or class IV, and the quality of water is different from east and west that the water quality of east is better. However, the percent of IV class water is higher in the result of single factor evaluation method means IV class is the main grade of water quality. The result of principal component analysis shows the percent of III class water is higher than other classes. The result of voronoi area weighting factor method shows the percent of IV class is higher than other classes. CODMn is the main factor that influences the method of signal factor evaluation and reduces the grade of water quality overall. The effect of single factor is reduced by principal component analysis, and the analysis on water quality is more accurate.
[image:7.595.86.540.273.338.2]the single factor indicators, or determine the comprehensive water quality of Liangzi Lake solely on any single factor. The principal component analysis method can overcome this defect, but it is just able to determine water quality solely by figures with this method to obtain a loose result. The voronoi area weighting method, on one hand, weakened the influence of single factors, and on the other hand, overcame the defect of principal compo-nent analysis of incapability of analyzing single factors.
Acknowledgements
The authors gratefully acknowledge the support from National Science Foundation of China (41301516) and The Public Welfare Demonstration Project from The State Bureau of Surveying and Mapping (201412014).
References
[1] Lan, W.H. and An, H.Y. (2002) Discussion on Methods of Water Quality Assessment. Arid Environmental Monitoring, No. 3, 167-169.
[2] Huang, X.G. and Liu, X.H. (2005) Comparison on Several Methods of Quality Evaluation on Water Environment.
Ground Water, 27, 125-126.
[3] Shen, J., Pan, Y. and Huang, Y. (2011) A Review on Evaluation Methods of Urban Surface Water. Environmental Protection and Technology, 17, 41-45.
[4] Li, Z.H. (2009) Study on the Ecological Environment Protection of Liangzi Lake. Science Press, Beijing.
[5] GB3838-2002, Environmental Quality Standards for Surface Water.
[6] Wang, D.D. (2009) Study on Evaluation Method of Overall Water quality of Rivers and Numerical Simulation. Master Dissertation of Wuhan University of Technology, 10-15.
[7] Qiu, D. (1991) The System Analysis of Multi-Objective Comprehensive Evaluation Method. China Statistics Press, Beijing.
[8] Liu, D.L. and Liu, X.Z. (2006) Application of Principal Component Analysis to the Comprehensive Evaluation of Wa-ter Quality in River. Research of Soil and Water Conservation, 13, 124-125.
[9] Chen, C. (1987) Creating of Thiessen Polygons and Their Application in Computer Graphics. Journal of Surveying and Mapping, No. 3, 223-231.
[10] Zhu, Z.C., Liu, Y.Y. and Fan, T.Y. (2006) Evaluation Analysis of East Lake’s Water Quality with Area Weighting Factor Method. Environmental Science and Technology, 29, 67-68.
[11] Mao, X.H. (2006) Selection on Assessment Methods of Typical Water Quality. Water Science and Engineering Tech-nology, 1, 1-4.
Submit or recommend next manuscript to SCIRP and we will provide best service for you:
Accepting pre-submission inquiries through Email, Facebook, LinkedIn, Twitter, etc. A wide selection of journals (inclusive of 9 subjects, more than 200 journals) Providing 24-hour high-quality service
User-friendly online submission system Fair and swift peer-review system
Efficient typesetting and proofreading procedure
Display of the result of downloads and visits, as well as the number of cited articles Maximum dissemination of your research work