Munich Personal RePEc Archive
Real Interest Rates, Bubbles and
Monetary Policy in the GCC countries
Razzak, Weshah and Bentour, E M
Arab Planning Institute
1 December 2009
Online at
https://mpra.ub.uni-muenchen.de/21636/
Real Interest Rates, Bubbles and Monetary Policy in the GCC countries
E. M. Bentour W A Razzak Arab Planning Institute
Kuwait First Version 2009
Revised 2010
Abstract
The Gulf Cooperation Council countries (GCC) include Bahrain, Kuwait, Oman, Qatar, Saudi Arabia and the UAE. Their monetary policy objective is to stabilize the foreign price, i.e., exchange rate instead of the domestic price level, where the
nominal interest rate is equalized with the US federal funds rate, but the inflation rates are independent. High oil prices and the depreciating US dollar caused inflation to rise and real interest rates to be persistently negative in the UAE and Qatar. Housing price bubbles formed, then burst creating large loses. They could have moderated the effect of, or avoided, the bubble had they floated the currency and stabilized domestic prices.
JEL Classification E31, E37, E58
1. Introduction
The fixed exchange rate regime was unsustainable in the US because of balance of payments problems. The US floated the dollar in 1973. Other Western nations followed suit. Speculators attacked the Bank of England and forced it to exit the European Exchange Rate Mechanism in 1992.
Hong Kong has a currency board vis-à-vis the USD; it feels safe from potential attacks, most likely because the Bank of China's massive reserves deter speculators. Housing price bubbles have higher chances forming under fixed exchange rate regimes where it =it*, and if πt >πt*and rt <0 (see appendix for data and notation). Figure 1 illustrates using Hong Kong data for the real money market rate and real house price change (the correlation is -0.75). During the period from the 1990-1999, average real interest rate rt <0, and average inflation πtwas 6.87 percent and the US average inflation rate *
t
π was 3 percent.
High inflation is bad, in addition to eroding purchasing powers, increasing the variability of relative prices, and distorting real decisions, excess money and credit fuel the housing markets. Central banks can stabilize the foreign price (fix the exchange rate) or stabilize the domestic prices (e.g., inflation targeting), but not both.
The GCC adopt a fixed exchange rate regime to the US dollar (except Kuwait which pegs to a basket), where is set equal to , to keep the depreciation rate constant. Inflation in the GCC is usually imported, and highly associated with high oil prices and loose US monetary policy.
t
i it*
The IMF article IV consultation 2008 shows that the UAE had negative real interest rates persisted for years. Qatar too had a persistent negative real interest rate. Oman's rate became negative in 2007-2008. The other GCC countries have very low real interest rates. The GCC produce about 23 percent of the world's oil and controls 40 percent of the world's oil reserve. They probably feel safe from speculators because of their sizable foreign reserves. They also seem content with the fixed exchange rate regime and oblivious to housing price bubbles. The UAE and Qatar are similar to Hong Kong in many aspects.
GCC housing time series data are not available. Colliers International plots a hump-shaped housing price index for Dubai, which went from 100 in 2007 to nearly 220 in mid 2008 then took a nosedive to 100 in early 2009.
Had the GCC adopted a monetary policy of targeting low domestic inflation rate, average nominal interest rate would have been higher than otherwise and average real interest rate would have been positive than otherwise, which imply that housing price bubbles could have been moderate, if not totally absent.
2
2. Monetary policy simulations
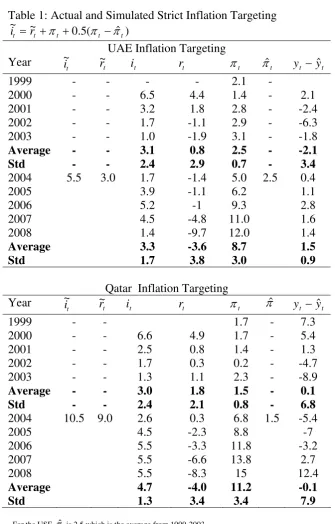
The UAE and Qatar's inflation rate are low and stable during 1999-2003. They are high and more variable during 2004-2008. Let's assume that the UAE and Qatar float their currencies and adopt an inflation targeting regime. They could have used a "strict" inflation targeting strategy, such that an increase in the inflation rate πtby one percentage point above an inflation target πˆ would have required an increase in the short-term nominal interest rate i~t by 1.5 percent.
) ˆ ( 5 . 0 ~ ~
1 it =r +πt + πt −π
After achieving the inflation target, the central banks can switch to a "flexible" inflation targeting (Sevensson, 1997) by following:
) ˆ ( 5 . 0 ) ˆ ( 5 . 0 ~ ~
2 it =r +πt + πt −π + yt −yt
We present a counterfactual inflation targeting experiment. We report the data and the calculations of the interest rates using the strict inflation targeting rule in equation (1) for the UAE and Qatar in table 1. We assume that the central banks decided to intervene in 2004. Late intervention would have been costly because the higher the inflation rate the higher the increase in interest rate required to bring inflation under control. To bring inflation rates in 2004 to the levels observed between 1999-2003, they would have targeted a 2.5 percent inflation in the UAE and 1.5 in Qatar, which are the averages over that period. The implied short term interest rate and the implied neutral real rate are denotedi~t and r~ . For the UAE, the nominal interest rate t
required to achieve the inflation target would have been 5.5 percent and the neutral real interest in 2005, 3 percent. For Qatar, the nominal interest rate required to achieve the target would have been 10.5, and the neutral real interest rate in 2005, 9 percent.
t
i ~
In 2005 the targets are achieved. Inflation in the UAE would have been 2.5 instead of 5 percent and 1.5 instead of 6.8 in Qatar. The inflation rates stay at 2.5 percent and 1.5 for the UAE and Qatar respectively as long as – theoretically – there are no shocks pushing the inflation rate away from the target and output is close to its potential level.
In this counterfactual experiment, Qatar had to increase the interest rate significantly higher than the UAE in 2004 because its inflation target was 1.5, lower than the UAE's target of 2.5 and the gap between the target and actual inflation in 2004 is very large. Most of the inflation targeting regimes though achieved their targets sooner than anticipated. Once expectations adjust to the commitment of the central bank to achieve price stability, inflation expectations declined rapidly.
3. Conclusion
3
etc. Excess money and credit fueled housing and construction boom, which finally was followed by a bust in Dubai (the UAE) in 2009. A floating exchange rate regime with an inflation targeting policy could have moderated, if not fully prevented,
4
Appendix
US data are from the IFS, IMF.
UAE's interest rate are from IMF staff consultation documents. Hong Kong housing price is from HKMA.
t
i denote nominal interest rate; for Hong Kong, money market rate. For the UAE the 91 CD rate; Repo for Qatar from IFS.
t
π denotes CPI inflation rate, source: IFS. denotes the real interest rate,
-t
r it πt−1
t
y is log real GDP, source: is World Economic Outlook, IMF 2009. (*) denotes US magnitudes.
(-) on variables denotes average value.
(^) on inflation denotes the target; on GDP denotes potential GDP (HP filter with 100
=
λ ).
(~) denotes simulated value.
5
References
Colliers International http://www.globalpropertyguide.com/real-estate-house-prices/U
Svensson, L., 1997, Inflation Targeting in an Open Economy: Strict or Flexible Inflation Targeting? Sveriges Riksbank; Stockholm University - Institute for International Economic Studies (IIES); National Bureau of Economic Research
(NBER); Centre for Economic Policy Research (CEPR) and the Reserve Bank of New Zealand Working Paper No. G97/8
Taylor, J. B., 1993, Discretion versus Policy Rules in Practice, Carnegie – Rochester Conference on Public Policy, Cambridge, MA, MIT Press.
6
Table 1: Actual and Simulated Strict Inflation Targeting
) ˆ ( 5 . 0 ~ ~ t t t t t r
i = +π + π −π
UAE Inflation Targeting Year t i ~ t r
~ it rt πt πˆ t yt −yˆt
1999 - - - - 2.1 -
2000 - - 6.5 4.4 1.4 - 2.1 2001 - - 3.2 1.8 2.8 - -2.4 2002 - - 1.7 -1.1 2.9 - -6.3 2003 - - 1.0 -1.9 3.1 - -1.8
Average - - 3.1 0.8 2.5 - -2.1
Std - - 2.4 2.9 0.7 - 3.4
2004 5.5 3.0 1.7 -1.4 5.0 2.5 0.4
2005 3.9 -1.1 6.2 1.1
2006 5.2 -1 9.3 2.8
2007 4.5 -4.8 11.0 1.6
2008 1.4 -9.7 12.0 1.4
Average 3.3 -3.6 8.7 1.5
Std 1.7 3.8 3.0 0.9
Qatar Inflation Targeting Year t i ~ t r
~ it rt πt πˆ yt −yˆt
1999 - - 1.7 - 7.3
2000 - - 6.6 4.9 1.7 - 5.4 2001 - - 2.5 0.8 1.4 - 1.3 2002 - - 1.7 0.3 0.2 - -4.7 2003 - - 1.3 1.1 2.3 - -8.9
Average - - 3.0 1.8 1.5 - 0.1
Std - - 2.4 2.1 0.8 - 6.8
2004 10.5 9.0 2.6 0.3 6.8 1.5 -5.4
2005 4.5 -2.3 8.8 -7
2006 5.5 -3.3 11.8 -3.2
2007 5.5 -6.6 13.8 2.7
2008 5.5 -8.3 15 12.4
Average 4.7 -4.0 11.2 -0.1
Std 1.3 3.4 3.4 7.9
- For the USE,πˆtis 2.5 which is the average from 1999-2003. - For Qatar, πˆtis 1.5 which is the average from 1999-2003. - Inflation targeting begins in 2004.
7
Figure 1: Hong Kong Real Interest Rate and Change in Housing Price Index
-40 -30 -20 -10 0 10 20 30 40 50
1990 1991 1992 1993 1994 1995 1996 1997 1998 1999
H
ous
e
P
ri
c
e
C
ha
nge
-8 -6 -4 -2 0 2 4
R
e
a
l In
te
re
s
t R
a
te