ISSN: 1992-8645 www.jatit.org E-ISSN: 1817-3195
394
CLUSTERING AND SEARCHING TECHNIQUE FOR
SELECTION HORTICULTURAL USING SELF ORGANIZING
MAPS AND GENETIC ALGORITHM
1,5ASTI DWI IRFIANTI, 2RETANTYO WARDOYO, 3SRI HARTATI, 4ENDANG SULISTYANINGSIH
1
Doctoral program of Computer Science, Universitas Gadjah Mada, Yogyakarta, Indonesia
2,3
Department of Computer Science and Electrical, Universitas Gadjah Mada, Yogyakarta, Indonesia
4
Department of Agronomy, Universitas Gadjah Mada, Yogyakarta, Indonesia
5
Information System Department, Faculty of Computer Science, University of Pembangunan Nasional “Veteran” Jawa Timur, Indonesia
E-mail: [email protected], [email protected], [email protected], [email protected]
ABSTRACT
The purpose of this study is to develop model for determination of horticultural commodities based on the terms of an area to grow crops. The method use in SOMnGA (Self Organizing Maps and Genetic Algorithm). This method consists of three stages: 1) Clustering, 2) Filtering and 3) Searching based on the shortest distance between the growing crop terms and region parameters (temperature, rainfall and humidity). The data used is secondary data obtained from Litbangdeptan, which is the data collection about the requirement needs of horticultural growth crops consisting of fruits, vegetables, ornamental and biofarmaka plants based on the standardization of the FAO (Food and Agriculture Organization). The test data used in this study were 30 types of horticultural crops. The parameters are used for the process of grouping consists of temperature, rainfall, humidity, base saturation, C-Organic, pH2O, alkalinity, salinity, rocks and Outcrop.
SOMnGA method works with an algorithm that can contribute to this research. SOM role classifying plant data based on 10 parameters. Stages Clustering by using SOM created a group of plants that have a closeness characteristics to the needs of plant growth requirements. Then the result of grouped is filtered based on area parameters that user required. Furthermore GA has important part in chooseing the plant filtered result data to produce a list of the closest distance plants towards parameter region. SOMnGA testing consists of two parts: 1) using the method of Davies Bouldin Index (DBI) to produce numbers of 0,017 and an error rate of 10%. 2) comparing with SGA (Simple GA) and SOMnGA. In this study indicates that the SOMnGA method produced shorter iterations to produce outcomes. Testing of 25oC temperature, 125mm Rainfall and 40% Humidity generate a distance of 1941 with each iteration 2276 (SGA) and 25 (SOMnGA) Verify the model in the field using the accuracy method showed a value of 86%. SOMnGA method is a combination of methods that can be used to determine the main commodity based regional horticultural effectively and efficiently. So that the plants election result use SOMnGA could be used as a guide the alternative for farming planning team as one way to determine the main commodity of a region.
Keywords:Clustering, Self Organizing Maps, Genetic Algorithm, Horticulture
1. INTRODUCTION
Regional commodities selection is an activity that is important and necessary to assist the government in an effort to increase the export production, improve food security, increase effectiveness and productivity and iconic area for tourism interests [1]. Nowadays, if an investors are
ISSN: 1992-8645 www.jatit.org E-ISSN: 1817-3195
395 suitability requirements list of growing plants with the climate regions, while it is very important. The complex factors that experienced today is the election still being done conventionally that takes a long time. Based on the problem above, the proposed election of horticultural crops using SOMnGA.
The purpose of this research is to develop the pricing of horticultural commodity models based on grow crops proximity and region climatic parameters requirements using SOMnGA. area Climate parameters are used (temperature, rainfall and humidity). SOMnGA Outputs produce plants closest conformity with the climatic conditions of the region so that being able to minimize losses and risk of crop failure. In this study, the limitation are horticultural commodities namely fruits, vegetables, herbs plants and ornamental plants. Clustering method used is the SOM Kohonen Neural Network and search method used is the Genetic Algorithm. Research on the determination of superior agricultural commodities has been done by previous researchers, including Agroecological Zone methods by using Fuzzy Logic and spatial. Disadvantages of this method is limited to certain locations and certain crops [2]. LQ Methods (Location Question) which is the approach of the economy with the comparative approach. This method is used to determine the commodity distribution or the areas identification based on its potential. Disadvantages of this method is there is no program so that is difficult to develop, but it is no level of accuracy. The time required for the analysis is quite long, about 5 years, while the problems to collect the data in the field is often faces the barriers [3]. For that, it is necessary to propose a method to determine the superior agricultural commodities in a more effective and efficient.
Novelty in this study is the clustering, filtering and searching using SOMnGA. The advantages of the method SOMnGA is customizable, easy to use, easily operated by the user, one location can be known the list featured of some horticultural commodities. This method is more efficient in searching process because it has to go through grouping first before starting the searching process so that the results are more acquired rapidly. This study consists of three parts, namely, the first section discusses about the approach of clustering using SOM, section 2 discusses about the identification of locations using filtering data and section 3 discusses about the searching approach by using GA.
2. LITERATURE SURVEY
Clustering is an approach that has been developed in various fields of research. Cluster approach on research in agriculture is an innovation and strategy encountered in the area of Agriculture Neural Network (ANN). Some 348 papers and journals in the area of agriculture and biological engineering, ANN have a problem-solving approach to quality and food quality and safety (35.34%), crop (22.7%), soil and water (14.3%), precision agriculture (6.61%), animal management (5.17%), post harvest (2.59%), food processing (2.3%), greenhouse control (2.01%), agricultural vehicle control (1, 15%), agricultural machinery (1.15%), agricultural pollution (1.15%), agricultural biology (1.15%), ecology and natural resources (1.44%), agricultural robotics (0.29%) , chemical application (0.29%), and others (2.3%) such as bioenergy and agricultural facilities. ANN classification (45.11%), modeling and prediction (43.97%), control (4.02%), simulation (2.59%), parameter estimation (2.01%), detection (1.15% ), the data clustering (0.57%), optimization (0.29%) and data fusion (0.29%). While based on research-based Genetic Algorithm (GA) of a number of 83 papers and journals, GAs have can be applied to solve the problem as follows: crop management (31%), water management (27%), food quality and safety (11%), food processing (6%), precision agriculture (4%), agricultural biology (4%), agricultural machinery (2%), agricultural facilities (2%), animal behavior (2%), and others (11%) such as agricultural vehicle, robotics, and pollution. GA is the basic of searching methods. The Application for optimization gets a large portion which total of 66%. GA is also used to help modeling and prediction (18%), classification (12%), control (2%), the data clustering (1%), thresholding value (1%). [4]. From the umpteenth research papers and journals above, it became the foundation for researchers to develop techniques ANN in the electoral process to guide the cultivation of horticultural crops. Several studies in the relation to ANN that has been developed by researchers predecessor as follows: Land Suitability using Fuzzy Logic[5], Fuzzy Decision Support System (Fuzzy-DSS)[6], Neural Network-LearningVector Quantitation (NN-LVQ) [7], Neural Network –Back Propagation (NN-BP) [8], Artificial Neural Network Geography Information System(ANN-GIS) [9], Fuzzy GIS [10], Analisis Fuzzy[11].
ISSN: 1992-8645 www.jatit.org E-ISSN: 1817-3195
396 suitable horticultural crops to the conditions of an area based on the condition of the plants grow.
3. PURPOSE METHOD 3.1 Integrated SOMnGA
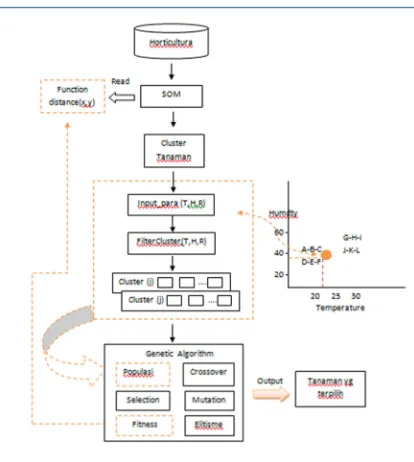
[image:3.612.93.300.281.512.2]SOMnGA is a combination of clustering and searching methods. SOM is a method of Kohonen Neural Network[14] which in this study is used to classify the plant data based on the terms of plant growth by 10 parameters, such as temperature, precipitation, humidity, c-organic, based saturation, PhH2O, alkalinity, salinity, rocks and Outcrop. While GA is searching method used to cluster search results modified to the identification of the location obtained from filter cluster algorithm. Block diagram shown in Figure. 1.
Figure 1. Block Diagram Model SOMnGA
Data from the cluster will be validated using DBI. To obtain the appropriate plant grouping, the user enters the data of temperature, precipitation and humidity at the point of desired location. Filter Cluster function will choose the plants in each group of plants. The output of the model SOM and GA in the form of a list of the plants selected.
3.1 .Algorithma SOMnGA
One of the contributions of this study is the formation of SOMnGA algorithm. There are SOMnGA algorithm below:
1. Initialization of the weight vector for each neuron with random manner, Learning Rate α (0), where 0 <α (t) <1, iterations, Neighborhood.
2. Do if it is true
a. Calculate the distance between neuron (dij
= || xk – wij||)
b. Select the nearest neuron as winner wwinner
= (wij:dij = min(dmn))
c. Update each neuron accourding to the rule Wij = wij + α + h(wwinner, wij) || xk – wij||
d. Repeat the process until a certain stopping criterion is met. Usually, the stopping criterion is a fixed number of iteration. 2. Validation cluster using Davis Bouldin Index
(DBI)
3. User Identification location (input : Temp, Rainfall, Humidity)
4. Filter Data(temp, rainfall, humidity)
5. Initialization population with cluster filtered P(t)
6. Compute Fitness with distance from 2a. P(t), t=t+1;
7. If termination criterion achieved go to step 13 8. Select P(t) from P(t+1)
9. Crossover P(t) 10. Mutation P(t) 11. Go to step 8
12. Output Best and stop 13. End
Euclidean distance clustering Metric for K cluster C1, C2, ….Ck identify as (C1, C2, ….Ck) = ∑ ∑ ∈ || || Where the duty of GA is special searching for the cluster z1, z2…zk
according with matrix which is minimal.
3.3 Clustering
“Clustering in N-dimensional Euclidean space Rn is the process of partitioning a given set of n points into a number, say K, of groups (or, clusters) based on some similarity/dissimilarity metric. Let the set S and the K clusters be represented by C1,
C2,…Ck then Ci ≠ 0 for i = 1,…..,K, Ci ∩ Cj = 0 for
i = 1,…K, j = 1,…,K and i ≠ j and ∪ C1 = S”.
[11]
3.4 SOM
“The basic SOM Algorithm is iterative. Each Neuron i has a d –dimensional feature vector wi =
[wi1..wid]. At each training step t, a sample data
vector x(t) is randomly choosen for the training set. Distance between x(t) and all feature vectors are computed. The winning neuron, denoted by c, is the and all counted feature vector. Winning neuron, denote by c, is the neuron with the feature vector closest to x(t):
ISSN: 1992-8645 www.jatit.org E-ISSN: 1817-3195
397 a set of neighboring nodes of the winning node is denoted as Nc. we define hic(t) as the neighborhood
kernel function around the winning neuron c at time t. The neighborhood kernel function is a non-increasing function of time and the distanece of neuron I from the winning neuron c. The weigh update rule in the sequential SOM Algorithm can be written as.
wt(t+1) = wi(t) + ∈(t)hic (t) (x(t) – wi(t)) ∀∈ Nc… (2) wi(t) ow
Both learning rate ∈(t)hic and neighborhood α (t)
decrease monotonically with time. During training, the SOM behaves like a flexible net that fold onto a cloud formed by training data. Because of the neighborhood relations, neighboring neuron are pulled to the same direction, and thus feature vectors of neighboring neurons resemble each other”.[12]
3.5 Identify Areas
The location Identification is used to determine the filter data on a cluster based on temperature, rainfall and humidity. The Function of filter cluster (temp, rainfall, humadity) will filter the data based on the shortest distance. Then the results of the filter data will be used to initialize the chromosome in the population. The number of genes is the number of plants to be selected can be represented as ∑ch = n(k). The algorithm described in the data filter data filter function as follows:
Function filter_cluster(temp, rainfall, humadity);
Var
temp_min, temp_max : number; rainf_min, rainf_max : number; humdy_min, humdy_max : number; Begin
i:=0; data=[];k=i; For i:= 1 to n do if kluster(i) then
Temp_min := temp_m; Temp_max := temp_x; Rainf_min := rainf_m; Rainf_max := rainf_x; Humdy_min := humdy_m; Humdy_max := humdy_x; if ((Temp >= Temp_min & Temp <= Temp_max) & (Rainfall >= rainf_min & rainfall <= rainf_max) & (Humadity >= humdy_min & Humadity <= humdy_max))
data=kluster(i); kluster(k)=1; k=k+1; end if;
3.6 Genetic Algorithm
Each string is an on off symbol of a number 0 or 1 that is represented as k. Eg number of clusters where it chromosome 120, 121, 122, 123, 124, 125, 126, 127, 128, 129 is represented as k1, k2, k3, k4, k5 ... kn. then performed as a population of random initialization. Code fruit genetically selected to be given symbols 1 and were not elected by the code symbol 0. 120, 121, 122, 123, 124, 125, 126, 127, 128, 129 for Orange, Mango, Banana, mangos teen, Papaya, Durian, Broccoli, Carrots, Tomatoes, Paprika.
gen
Chromosom
.Figure 2. Chromosome Inisialitation
3.6.1 Population initialization
The population size of P is the number of chromosomes and genes. Genes are k1, k2, k3, k4, k5 ... kn. the user can specify the number of plants (n) to be in training with GA. Random to n (k) with (0.1) where 0 = not elected or 1 = elected.
3.6.2 Calculate fitness
Fitness value indicates the quality of the chromosomes in the population. The size of the proximity data using distance that has been used when searching for clusters among fruit. If the first object observed is x = the test data that is x = [x1, x2, x3, ..., xp] and y = i-th plant data in the chromosome is y = [y1, y2, y3, .. ..., yp] the fitness calculation is as follows:
[F] = || dist (yi, yi+1) + dist (x, yi+1)) ||..…(3)
Fitness calculations performed in its entirety in accordance with the number of chromosomes is raised. Then calculate the probability of a fitness value to minimize the distance function. After that calculate total probability value of fitness.
Probabilitas fitness [Q] = 1 ……..…(4)
F
3.6.3 Selection process
To conduct the selection process by using probability calculations required Roulette Wheel to k1 k2 k3 k4 kn
ISSN: 1992-8645 www.jatit.org E-ISSN: 1817-3195
398 spin the its wheel, while the formula used as follows:
Probability [P] = Q ………....(5) ∑F
Calculates the cumulative probability by the formula C [1] = ΣP [1], C [2] = ΣP [1] P [2] and so forth, number of chromosomes. Then the process is carried by Random of chromosome number. R [1] ..R [n] The value R [1] compared to swap C [1], the value of R [2] to swap C [2] to R [n] to swap C [n]. Each C [n] is used as a barrier, eg R [1] = 0.321, the position C [1] will be exchanged for C [4] because ΣP [3] have a barrier = 0.3185 and ΣP [4] have 0.3954 barrier. That is the position of C [1] is above P [3] so that the position is limited by P [4]. At this stage the position of chromosome C [1] exchanged with chromosome C [4] until the process ends.
3.6.4 Crossover
Crossover process in this study is using one cut points. Parameter crossover probability (Pc) is used to determine the chromosome that will be swapped position. As the example Σ chromosome Pc = 10 then 50% will generate random numbers as much as 5. So chromosome elected to his position in exchange for as many as 5.
3.6.5 Mutation
Mutation process is also influenced by the parameters of the probability of mutation (Pm). To perform mutation then must calculate the total number of genes. Suppose Pm = 20%, then will generate a total of 10 genes of 50 genes that will be exchanged position.
3.6.7 Davies Bouldin Index (DBI)
According to [15] Davies Bouldin Index is matrix cluster to measure the data performance partition. DBI definition is based on the ratio from the amount of distance between clusters. DBI metric computation process can be described as follows:
S1 = 1 ∑ ∈ || 2||2 ……….… (6) N
Euclidean distance Di, j between clusters Ci and Cj are presented as follows:
Di,j = || z i – z j || 2
………...(7)
For an Cj two clusters Cid measured by the distance Rij cluster can be represented by
R i, j = Si + Sj ………(8)
Dij
In each cluster Ci, Ri maximum value can be calculated by
Ri = m a x R i ,j ………...…...(9) j, j ≠ 1
So DBI is defined as:
DBI = 1 ∑ k ...(10)
4. RESULT AND ANALYSIS
By using the Cluster Validation Performance Analysis of Mathlab, obtained DBI performance as shown in Table 1. Values DBI best cluster that best shows on Nc6 = 0.23144. The error rate is 10%.
Table 1 Validation Index with DBI
Nc2 Nc3 Nc4 Nc5 Nc6 0.37496 0.46642 0.67216 0.64841 0.37971
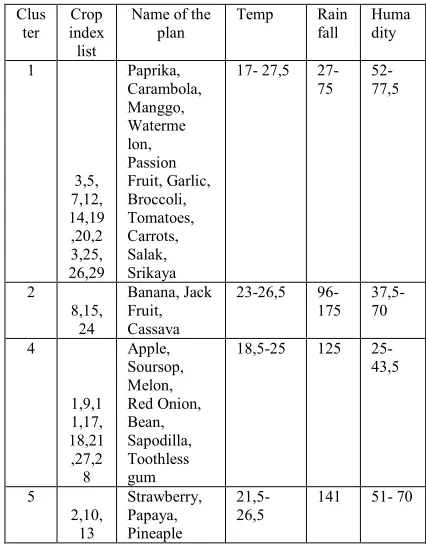
[image:5.612.310.523.456.732.2]In Table 2 is a list of crops index and the name of NC2. Once trained several times, then to make sure the results are not migrate groups and occupies the same group.
Table 2 clustering result with SOM
Clus ter
Crop index list
Name of the plan
Temp Rain fall
Huma dity
1
3,5, 7,12, 14,19 ,20,2 3,25, 26,29
Paprika, Carambola, Manggo, Waterme lon, Passion Fruit, Garlic, Broccoli, Tomatoes, Carrots, Salak, Srikaya
17- 27,5 27-75
52-77,5
2 8,15,
24
Banana, Jack Fruit, Cassava
23-26,5 96-175
37,5-70
4
1,9,1 1,17, 18,21 ,27,2 8
Apple, Soursop, Melon, Red Onion, Bean, Sapodilla, Toothless gum
18,5-25 125 25-43,5
5 2,10,
13
Strawberry, Papaya, Pineaple
21,5- 26,5
ISSN: 1992-8645 www.jatit.org E-ISSN: 1817-3195
399
Clus ter
Crop index list
Name of the plan
Temp Rain fall
Huma dity
6
4,6,1 6,22, 30
Grapes, Citrus, Durian, Chilies, Rambutan
21,5- 26,5
16-208
45-70
Based on the clustering results such as in Table 2, then it is arranged the Rule Base to form these groupings as follows:
If Tp >= 17 and Tp <= 27,5 and Rf >= 325 and Rf <= 900 and Hm >= 52 and Hm <=77,5 then Cluster = ‘1’;
Else If Tp >= 23 and Tp <= 26,5 and Rf >= 1150 and Rf <= 2100 and Hm >= 37,5 and Hm <=70 then Cluster = ‘2’; Else Tp >= 18,5 and Tp <= 25 and Rf = 1500 and Hm >= 25 and Hm <= 43,5 then Cluster = ‘4’; Else If Tp >= 21,5 and Tp <= 26,5 and Rf = 1700 and Hm >=51 and Hm <= 70 then Cluster = ‘5’;
Else if Tp >= 21,5 and Tp <= 26,5 and Rf >=2000 and Rf <=2500 and Hm >= 46 and Hm <= 70 then Cluster = ‘6’; End if;
Where:
Tp = Temperature, Rf = Rainfall, Hm = Humidity.
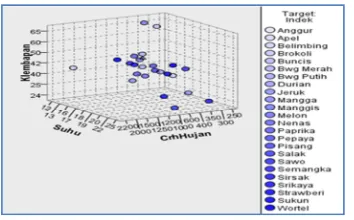
Figure. 3 is an illustration of the grouping on each plant. The closeness between plants is indicated by proximity. Suggests close proximity of the plant growth condition. The closer the plants, the more it resembles the condition the plants grow
.
Figure 3. Plants Cluster Sketch
4.4 GA Representation
Identification of the climatic conditions of an area can be obtained through user input or via software automation. These parameters can be selected according to user needs. The parameters are used to filter the data which are temperature, rainfall and humidity. The third parameter is used based on the consideration that the parameter is a
basic requirement to crop needs. Test by entering the data of temperature = 240C; Rainfall = 125mm; Humadity = 43%; Pc = 0.3; Pm = 0.2; Σn = 5; ΣCh = 6; ΣEpoh=5,
Identification will lead to 2 and 4 Cluster in which the cluster has led to the Banana (130), Jack Fruit (131), cassava (132), Apples (133), Sour sop (134), Melon (135), Onion (136) , beans (137), Sapodilla (138) and Breadfruit (139). In the initialization process of the population, random chromosome gene value of 0 or 1. In this scheme the value of the gene is in the interval (0,1) means that 0 = no selected 1 = selected. When the figures show the number 1, the gene becomes active and vice versa if the value shows the number 0, that gene is inactive. Eg on chromosome 1, selected active genes are 120, 121, 123, 124, 126, chromosome 2 gene selected active 120, 121, 122, 123, 125 and so it will be done calculating the value of fitness. Fitness value will be repeated for each chromosome. Furthermore, the probability of fitness and total fitness calculated for the selection process.
[image:6.612.104.281.489.599.2]The selection process being used in this study is using the Roulette Wheel. Crossover and Mutation process conducted for the reproductive process until the iteration ends. The comparison of the number of iterations between Simple GA and SOMnGA shown in Table 4 below, shows that the SOMnGA were able to achieve shorter iterations when compared with Simple GA.
Table 3. Distance Comparison SGA and SOMnGA
N o
Temp Rain fall
Hum madity
Dist ance
SGA
SOMn GA Iterati on
Iteratio n 1 27 75 70 1187 2964 25 2 24 125 43 1941 1212 64 3 20 66 60 1187 1186 80 4 23 183 50 2709 5511 72 5 25 125 40 1941 2276 25
Distance comparation between SGA and SOMnGA can be obtained result as in Figure. 4 below:
Figure 4.Ccmpare SGA and SOMnGA 0
1000 2000
1 2 3 4 5 6
SOMGA
[image:6.612.315.522.627.705.2]ISSN: 1992-8645 www.jatit.org E-ISSN: 1817-3195
400
4.5 Testing Model
Testing is done by comparing the output of SOMnGA models with actual conditions in the field. The method used is the accuracy of the method is to calculate the amount of the data that is divided by the number of overall data. The yield accuracy of 86% indicates significant value.
Table 4: Accuracy Methods Test
No SOMnGA Fruit Vegetables 1. Actual 21 9 2. Prediction 14 7
∑True 18 ∑False 3 Accuracy 86%
This test reinforces the hypothesis that Clustering, Filtering methods and Searching are able to help effectively the planning team to determine the field of Agriculture horticulture group featured by region. The Proximity terms grew crop plants form a zone that has a closest characteristic.
The Proximity the distance of grow plants requirements with weather factors generating the closest fit plants so it will reduce the risk of crop failure and damage to the environment.
The result of these plants grouping can be used as a guide in planning crop cultivation alternative, especially during crop rotation, polyculture, setting the cropping pattern, the pattern of integration and intercropping.
5. CONCLUSION
The conclusion of this study are as follows: 1. Each region needs to have excellent
commodities and are grouped according to proximity to the geographical conditions so as to minimize the risk of loss and crop failure. 2. The SOMnGA method is a finding that really
did not exist before and is a new innovation in the field of determining an area crops.
3. Proximity parameters between plants showed similarities crop needs towards its growth terms so that the closer the common features shown and suitability of the parameter region. This method is suitable for crop rotation, polyculture, setting the cropping pattern, the pattern of integration and intercropping 4. The results of the experiment showed
SOMnGA is more efficient than Simple GA
shown by the graph of the results within the electoral process in Figure. 4.
5. Outcomes SOM generating plants grouping plants are quite good and quite efficient so that it can be used as an alternative to the user guide for the cultivation of plants for generating sequences that tend to stick with a few changes, namely 10%. While the role of the GA as a search engine support in determining the election results based on the parameters of the user's location. Model SOMnGA produces 86% accuracy.
6. Model SOMnGA grouping and the search for effective, efficient, customizable and dynamic than the methods used at present which takes a long time and cost.
7. These findings are helpful in a real life and can be used as an alternative solution for the determination of the main commodity field area.
REFRENCES:
[1] Nogales, E.G., “Agro based cluster in developing countries: staying competitive in global economy”, Agriculture Management Marketing Finance occasional paper. Food and
Agriculture Organization of the united Nations,
Rome, 2010.
[2] Prasetyo, S.Y.J., Hasibuan, B., Hartono, K.D., “The Agroekological Zone using Fuzzy Logic for Land Suitability and Regional Sustainable Food Insecurity in Boyolali, Central of Java Indonesia”, IJCSI (International Journal
Computer Science Issues), Vol 9, Issue 6, No. 3,
November 2012, ISSN (Online): 1694-0814.
[3] Hendayana, R., “Aplikasi Metode Location (LQ) dalam penentuan komoditas unggulan nasional”, Informatika Pertanian, Vol. 12, Desember 2003 Transactions on Power
Systems, Vol. 11, No. 1, January 1996, pp.
540-545.
[4] Yanbo Huang, Y.,,Lan, Y., Thomson, S. J., Alex Fang, Wesley C Hoffmann and Lacely, R.E., “Development of soft computing and applications in Agricultural and biological Enggineering”, Computers and Electronic in
Agriculture, Elseiver, Vol 71, Issue 2, May
2010, pp 107-127.
ISSN: 1992-8645 www.jatit.org E-ISSN: 1817-3195
401
Conference 2003 On Mathematics and Its
Applications, pp 1-9, Yogyakarta, 2003.
[6] Keshavarzi, A.M., Samadian., F., Heidani, A. and Omid M, “Land Suitability Evaluation Using Fuzzy Continuous Classification A Case Study Ziaran Region”, Modern Applied Science, Vol 4 (7), pp 71-81, 2010.
[7] Gong J, Liua,Y and Chenc, W., “Land suitability evaluation for development using a matter-element mode:A Case study in Zengcheng, Guangzhou, China”, Science Direct
Elseiver, Vol. 29, Issue 2, April 2012, pp
464-472., 2012.
[8] Elaalem, M., “Land Suitabiltiy Evaluation for Sorghum Based on Boolean and Fuzzy-Multi-Criteria Decision Analysis Methods”,
International Journal of Environmental Science
and Development, 4 (3), pp 357-361, 2012.
[9] Witten, I., H. and Frank. E., “Data Mining: Practical Machine Learning Tools and Techniques”, Second edition, Morgan
Kaufmann Publishers, San Fransisco, 2005.
[10] Amor, H.B. and Rettinger, A., “Intelligent Exploration for Genetic Algorithms”, ACM , June 25-29, pp 1-10, 2005.
[11] Aristodimou, A., Antoniades,A. and Pattichis, C., “Clustering subjects in genetic studies with Self Organizing Maps”, IEEE Bioinformatics &
Bioengineering (BIBE), pp 546-551, 2012.
[12] Maulik, U. and Bandyopadhyay,S., “Genetic algorithm-based clustering technique”, Pergamon, Pattern Recognition 33, pp 1455-1465, 2000.
[13] Bouyer, A., Hatamlou,A. and Abdullah, A.H., “An Optimized Clustering Algorithm using Genetic Algrorithm and Rough Set Theory based on Kohonen Self Organizing Maps”,
IJCSIS (International Journal of Computer
Science and Information Security), Vol 8, No. 4,
July 2010, pp 39-44.
[14] Fausett, L., “Fundamental of Neural Network, Architectures”, Algorithms and Application,
Florida Prentice Hall, Englewood Cliffs, 1994.
[15] Cai, Q., He, H. and Man H., “Hybrid Learning Based on Multiple Self Organizing Maps and Genetic Algorithm”, Proceedings of International Joint Conference on Neural
Networks, San Jose, California, USA, July 31 –