769
OPTIMIZATION OF TRAFFIC SIGNAL TIMING
ON ROAD NETWORK USING CELLULAR AUTOMATA
AND FUZZY INFERENCE SYSTEM
1E.B. SETIAWAN, 2D. TARWIDI, 3R.F. UMBARA, 4S.N. KUDRAT
School of Computing, Telkom University, Bandung 40257, Indonesia
E-mail: [email protected], [email protected], [email protected],
4
ABSTRACT
The large number of vehicles in big cities has become a serious problem in adjusting the timing of traffic signal at intersections of road networks. Traffic light control is an important factor in road traffic system. In this paper, optimization of traffic signal timing at signalized intersections on road network is presented. The movement of vehicles on road network is modeled by cellular automata while the fuzzy inference system is used to obtain optimal traffic signal timing. The performance of fuzzy inference system is determined by the delay time average at signalized intersections. Delay time is addition time required by a vehicle to pass through signalized intersection compared to road without intersection. Cellular automata and fuzzy inference system are running together through computer simulation program. The optimal signal timing from the simulation is compared to fixed time or static scheme which is obtained from historical data of six signalized intersections in Bandung City, Indonesia. The numerical results show that traffic signal duration obtained from fuzzy inference system is more efficient than the existing historical data of observation and it can reduce the level of congestion. The simulation results also show that the traffic signal timing can adjust with the number of incoming and outgoing of vehicles at the intersections on road network. The results can be suggested to the local government to improve the traffic signal system.
Keywords: Optimization, Traffic Signal Timing, Road Network, Fuzzy Inference System, Cellular Automata
1. INTRODUCTION
In big cities with large population, the number of vehicles increases every day. In contrast, there is no improvement of traffic infrastructures such as traffic light at an intersection. It has made traffic congestion is getting worse mainly at intersections. One of the solution to reduce heavy traffic congestion is by readjusting traffic signal with the number of incoming and outgoing vehicles in order to remain proportionate. The solution refers to adaptive setting of traffic light control system.
Fuzzy inference system is a method that can be used to assign an adaptive setting of traffic light control system. Through the adaptive control scheme, timing of the traffic light can be more appropriate with the number of vehicles on each road. There are several methods in traffic light control, such as genetic algorithm [1-3], fuzzy inference system [4-5], queue theory [6], and PSO algorithm [7]. However, fuzzy inference system has not been able yet to give the performance of traffic
light control system. Fuzzy inference system only shows the green light timing without measuring its performance. Therefore, besides fuzzy inference system, it requires another method to measure the performance.
Cellular automata can be used to estimate fuzzy inference system performance. Cellular automata method can model the movement of vehicles [8-9]. By using cellular automata, all vehicle delays at a signalized intersection are stored as information. Then, the information is analyzed so that the performance of any given traffic light duration can be calculated. By combining cellular automata and fuzzy inference system into simulation program, the optimal traffic light timing can be obtained. Fixed time or static traffic light timing which is obtained from historical data of observation can be used as a comparison for fuzzy inference system performance.
results are then compared to fixed time scheme which is obtained from historical data of six signalized intersections in Bandung City, Indonesia. The results of this study are delay time average and optimal green light timing for each signalized intersection. This paper is organized as follows. In Section 2, vehicles movement model on road network using cellular automata is briefly presented. Fuzzy inference system which is used to obtained optimal traffic sginal timing is discussed in Section 3. Simulation setup and discussion of simulation results are presented in Section 4 and Section 5, respectively.
2. VEHICLES MOVEMENT MODEL
Vehicles movement on road networks can be modeled by using cellular automata. Cellular automata can be described as collection of cells or arrays which can change the state in each time step according to certain rules. Here, the rules operate based on the principles of neighborhood system [10]. In cellular automata, the rules are aimed to change the state cells from one time step to the next time step until all iterations are completed. Cellular automata are also used as model to various kinds of physical case studies and some cases that can be transformed into a discrete form [10]. Moreover, in cellular automata, every road characteristic is approached by the actual situation.
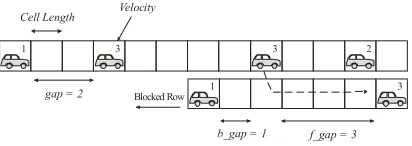
The procedure of vehicles movement using cellular automata consists of change lane rules and movement rules. Change lane rules are operated in order to a vehicle which is represented by a single cell can move to the cell located on the left or right [8]. The change lane rules refer to Von Neumann neighborhood [10]. Illustration of how the vehicles can change the lanes is described in Fig. 1. The change lane of vehicles is addressed only on lanes which certain conditions such as the blocked lanes and or on the lanes with no vehicles. Furthermore, the change lane rules will be assigned if the following conditions are fulfilled [11]:
a. the next vehicle is too near (velocity > gap), b. line next to vehicle is empty,
c. f_gap ≥ velocity,
d. b_gap ≥ maximum velocity,
e. probability to change lane is fulfilled.
The next procedure of vehicles movement is movement rules. The rules are assigned to vehicles so that it can change lane position based on its velocity. According to Nagel-Schreckenberg rules, the position of each vehicle is updated based on its
velocity by using four-step rules, i.e. acceleration, distance adjustment, randomization, and vehicles movement [9].
1 3
3 2
1 3
Cell Length Velocity
b_gap = 1 f_gap = 3
[image:2.612.314.520.141.214.2]gap = 2 Blocked Row
Figure 1: Illustration of change lane rules of vehicles.
The increasing of acceleration and the decreasing of velocity of four-step rules is still static. Acceleration and speed reduction are still in the form of a constant that is one. Therefore, some modifications are applied into the basic rule [11] in order to make the model more dynamics. Here, the variation of acceleration is not only as constant one, but also the value is one until the maximum acceleration value. By this technique, the rate of change of acceleration becomes varies. In addition, the reduction scale of the velocity value for the randomization process is varied between one and the decreasing limit of velocity.
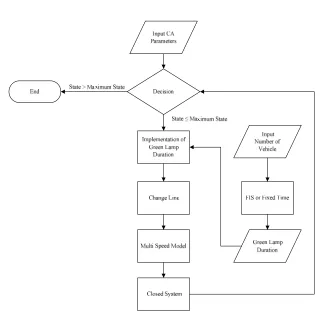
3. FUZZY INFERENCE SYSTEM
Fuzzy inference system is used to determine optimal timing of the traffic light on signalized intersections. Through fuzzy set, it can be represented and addressed various uncertainty parameter. In this case, it can be doubt, inaccuracy, uncomplete information, and partly truth. Fuzzy inference system consists of fuzzyfication, inference, and defuzzyfication [4]. In this study, the process of fuzzyfication, inference, and defuzzyfication use a combined of fuzzyfication trapezoidal-triangular function, Sugeno inference, and weight average defuzzyfication method [11]. Further, Sugeno inference method is used since it has fast computational process. Thus, it appropriates to apply in control system [4]. The combined functions of trapezoid-triangles are used, since based on observations, and also consideration of the utilization of these functions in [12-13], it appears that these two functions have more variation output value so that making it possible to minimize the delay time of vehicles at intersections.
771 Membership function boundaries should be known to use this algorithm. The mechanism of FCM algorithm is by varying the center of the cluster on each iteration until cluster of data being studied was reached [11]. FCM algorithms can be seen in [14]. FCM input consists of variation of the green light duration and the number of vehicles. Grouping parameter in the FCM is the number of linguistic variables that will be used. It is the value of interval grouping to the number of vehicles.
The computation results of FCM are cluster center matrix which can be represented as follows:
[
]
1 32.3351 111.5242 188.5360 254.6073
V =
[
]
2 47.0468 78.8886 91.3305 159.9431
V = .
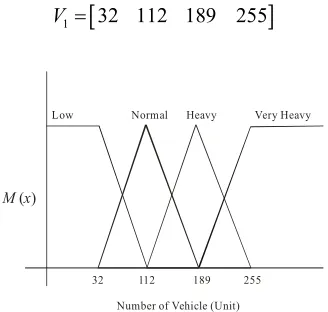
V1 is used as number of vehicle membership
function boundaries and V2 is used as green light
duration membership function boundaries. Because the number of vehicle value must be discrete, then V1 matrix become discrete values:
V1=
[
32 112 189 255]
M x( )
Low Normal Heavy Very Heavy
32 112 189 255
[image:3.612.311.523.345.450.2]Number of Vehicle (Unit)
Figure 2: Membership function of the number of vehicles.
M x( )
Fast Normal Slow Very Slow
47,04681 78,88867 91,33058 159,9431
[image:3.612.92.256.389.545.2]Green Light Duration (time step)
Figure 3: Membership function of green light duration.
After the membership function boundaries have been obtained then membership function for the first and second antecedent are assigned. These antecedent are shown by Fig. 2 and Fig. 3, respectively.
The output of fuzzy inference system is delay time average and green signal timing of each signalized intersection. The green signal duration is given to address a road arm. Each road arm is handled by green light duration one by one (based on its turn). If output of fuzzy inference system produces green light timing in the real number, then the result is rounded using round function because cellular automata model only works on discrete domain.
Table 1 shows fuzzy rules that used in fuzzy inference system. This fuzzy rules are accordance with a design derived from [12].
Table 1: Fuzzy rules.
Low Normal Heavy Very
Heavy
Low Fast Normal Slow Very
Slow Normal Fast Normal Slow Slow Heavy Fast Normal Normal Slow
Very
Heavy Fast Fast Normal Normal
In this study, there are two fuzzy inference system input variables. The first is the number of vehicles on the road arm being addressed to be given the green signal. The second is the total number of vehicles on three other road arms which lined up to be given the green signal. The next process of fuzzy inference system method is fuzzyfication, inference, and defuzzyfication until crisp value of green light duration is produced in each signalized intersection. See [4] for more comprehensive review.
4. SIMULATION SETUP
[image:3.612.90.259.582.701.2]historical data of observation are taken from drones which are placed on six signalized intersections. Moreover, Fig. 6 shows video screen shot which is taken from drone at a signalized intersection. Each intersection is connected to each other. The task of each intersection is addressed sequentially, but the task still works in the one time step period so that it can be said that it is running simultaneously.
The simulation is conducted for road network with six signalized intersections as shown by Fig. 7. The six intersections are located on Bandung City, Indonesia. The six intersections are:
• Soekarno Hatta Street – Ibrahim Adjie Street (Intersection 1)
• Soekarno Hatta Street – Buah Batu Street (Intersection 2)
• Buah Batu Street – Pelajar Pejuang Street (Intersection 3)
• Pelajar Pejuang Street – Gatot Subroto Street (Intersection 4)
• Gatot Subroto Street – Ibrahim Adjie Street (Intersection 5)
[image:4.612.331.486.107.241.2]• Buah Batu Street – Tol Buah Batu Street (Intersection 6)
[image:4.612.139.460.400.711.2]Figure 4: Simulation scenario of cellular automata and fuzzy inference system.
773 Figure 6: Video screen shot of traffic flow at a signalized intersection in Bandung City, Indonesia.
[image:5.612.95.286.261.489.2]Figure 7:Road network with six intersections.
Table 2: Fixed time of green signal based on historical data of observation for six signalized intersection in
Bandung City, Indonesia.
Inter-section
Fixed time (in seconds)
West South North East
1 90 60 90 195
2 65 80 110 130
3 50 85 0 50
4 50 105 110 135
5 65 45 45 65
6 25 30 30 0
Fixed time green signal from historical data at six signalized intersections are summarized in Table 2. Data from this table are then used as initial
condition for fuzzy inference system. The historical data of observation and simulation results only show green light duration. However, it is easy to compute red light duration if green light duration of each road arm is known.
5. RESULTS AND DISCUSSION
Output of fuzzy inference system and fixed time scheme is then analyzed to measure the performance. The output of simulation is delay time average and traffic light timing on road network with six signalized intersections. Delay time is addition time required by a vehicle to pass through signalized intersection compared to road without intersection.
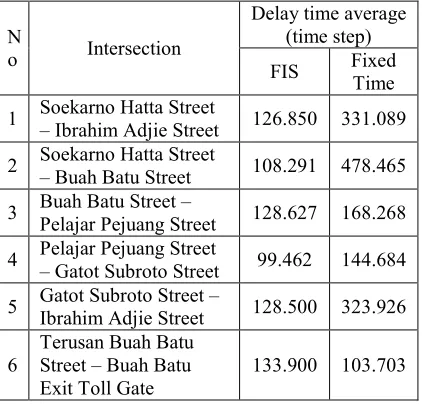
[image:5.612.314.525.466.668.2]Delay time average obtained from simulation for six intersections is summarized in Table 3. It can be observed from the table that the delay time average resulted by the fuzzy inference system is faster than the fixed time scheme except for Terusan Buah Batu Street – Buah Batu Exit Toll Gate intersection. It can be revealed that fixed time (historical data) has inappropriate green light duration which yields longer delay time average. However, in fact, the FIS has a mechanism that can produce more appropriate green light duration than fixed time scheme.
Table 3: Delay time average obtained from simulation.
N
o Intersection
Delay time average (time step)
FIS Fixed
Time
1 Soekarno Hatta Street
– Ibrahim Adjie Street 126.850 331.089
2 Soekarno Hatta Street
– Buah Batu Street 108.291 478.465
3 Buah Batu Street –
Pelajar Pejuang Street 128.627 168.268
4 Pelajar Pejuang Street
– Gatot Subroto Street 99.462 144.684
5 Gatot Subroto Street –
Ibrahim Adjie Street 128.500 323.926
6
Terusan Buah Batu Street – Buah Batu Exit Toll Gate
133.900 103.703
[image:5.612.102.290.573.679.2]six level from A to F. On heavy traffic, the delay time may approach to level F. On low traffic, the delay time may approach to level A. Table 4 displays LoS criteria based on delay time average value. The smallest delay time resulted the best level of service obtained. Moreover, the smaller delay time average, the more efficient system performance. It can also be seen from Table 3 and Table 4 that both FIS and fixed time include in level F. The results depict that all signalized intersections are in heavy traffic congestion. However, in this case, delay time average of FIS is smaller than fixed time scheme. Therefore, the FIS scheme yields more efficient green signal timing than fixed time scheme.
From the simulation results, for most of signalized intersections, one cycle duration of FIS is achieved faster than fixed time scheme. One cycle duration is total time of green and yellow light in one lap. The red light duration is only as a result from the implementation of the yellow and green light. The delay time can be reduced when the traffic light setting is appropriate. If the timing of the green light is appropriate with the traffic condition, then the red light timing is more optimal and timing of one cycle is more efficient.
Table 4: Level of Service Criteria
LoS Delay time
(second)
A t ≤ 10
B 10 <t ≤ 20 C 20 <t ≤ 35 D 35 <t ≤ 55 E 55 <t ≤ 80
F t > 80
[image:6.612.332.503.130.292.2]Table 5 until Table 10 reveals optimal timing of green signal using FIS scheme for six signalized intersections in Bandung city. The simulation is running for 10 cycles. From these tables, it can be seen that all signalized intersections have faster green duration compared to fixed time listed in Table 2. It is also can be observed that in each cycle, the green light duration is changed adjusting with number of vehicles. From these results, it can be said that by adjusting the green light duration with the number of incoming and outgoing vehicles, the delay time is faster than without optimization so that traffic congestion at signalized intersection can be reduced.
Table 5: Optimal timing of green signal using fuzzy inference system (FIS) at Soekarno Hatta Street –
Ibrahim Adjie Street.
Cycle Green signal (in seconds) West South North East
1 79 47 63 78
2 76 47 62 66
3 69 47 55 61
4 61 47 57 60
5 59 47 53 60
6 56 47 54 57
7 56 47 57 58
8 65 47 51 60
9 55 47 49 60
[image:6.612.333.503.352.501.2]10 67 47 50 61
Table 6: Optimal timing of green signal using fuzzy inference system (FIS) at Soekarno Hatta Street – Buah
Batu Street.
Cycle Green signal (in seconds) West South North East
1 50 62 71 82
2 47 59 52 71
3 51 47 76 68
4 58 47 47 63
5 61 47 66 60
6 63 47 82 65
7 61 47 47 61
8 62 47 69 65
9 65 47 47 62
[image:6.612.126.263.443.543.2]10 63 47 67 61
Table 7: Optimal timing of green signal using fuzzy inference system (FIS) at Buah Batu Street – Pelajar
Pejuang Street.
Cycle Green signal (in seconds) West South North East
1 47 47 0 47
2 47 72 0 47
3 47 55 0 47
4 47 61 0 47
5 47 61 0 47
6 47 47 0 47
7 47 59 0 47
8 47 51 0 47
9 47 49 0 48
[image:6.612.333.503.556.713.2]775 Table 8: Optimal timing of green signal using fuzzy
inference system (FIS) at Pelajar Pejuang Street – Gatot Subroto Street.
Cycle Green signal (in seconds) West South North East
1 49 57 54 84
2 47 58 47 69
3 47 53 47 54
4 47 55 47 47
5 47 47 47 47
6 47 49 57 47
7 49 56 47 47
8 47 53 47 47
9 47 49 47 47
[image:7.612.111.279.341.498.2]10 47 56 52 47
Table 9: Optimal timing of green signal using fuzzy inference system (FIS) at Gatot Subroto Street – Ibrahim
Adjie Street.
Cycle Green signal (in seconds) West South North East
1 47 47 47 47
2 47 57 47 47
3 47 55 47 47
4 47 49 47 47
5 47 51 47 47
6 47 57 47 47
7 47 64 47 47
8 47 64 47 47
9 47 65 47 47
10 47 66 47 47
Table 10: Optimal timing of green signal using fuzzy inference system (FIS) at Terusan Buah Batu Street
– Buah Batu Exit Toll Gate.
Cycle Green signal (in seconds) West South North East
1 47 47 53 0
2 47 47 57 0
3 47 47 47 0
4 47 47 47 0
5 47 47 53 0
6 47 47 47 0
7 47 47 49 0
8 47 47 49 0
9 47 47 47 0
10 47 47 50 0
Traffic signal timing using FIS scheme has made an adaptive regulatory system. In this study, an adaptive traffic system is defined as the decision of traffic signal timing depends on the number of vehicles that was predicted from the simulation not from real traffic situation. In general, the duration of the green light resulted from FIS scheme is lower than the duration of the green light resulted from fixed time scheme. If the duration of green light is lower, then the duration of the red light becomes faster. If the adjustment of green light duration is appropriate with the state of the queue of vehicles, then the delay time can be reduced so that the level of traffic congestion can be reduced. The results can be suggested to the local government to improve the traffic signal system.
5. CONCLUSION
Optimization of traffic signal timing has been successfully conducted via numerical simulation. Cellular automata were used to model vehicles movement on the signalized intersections and fuzzy inference system was used to optimize the duration of traffic light for each signalized intersection. The numerical results show that fuzzy inference system method is more efficient than the existing historical data of observation and it can reduce the level of congestion. Further, it has been shown that fuzzy inference system can generate delay time average faster than the fixed time scheme and the traffic signal timing can adjust with the number of incoming and outgoing of vehicles at the intersections on road network in Bandung city, Indonesia. The future works of this research are implementation to the real time, parallelization of the algorithm, and vehicles movement can be adjusted based to the driver behavior.
ACKNOWLEDGEMENTS
This research was funded by HIBAH
BERSAING RISTEKDIKTI, Grant No.
2435/K4/KM/2016. Thank you for RISTEKDIKTI for supporting this research.
REFRENCES:
[image:7.612.112.280.547.703.2][2] A.H. Farooqi, A. Munir, A.R. Baig, “The Traffic Light Simulator and Optimization using Genetic Algorithms”, in International Conference on Computer Engineering and Applications, 2009, pp. 290-294.
[3] L. Singh, S. Tripathi, H. Arora, “Time Optimization for Trafic Signal Control using Genetic Algorithm”, International Journal of Recent Trends in Engineering, Vol. 2, No. 2, 2009, pp. 4-6.
[4] Suyanto, Artificial Intelligence (Searching,
Reasoning, Planning, dan Learning).
Bandung: Informatika, 2011.
[5] K.K. Tan, M. Khalid, R. Yusof, “Intelligent Traffic Control by Fuzzy Logic”, Malaysian Journal of Computer Science, Vol. 9, No. 2, 1996, pp. 29-35.
[6] O.Z. Tamin, Perencanaan Pemodelan Transportasi (Contoh Soal dan Aplikasi). Bandung: Institut Teknologi Bandung, 2003. [7] K. Zine-dine, A. Madani, “Using PSO
Algorithm for The Traffic Lights Setting Problem with Cellular Automaton Model”,
Journal of Theoretical and Applied
Information Technology, Vol. 53, No. 1,
2013, pp. 89-93.
[8] J. Wahle, L. Neubert, J. Esser, M. Schrekenberg, “A Cellular Automaton Traffic Flow Model for Online Simulation of Traffic”, Parallel Computing, Vol. 27, No. 5, 2001, pp. 719-735.
[9] K. Nagel, M. Schreckenberg, “A Cellular Automaton Model for Freeway Traffic”, Journal de Physique I, Vol. 2, No. 12, 1992, pp. 2221-2229.
[10] C. Bastien, D. Michel, Cellular automata
Modeling of Physical Systems, United
Kingdom: Cambridge University Press, 1998. [11] S.N. Kudrat, Y. Sibaroni, E.B. Setiawan, “Simulasi Pengaturan Lampu Lalu Lintas Menggunakan Cellular automata dan Fuzzy Inference System”, Indonesia Symposium on
Computing, 2015.
[12] B. Irawanto, D. Kurniawan, “Penerapan Sistem Inferensi Metode Min-Max dalam Logika Fuzzy untuk pengaturan Traffic Light”, Jurnal Sains & Matematika (JSM), Vol. 18, 2010, pp. 27-36.
[13] R.W. Wahyu, L. Afriyanti, “Aplikasi Fuzzy Inference System (FIS) Metode Tsukamoto pada Simulasi Traffic Light Menggunakan Java”, Seminar Nasional Aplikasi Teknologi Informasi), 2009, pp. 104-107.
[14] S. Kusumadewi, S. Hartati, Neuro-Fuzzy (Integrasi Sistem Fuzzy dan Jaringan Syaraf). Yogyakarta: Graha Ilmu, 2010.