ORIGINAL RESEARCH ARTICLE
REVIEW ON OUTLIER-TOLERANT DATA PROCESSING
WITH APPLICATIONS
1*
Hu Shaolin,
2Feng Binqing and
3Lei Yarong
1
School of Automation, Foshan University, Foshan, 528000, China
2
Key Laboratory of Fault Diagnosis and Maintenance of Spacecraft, Xi’an, 710043, China
3
School of Automation and Information Engineering, Xi’an University of Technology, Xi’an, 710048, China
ARTICLE INFO ABSTRACT
Owing to the complexity of sampling and running environment, abnormal data such as outliers as well as patchy outliers widely appear in a variety of data from engineering to economic fields. These abnormal data have remarkable bad impact on parameter statistics, system identification, state monitoring, process control, machine learning, decision analysis, and so on. In order to avoid bad impact from abnormal data, a new idea of outlier-tolerant computation was put forward in just the past two decades. In this paper, a brief review is given to describe some major progress and prominent approaches in these fields including tolerant parameters estimation, outlier-tolerant identification, outlier-outlier-tolerant filtering and outlier-outlier-tolerant prediction etc. At the end of this paper, several open problems are pointed out for further research.
*Corresponding author
Copyright ©2017,Hu Shaolin et al. This is an open access article distributed under the Creative Commons Attribution License, which permits unrestricted use, distribution, and reproduction in any medium, provided the original work is properly cited.
INTRODUCTION
There are at least two compound words corresponding to the tolerance in the international fields of academy and technology: one is the fault-tolerance which is widely used in control engineering and computer science fields, and the other is outlier-tolerance for data processing with a few outliers in sampling set. The former term fault-tolerance was first given in the international academic conference on the computer science in the early 1980s. Then it was quickly adopted and referenced by the fault detection and diagnosis of the control system and related fields. Recently, the meaning of fault-tolerance was fixed to the "system or process can still work properly under failure conditions" in control engineering and computer system. The latter term outlier-tolerance, which appeared in mid 1990s (Hu Shaolin et al.,1993; Dose and Linden,1998; Fan Jincheng and Hu Shaolin,1995) later than fault-tolerance, is used in the research to resist outliers as well as patchy outliers in sampling data.
Outliers are data-oriented concept. In engineering sample data (e.g., spacecraft telemetry data), outlier is widespread and directly affects the implementation of various data processing approaches existing in classical statistics inference process control. In this paper, much attention will be paid to outlier- tolerance. In other words, the tolerance belongs to the category of outlier tolerance in this paper.
OUTLIER AND ITS APPEARNCE
There are many different definitions of the outlier in different fields such as statistics and data processing. Generally, outlier is widely described as sample which significantly deviates from most sample centers in statistics. This definition was popularly in statistics, and there were quite a lot of statistical processing approaches such as Jacknife and outlier removal which were based on this definition. But, it is a little pity that this definition does not fit for many fields such as control engineering and signal processing. In these fields, most of the sampling data are changed in different time instants.
ISSN: 2230-9926
International Journal of Development Research
Vol. 07, Issue, 10, pp.16039-16046, October,2017
Article History:
Received 09th July, 2017 Received in revised form 14th August, 2017
Accepted 17th September, 2017 Published online 10th October, 2017
Key Words:
Outlier-Tolerant Computation, Outliers,
Patchy Outliers, Data Diagnosis.
Citation: Hu Shaolin, Feng Binqing and Lei Yarong. 2017. “Review on Outlier-tolerant Data Processing with Applications”, International Journal of Development Research, 7, (10), 16039-16046.
Fig 1 is the scatter plot of the typical telemetry data series with many isolated outliers as several patchy outliers, although the absolute values of these outliers are not significantly larger than the absolute values of other data.
Fig. 1. Telemetry Data with Outliers
In 1996, an universal definition was put forward to describe which are outliers (Fan Jincheng and Hu Shaolin et al.1996). Using this definition, outliers are the significant part of the data that tends to deviate from most of the data trends. This definition includes the earlier definition as part of it. Generally, there are quite a lot of reasons which result in outliers, such as faults of sensors, mistaking operation, data logging errors, signals with error codes, as well as other causes. The manifestations of outliers are also varied, such as a single isolated anomaly data and the patchy abnormal data appearing in a slice. For the patchy outliers, there may be some relevance among abnormal data, which is more difficult and complicated to process than in the situation of the single outlier.
Due to complexity of the actual engineering sampling and measurement as well as system environment, some impure or abnormal data inevitably appear in the measurement data sets or sampling time series. For example, in the aerospace measurement & control project, no matter how carefully the operator works, there are inevitable some deviation from the real situation or trend of most data in the measurement data obtained by radar tracking aircraft. Moreover, the probability of occurrence of abnormal data will be different in difference tracking environments and dynamic performances of radar. The probability of abnormal data is even as high as 5% during dynamic change stages such as shutdown action of the launch vehicle and radar tracking situation at high elevation.
Outliers exiting in sampling data threatens the availability and effectiveness of existing classical optimal control and data processing algorithms (e.g., various algorithms of system identification, statistical inference and state estimation which are based on the famous least-squared principle), and even leads to algorithm collapse or control failure. It has been confirmed by a large number of engineering practice that a series of widely-adopted classical data processing algorithms (e.g., least-squared estimation, polynomial filtering, Kalman filtering, power spectrum analysis, etc.) are established under the basic normal model assumptions and process variations, quite a lot of different algorithms of state estimation and control, which are based on the above assumptions stated above, would be affected by outliers seriously and even results in the catastrophic consequences when which are used in some engineering projects. It is valuable to explore the techniques of outlier diagnosis and processing in engineering as well as in theory research. How to effectively eliminate the negative effects of outliers on the classical data processing algorithms
stated above, which can be implemented by either improving the existing algorithms to make them outlier-tolerant or developing new outlier-tolerant data processing algorithms, is an urgent research task and problem faced by scientists working on the data processing and engineering control and other widely related fields. In the actual control process of dynamic system, the destructive effect brought from outliers is not negligible. For instance, the failure of the launch of the Titan IV carrier rocket in April 1999 was due to data abnormality, resulting from incorrect constant being used in navigation software (Bodson,2000;Pearson,2002). In Gutman and Nilsson (1998), the model identification of the control process of cardboard production was described that most of the efforts were spent in dealing with outliers as well as missing data. Professors Menold and Person (1971) pointed out that it is undistinguished that outliers appears in measurement data in practical fields of control and engineering and that outliers maybe seriously destroy the action and result of controller in some control applications (what is more, in PID control). J M Chen and H S Chen (2000) also indicated that the key factor, which may determine whether the feedback control arrives at success or not, is to select and to use reliable measurement data which related with the controlled variables, A lot of theoretic analyses and computation results in Hu Shaolin et al (1998) showed that some classical algorithms, such as the Kalman filtering algorithms, the LS (least squared) and RLS (recursive LS) identifications, are lack of the abilities of outliers tolerance.
For the process control systems, the typical manifestation of outliers is a significant deviation from the variation trend of the process object. It is very complicated for us to distinguish the effects of outliers coming from different causes, different sources and different manifestations of outliers on different computational methods and data processing results. Since more than half a century ago, the techniques of diagnosis and elimination for outliers have been hot topics in many fields, such as quality control, data diagnosis and engineering signal processing. In recent 20 years, the outlier-tolerant computation techniques became a new branch of data processing in the case that there are outliers in samples. In this paper, along with the analysis of bad effects of outliers, many different aspects of outlier-tolerance computation are summarized, and a simple review is given to point out which are the undeveloped branches of outlier-tolerant computation.
METHODS TO DEAL WITH OUTLIERS
With respect to the isolated outliers and patchy outliers, the typical approach can be broadly divided into two main lines: one it to diagnose and to repair / remove outliers, and the other is to compensate or to build outlier-tolerant algorithms. These two approaches are different in treatment ideas and usable environment as well as objects.
To Repair / Remove Outliers
Before 1980s, the research on outliers processing techniques mainly focused on the one-dimensional or multi-dimensional re-sampling statistical sample set. As early as 1887, Edgeworth defined outlier as “sampling data which obviously deviate from the observations of other observations in the sample set” (Ferguson,1961), and many scholars who explored and researched technique to deal with outliers. The mainstream methods were to design or to use various statistics to identify and eliminate outliers. This Edgeworth‘s definition had influenced for almost a century until the 1970s. Since 1980s, the research on outlier processing techniques has been gradually changed from the re-sampling process to the outlier processing in time series. In 1984, Kunsch proposed the outliers generation model from the viewpoint of robustness of time series analysis method. The adaptive outlier (AO) model and the Innovation outlier (IO) model were given. The characteristics of outliers in AO model and IO model are discussed. The outliers in the sampling sequence are divided into three categories: the isolated anomaly data, the dependent anomaly data and the patchy outliers (Kunsch ,1984). For the problem of outliers in process control and sampled time series, some early researches attempted to follow Edgeworth's definition of resamples, and focus on outlier recognition and elimination. Some typical research approaches includes the clustering analysis, Box-Tiao algorithm based on Bayes method and Kullback-Leibler distance based on influence measure (Box, 1979; Battaglia and Orfei,2005), and so on.
For the problem of outlier definition in sampled data series, Hu Shaolin (1993) described the outliers as "A small portion of the sampled data set that deviates significantly from the trend presented by most data". This definition is from the practical needs of engineering signal processing and is based on the rational description of outlier generation model given by Professor Kunsch (1984). Lately, Dose and Linden (1999) gave outlier a definition similar to the definition in Hu Shaolin (1993). This modified definition emphasized the trend of subject data as the indicator to judge whether the sampling data is abnormal or not, and clearly points out that the abnormal data is only a small part in the sample set. Obviously, this new definition is intuitively reasonable. This definition not only covers ourliers in the simple random sampling scenario and time series, but also covers outliers determined by the definition given by Edgeworth (1887). Moreover, the new definition covers outliers in the dynamic measurement data series as well as those in the stochastic system.
However, the process sampling data series are different from repeatable sampling data set, the parameter estimation in time series analysis as well as in process system are different from the statistical inference under iid sample data set. In this case, the Edgeworth's definition of outliers for repeatable sampling set begins to show up. What is more, if the outliers are removed, the problem of unequal interval sampling data sequence may bring difficulties to analyze the time series with outliers.
To Outlier-tolerantly Deal with Outliers
Taking into account the actual problem that the unequal interval sampling caused by eliminating outliers from the sampling data sequence, the mainstream idea is robust-resistant processing or compliance processing in 1980s. From Hampel's qualitative robustness, Huber Minimax robustness, Tukey's exploratory data analysis to Rousseeuw and other
infinitesimal robust ideas, most results are directly or indirectly associated with outliers processing technology. Hampel (1971) pioneered work on qualitative robustness. In this field, the extensive research and application of statistical algorithms should be attributed to Huber (1981) and Hampel et al (1986) minimax robustness and infinitesimal robust system framework based on the influence function. Based on the framework of the above system, a series research results appeared in Hu Shaolin (1993) and Fan Jingcheng et al (1996). Representative work, such as Dose and Linden's work on the outlier-tolerant estimation of parameters (Dose and Linden, 1999) as well as bounded influence identification, received attention and cited by the academic community. In Chatzis et al (2009) and Karel et al (2009), outlier-Tolerant technique is applied to data sequence; Pesonen used outlier-tolerant Bayesian filters for integrated monitoring of GNSS positioning (Pesonen,2009); Prof. Hanson of Los Alamos National Laboratory proposed outlier-tolerant likelihood function and
computational method (Hanson,2005); the software
STATISTICA Neural Networks even introduced outlier-tolerant into system modeling and some tracking prediction learning process; some outlier modeling and data recognition method were described respectively from the repeatable sampling situation of one-dimensional as well as multi-dimensional sample data in dynamic-measurement systems (Hu Shaolin,1993; Fan Jincheng and Hu Shaolin,1996). And, a series of new detection method and diagnosis algorithm, such as robust-likelihood ratio test, are built for outliers in dynamic measurement data set.
In the aspect of outlier-tolerant processing of outliers as well as patchy outliers, a Rd-type minimax robust estimation of multivariate position vectors was given in Fan Jincheng and Hu Shaolin (1995), which solves the problem of fault-tolerant estimation of mean in the ergodic stationary multidimensional sampling processes. A new kind of bounded influence (BIF-) estimation of coefficient parameters in the linear regression model and a new state-of-the-art BIF-filter fault-tolerant algorithm of state vectors in dynamic system were proposed in Hu Shaolin et al (1999,2003) respectively, which successfully applied to the fault-tolerant attitude control of spin stabilized satellites. Based on fact that the median estimation is the most robust estimation of mean in the case of repeatable samples (Huber,1981; Hampel,1986), two practical double median outlier-tolerant filtering algorithms, the I-type and II-type double median fault-tolerant filters, are constructed in Hu Shaolin et al (2004) as well as in Hu Shaolin and Huang Liusheng (2004),which were widely used in data analysis and processing of the spacecraft’s state monitoring and spaceflight control engineering.
DESIGN OF OUTLIER-TOLERANT ALGORITHMS
Multiple branches of the control engineering and the signal as well as data processing are involved in some practical problems to scientifically and rationally overcome outliers. In this section, several outlier-tolerant algorithms are presented, including parameter tolerant estimation, system outlier-tolerant identification, signal outlier-outlier-tolerant filtering and state outlier-tolerant prediction. The outlier-tolerant ability of these algorithms is illustrated by some examples.
Practical Design Ideas
Assuming that there are a series of sampling data series
1
{ , , N}
S y y
do some stochastic decision, in order to overcome bad influence coming from outlier outlier ykS, a reasonable idea
is design a bounded odd function set shown in Fig 2
Lower Boundary Upper Boundary
x F(x)
Hampel Function
Redescending Function
Huber Function F(x)=x
Fig. 2. Bounded Odd Function
Using sample set S{ ,y1,yk1,yk1,yN} to design a
statistics ˆ( )S to estimate the true value of sample ykS, a
reasonable idea is to substitute the outlier sample ykS with
ˆk
y as follows
ˆk ( ) ( k ( ))
y S F y S (1)
where the function F (x) can be optimally selected from odd bounded functions. In Fig 2, there are three typical odd functions, the Huber’s function, the Hampel’s function and the redescending functions which are commonly used in robust statistics. It can be sure that the statistical reference which is based on the data set S{ ,y1,yk1,y yˆk, k1,yN} is
outlier-tolerant against outlier ykS. In fact, using the bounded odd
function shown in Fig 2 can sufficiently absorb useful and resist error information from the sample ykS. By the way,
this method can be extended not only to the case with multiple outliers but also to the case that the samples are multi-dimensional.
Examples 1. Faul-Tolerant Statistics
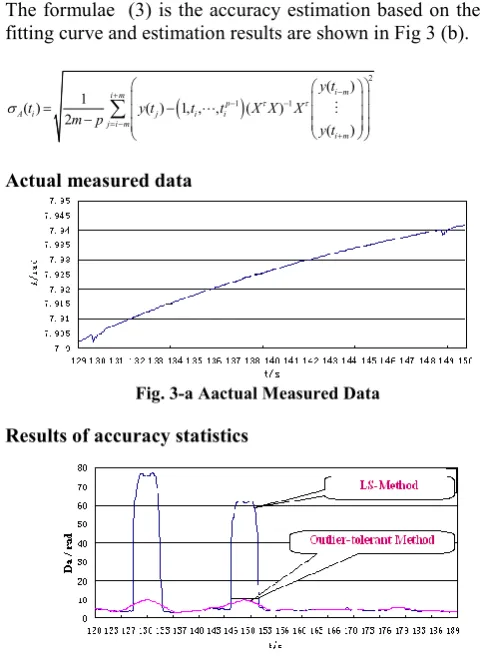
How to accurately estimate the precision of the process measurement data is an old problem. Some classical methods mainly include the statistical curve fitting method based on the least squared principle and residual statistical methods based on difference of data sequence. A large number of data processing practices reveal that when the measured data are normal, the results using the differential method are often small and the LS curve fitting results are often larger than the actual values. However, when there are outliers or patchy outliers in the measured data, the statistical results may deviate from the actual situation and even distort, whether by the difference method or the LS method. In order to overcome this puzzle, a modified algorithm is introduced in this section (Hu Shaolin and Huang Liusheng,2010) to deal with data shown in Fig 3-a, which are the azimuth measurement data series coming from the process of tracking a space flight target. There are two data segment which are abnormal in 129.70s ~130.50s and 148.60s~149.35s, including two patchy outliers, the former is with 16 outliers and the later 13 outliers. Let us abbreviate this sampling time series as { ( ),y t1 , ( )}y tN . In
order to determine the accuracy of this measurement data
series, a sliding window processing method is employed to construct a (2m1)p order matrix for measuring data in time window [ti1,ti m ]
1
1 1
1
p
i m i m
p
i m i m
t t
X
t t
(2)
The formulae (3) is the accuracy estimation based on the LS fitting curve and estimation results are shown in Fig 3 (b).
2
1 1
( ) 1
( ) ( ) 1, , , ( ) 2
( )
i m i m
p
A i j i i
j i m
i m y t
t y t t t X X X
m p
y t
(3) [image:4.595.61.263.98.236.2]Actual measured data
Fig. 3-a Aactual Measured Data
Results of accuracy statistics
Fig. 3.b the LS and Outlier-tolerant LS Etimation of Accuracy
Red line in Fig 3-b tells us that the accuracy of the local segment are obviously distorted due to the negative effect of patchy outliers in the measured data series.
In order to overcome the negative effects of outliers on the accuracy estimation algorithm (3), a threshold functionF x c( , )
as shows in Fig 2
, ( , )
,
x x c F x c
c x c
(4)
and an outlier-tolerant algorithm is constructed as follows
2 1
2 0
( ) 1
( ) ( ) ( , , ) ,
2
( )
A
i s i m
c p
i j i i
j i m
i s
y t
t F y t t t X X X c
m p
y t
(5)
where,
, , ˆ
1.483 { ( )j ( )}j
j i m i m
c med y t y t
,and
10
( ) ˆ( ) ( , , )
( )
ˆ ˆ
( ) ( ) ( ( ) ( ), )
i s p
i i i
i s
i i i i
y t y t t t X X X
y t
y t y t F y t y t c
[image:4.595.304.548.162.498.2] [image:4.595.308.546.196.356.2]The results of outliers-tolerant LS fitting algorithm (5) are shown as blue line in Fig 3-b. It can be find out from Fig 3-b, the outlier-tolerant statistical results is significantly better than the statistical results using the ordinary LS algorithm.
Example 2: Outlier-Tolerant Identification
It is well known that the model (7) is widely used in application statistics, time series analysis, econometrics, engineering signal processing and process control theory, etc.
, 0
( 1, , )
m
i j i j i
j
y b x
i n
(7)Assuming that the sample set Dn{( ,y xi i,1,,xi m, ) |i1,, }n
comes from the regression model (7), the LS identification algorithm of the model coefficient is
1 ( )
ˆ ( )
L S n An An A Yn n
(8)
where,
1 1 1
, , .
i
i n n
im n n
x y
A Y
x y
A large number of theoretical research results confirm that the LS estimators of model parameters has excellent statistical
properties (eg,unbiased, consistent, uniform minimum
variance estimation, etc). However, if there are outliers included in the measurement data set Dn, the LS identification
values of the model parameters are sensitive to outliers, and the practical application is not as satisfactory as the theoretical analysis. Hu Shaolin and Sun Guoji (2003) pointed out the reason why the LS identification algorithm is sensitive to outliers not only in theoretical analysis but also in practical calculation. In fact, the LS identification (8) can be express as a recursive algorithm
1 1 1
1 1
( )
( 1) ( ) 1 ( ) 1 1 ( )
ˆ
ˆ
n n n(
ˆ
)
n n n n
A A
LS n LS n A A
y
n n LS n
(9)In order to enhance outlier-tolerance, a modified LS identification, which is very similar with formulae (9), was built in Hu Shaolin et al (1999):
1
1 1 ( ) 1
1 1
1 1 1 1
ˆ ( )
( 1) ( ) 1 ( ) 1 ( )
ˆ
ˆ
n n n(
n n LS n)
n n n n n n n n
y A A
LS n LS n A A
F
A A
(10)Hu Shaolin et al (1999) proved that the optimal outlier-tolerant unbiased function is given as follows
,
( )
,
,
x
x
c
F x
c
x
c
c
x
c
(11)
in the bounded function set
|
(
)
( ),sup
( )
C
x R
F F
x
F x
F x
c
(12)Using the linear modely t( )b0b t1 b t2 2
( )t with normalstochastic perturbation
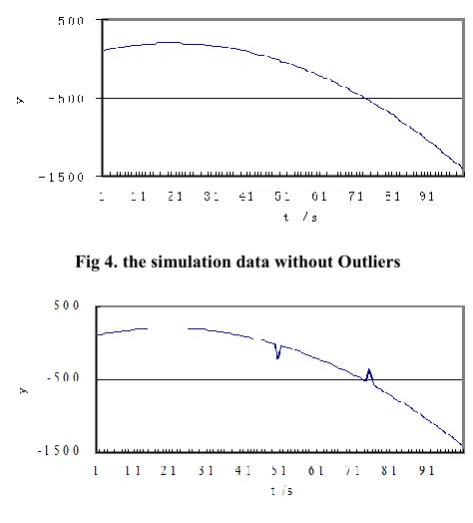
( ) ~t (0,1) and the model parameters ( , ,b b b0 1 2)(100.0,10.0, 0.25) , the Monte Carlo [image:5.595.314.551.144.406.2]method is used to generate 100 sets of sampling data, and the 50th and 75th data values are offset to form two anomaly data points respectively, as shown in Fig 4.
Fig 4. the simulation data without Outliers
Fig 5. Simulation Data with Outliers
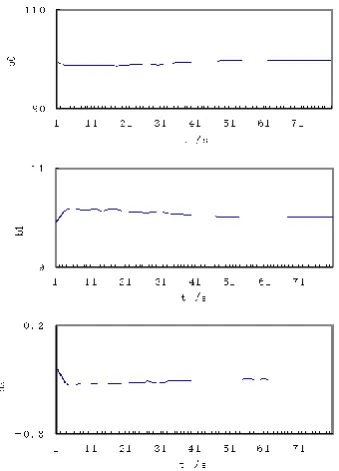
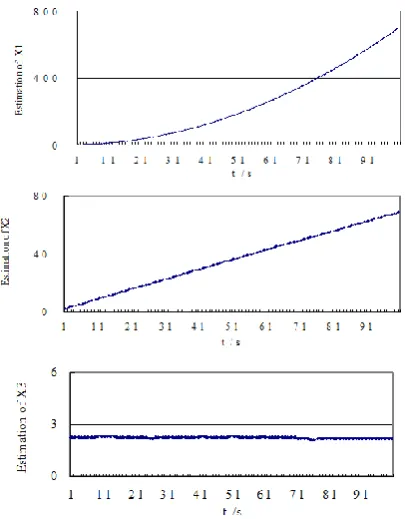
[image:5.595.320.549.152.257.2]Algorithms (9) and (10) are respectively used to identify the model parameters of the model. A series of identification results are shown in Fig 6 and Fig 7.
Fig 6. RLS Estimation of Model Coefficients
[image:5.595.330.532.473.717.2]
algorithm (10) has good tolerance when the measured data set contains a small amount of outliers.
Fig 7. Outlier-tolerant Estimation of Model Coefficients
Example 3: Outlier-Tolerant Filtering
In the last decade, a large number of research results revealed that the famous Kalman filter lacks outlier-tolerance against outliers even if there are a few outliers in sample set. In order to modify the Kalman filtering algorithms, the following linear dynamic model ) , ( 1 1 1 1 1 1 m k n k k k k k k k k k R y R x x H y x A x
(13) is used and the bad effects of outliers to the Kalman filter are analyzed in Hu Shaolin and Huang Liusheng (2010). For the linear system model (13), the Kalman filter can be expressed as the following recursive algorithm
) | ( 1 1 1 ) | 1 ( ) | ( 1 ) | ( 1 ) 1 | 1 (ˆ
ˆ
ˆ
ˆ
ˆ
k k k k k k k k k k k k k k kx
A
H
y
E
E
K
x
A
x
(14) and a set of outlier-tolerant filtering algorithm (Hu Shaolin and Huang Liusheng,2010) is proposed as follows
) | 1 ( 1 1 ) | 1 ( 1 ) | 1 ( 1 1 ) | ( 1 ) 1 | 1 (ˆ
ˆ
ˆ
)
(
F
~
~
k k k k k k k k k k k k k k kE
G
E
r
E
r
K
x
A
x
(15)where, the filtering gain 1 1 1{ 1 1 1 ( 1)}1
k k k k k k
k H H H R
K and ) ( 1 1
1 k ( k k) k k k
k A I K H A R
, R(k)cov(k,k) and
) , cov( )
(k k k
R . TheGk1 is the weight matrix and the
function F(r)is smooth piece by piece, which is called as function to compress influence from outliers. In order to make sure the modified filtering algorithm has the ability to resist outliers, a reasonable idea is to select F(r) appropriately, so
that F(r) is close to zero when rk1 large enough. Under the
ellipsoidal distribution of the basic stochastic series, it was proved (Hu Shaolin et al. 1993) that the matrix sequence
) 1 ( 1 1 1
1
k k k k
k H H R
G
the maximal eigenvalues of which is
k and the F-function is equal to the following function:2 2 1 2
1,
0
( )
(
)
,
k k k k c c k kr
F r
c
r
r
(16)The following simulation example (Hu Shaolin and Huang Liusheng, 2010) explain how about the bad effects of outliers on the Kalman filtering results: the dynamic system model of system structure is described as follows
1
1 1 1
1.0 0 0
0.2 1.0 0
0 0.3 1.0
0.9 0 0
0 0.2 0.7
k k k
k k k
x x y x (17)
The model assumptions is normal and the sample time series {y kk, 1, 2, 3,}contains two outliers data with amplitudes
1
1 2
( 1) 100
( 50,75) ( 1) 5
i i y i y (18)
Selecting the beginning value of states as follows
1(0|0)
2(0|0) (0|0)
3(0|0)
1.3 0.01
1.5 and 0.01 0.01 2.3 x x x (19)
Fig 8 shows the results of the recursive estimation using the Kalman filtering algorithm to estimate the state vectors of the linear system (17) with two outliers. It is obvious from Fig 8 that the impacts of outliers on the Kalman filtering estimation (14) of the state vectors are not ignorable. It also shows that even for a single outlier, the effect is not instantaneous but will last for a long time; and for patchy outliers, their impacts are more complex and significant.
[image:6.595.308.519.424.468.2][
[image:6.595.346.526.577.780.2]The outlier-tolerant filtering estimation of the states are computed by the formula (15). The Kalman filtering results are shown in Fig 9, which verified the outlier-tolerance capability of the outlier-tolerant filtering algorithm (15).
Fig 9 Outlier-tolerant Filtering Values of State Vector
Comparing Fig 8 with Fig 9, it can be found out that outliers have a very significant adverse effects on Kalman filter and that the outlier-tolerant algorithm can overcome the adverse effects of outliers and improve the reliability of the filter estimation.
SOME MORE PROGRESSES AND OPEN ISSUES
Data diagnosis and outlier-tolerant processing in dynamic system is a new research field, which is directly oriented to the measurement and control engineering. It is also an important research direction of system reliability and security technology. As long as there is measurement data there is data processing. And, outliers are very widely found in many different fields such as process control and signal processing. In this case, it is very important how to deal with outliers from measurement data. It can be sure that it is attractive and valuable to improve outlier-tolerant abilities of some classical algorithms and to build new outlier-tolerant algorithms.
In addition to the method described in formulae (1), there are a variety of ways to design new outlier-tolerant algorithms, such as the outlier-tolerant twice median filter of Type I and Type-II for non-stationary signals proposed in Hu Shaolin &Huang Liusheng (2004a, 2004b) respectively, the high-verisimilitude outlier-tolerant Q-filtering algorithm for dynamic measurement data (Hu Shaolin, et al, 2016). These three kinds of filtering are based on the property that the median is the most robust in statistical estimators of mean. Voulodimos et al (2010) used the multivariate Student-t distribution as the observation likelihood to further enhance robustness and built the outlier-tolerant fused hidden Markov models to evaluate the performance under real-life visual behavior understanding scenarios. As for applications of
outlier-tolerant computation, Li Yue et al (2014) design a new outlier-tolerant matching algorithm to match automobile route with digital map, Chatzis et al (2009) used the Outlier Tolerant Hidden Markov to build a Robust Sequential Data model.
How to evaluate fault-tolerance of data computation method is an important branch. Up to now, there are few indices usable, except for the limited sample breakdown point, which was firstly proposed in Hampel (1971) for robust statistics and used to evaluate the outlier-tolerant ability of filtering in Hu Shaolin (2000) and in Hu Shaolin (2001). As a hot research topic in Automation and data processing, outlier-tolerant computation involves different knowledge in many different technical fields. Comprehending recent research situation, it can be clearly realized that the research of outlier- tolerant computing is just at the beginning stage in the long technical research aisle, and there are quite a lot of puzzles waiting for us to deal with:
Firstly, most of the existed research mainly concentrated in the isolated outliers as well as adaptive outliers. In the literatures published, the results of the research are rarely on the dependent outliers and patchy as well as innovation outliers. However, in large a number of sampling time series from engineering fields such as aerospace measurement and control, the dependent outliers and patchy outliers have greater impact and more difficulty than isolated and adaptive outliers. Secondly, most of the existed algorithms are focused on how to identify and to eliminate outliers. Engineering applications run short of practical algorithms which can be directly extended to deal with patchy outliers. Thirdly, although the outlier-tolerant design of algorithm is one of the effective approaches for ensuring reliability of numerical calculation in the case there are outliers in time series, but it did not form a complete and useful index system for us to evaluate the outlier-tolerant ability and the effect of fault-tolerance computation.
Acknowledgement
This work is supported by the National Nature Science Foundation of China (Grant No.61473222 and No. 91646108).
REFERENCES
Abraham, G Box, 1979. Bayesian Analysis of Some Outlier Problems in Time Series.Biometrika, 66,229-36
Battaglia, F., Orfei, L. 2005. Outlier Detection and Estimation in NonlinearTtime Series. Journal of Time Series Analysis, 26:107–21.
Bodson, M. 2000. Control, Computers, and the New
Millennium. IEEE Trans. Control System Technology, 8 (1):11-35
Chatzis, P., Kosmopoulos, I. et al. 2009. mRobust Sequential Data Modeling Using an Outlier Tolerant Hidden Markov Model.IEEE Trans on Pattern Analysis and Machine Intelligence, 31 (9):1657- 1669
Chen, J.M. Chen, H.S.2000. System Parameter Estimation with Input /output Noisy Data and Missing Measurements. IEEE Trans. Signal Processing, 48:1548–1558.
Dixon,1950. Analysis of Extreme Value. Ann Math Stat, 21:488-506.
Methods Garching, Germany 1998. Fundamental Theories of Physics, vol 105. Springer, Dordrecht
Dose, V., Linden, W. 1999. Outlier Tolerant Parameter Estimation,in Maximum Entropy and Bayesian Methods, Kluwer Academic, Dordrecht
Fan Jincheng, Hu Shaolin [Hu Feng], 1996. Research on Robust-resistant Analysis of Dynamic Measurement Data [Review]. Mathematical Statistics and Application Probability,11 (3):244-248
Fan Jincheng, Hu Shaolin[Hu Feng], 1996. Research on Resistance of Dynamic Measurement Data.Mathematical Statistics and Applied Probability,11 (3): 244-248
Fan Jincheng; Hu Shaolin[Hu Feng],1995.Minimax Robustly Redescending Estimators for Multivariate Location Vector. Journal of Xi'an Jiaotong University, 29 (12):107-112
Ferguson, 1961. On the Rejection of Outliers. Proc 4th Berkley Symp on Math Stat and Prob.
Gutman, P., Nilsson, B. 1998. Modeling and Prediction of Bending Stiffness for Paper Board Manufacturing. Journal Process Control,8:229-237
Hampel, F. 1971. A General Qualitative Definition of Robustness. Ann Math Stat, 42: 1887-1896.
Hu Shaolin [Hu Feng], 2001. Process Monitoring Techniques and Applications, Beijing: National Defense Industry Press,China,pp:42-103
Hu Shaolin [Hu Feng], Fan Jincheng, 1993. Bounded Influence Filters for Dynamic-measurement Systems. Control Theory and Applications.10 (1): 36~45
Hu Shaolin [Hu Feng], Sun Guoji, 1999. Identification Algorithm with Bounded Influence for Linear Models.Journal of Xi'an Jiaotong University, 33 (7):11-14 Hu Shaolin [Hu Feng], Sun, Guoji, Lai Fei, 1998. Change
Detection and Its Application for Processes. Journal of North China Institute of Technology, 19 (4):312-320 Hu Shaolin, 1993. Review of Reasonability Test of Data from
Dynamic-Measurement System. Observation and Research of Satellite,16 (1):39-54
Hu Shaolin, 2000. Research on Processes Faults Detection and Fault-tolerant Processing.PhD Thesis, Xi’an Jiaotong University,113-148
Hu Shaolin, Fu Na, Guo Wenming, 2016. High-verisimilitude Outlier-tolerant Q-filtering Algorithm for Dynamic-measurement Data. Journal of Astronautics, 37 (1):112-117
Hu Shaolin, Huang Liusheng, 2003. Fault-Tolerant Kalman Filter for Attitude Parameters of the Spin Stabilized Satellite.Chinese Space Science and Technology,23 (1):66-70
Hu Shaolin, Huang Liusheng, 2004a. Outlier-Tolerant Twice Median Filter of Type II for Non-stationary Signals. Journal of System Simulation, 16 (7): 1580-1583
Hu Shaolin, Huang Liusheng, 2010. Fault-tolerant Design of Computer Controlled System, Beijing: Press of Science (in Chinese)
Hu Shaolin, Huang Liusheng, et al. 2004b. Outlier-tolerant Twice Median Smoother Algorithm for Non-stationary Signals. Chinese Space Science and Technology, 24 (4):6-10
Huber, P J,1981. Robust statistics.John & Sons Press,pp:1-105 Karel, Z., Jirí, M., Tomas, S. 2009. Tracking by an Optimal Sequence of Linear Predictors. IEEE transactions on pattern analysis and machine intelligence. 31 (4): 677-692 Kenneth, M. Hanson, 2005. Bayesian Analysis of Inconsistent
Measurements of Neutron Cross Sections. Los Alamos National Laboratory, http://www.lanl. gov/home/kmh Kunsch, R. 1984. Infinitesimal Robustness for Autoregressive
Process. Ann Stat., 12 (3):843-863
Li Yue, Hu Shaolin, Dong Kai, 2014. Outlier-tolerant Matching Algorithms of Automobile Route with Digital Map. Chinese Automation Congress, 2014,:527-532 Martin, D., Mintz, 1983. Robust Filtering and Prediction for
Linear System with Uncertain Dynamics--a game theoretic approach. IEEE Trans.Auto Control,AC-18 Pearson, R.K. 2002. Outliers in Process Modeling and
Identification. IEEE Trans on Control Systems Technology, 10 (1): 55-63
Pesonen, H. 2009.Outlier-robust Bayesian Filter with Integrity Monitoring for GNSS Positioning.www.math.tut.fi/pos group
Rousseeuw, R., Hampel, F. et al. 1986. Robust Statistics-Approach Based on Influence. John Wiley and Sons Voulodimos, A., Grabner, H., Kosmopoulos, D., Gool, L.V.,
Varvarigou, T. 2010. Robust Workflow Recognition Using Holistic Features and Outlier-Tolerant Fused Hidden Markov Models, Artificial Neural NetworksICANN -international Conference, 6352 :551-560