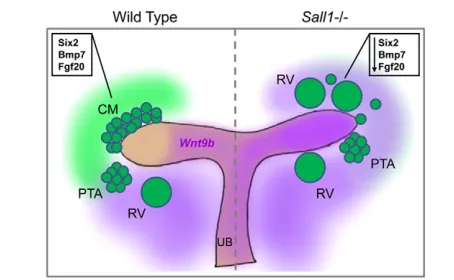
ABSTRACT
The formation of the proper number of functional nephrons requires a delicate balance between renal progenitor cell self-renewal and differentiation. The molecular factors that regulate the dramatic expansion of the progenitor cell pool and differentiation of these cells into nephron precursor structures (renal vesicles) are not well understood. Here we show that Sall1, a nuclear transcription factor, is required to maintain the stemness of nephron progenitor cells. Transcriptional profiling of Sall1mutant cells revealed a striking pattern, marked by the reduction of progenitor genes and amplified expression of renal vesicle differentiation genes. These global changes in gene expression were accompanied by ectopic differentiation at E12.5 and depletion of Six2+Cited1+ cap mesenchyme progenitor cells. These findings highlight a novel role for Sall1 in maintaining the stemness of the progenitor cell pool by restraining their differentiation into renal vesicles.
KEY WORDS: Sall1, Cap mesenchyme, Embryonic kidney development, Nephron differentiation, Renal progenitor cell, Renal vesicle
INTRODUCTION
During kidney development, the formation of the proper number of functional nephrons is crucial for the future health of the adult. The kidney has a limited capacity to repair existing nephrons upon injury or disease, but lacks the ability to generate new nephrons. A reduction in nephron number can cause hypoplastic disease, a leading cause of childhood kidney failure, or promote hypertension and chronic kidney disease later in life (Keller et al., 2003). Because nephrogenesis ceases shortly after birth, therapies to promote increased nephron number during this crucial window could reduce future kidney-related mortality. However, our understanding of factors that regulate nephron number has been limited.
One of the most important mechanisms to ensure a complete renal endowment is the proper maintenance of the renal progenitor cell pool. This pool gives rise to all the tubular segments of the nephron, except collecting ducts, and has been identified using a number of transgenic tools (Boyle et al., 2008; Kobayashi et al., 2008; Mugford et al., 2008). These studies have shown that the progenitor cells are induced within the metanephric mesenchyme (MM) by the outgrowth of the ureteric bud (UB), express Six2and Cited1, and form an organized cap of cells around the tips of the UB (cap mesenchyme, CM). The CM receives signals from the UB and is triggered to adopt one of two independent fates: to undergo
self-RESEARCH ARTICLE STEM CELLS AND REGENERATION
1Department of Internal Medicine, Saint Louis University, St Louis, MO 63104, USA. 2Department of Biochemistry and Molecular Biology, Saint Louis University, St Louis, MO 63104, USA. 3VA St. Louis Health Care System, John Cochran Division, St Louis, MO 63106, USA.
*Author for correspondence ([email protected]) Received 25 February 2013; Accepted 4 December 2013
renewal to maintain the progenitor pool or to initiate a mesenchymal-to-epithelial transition to differentiate into the segmented nephron. Differentiation triggers sequential morphological and gene expression changes. First, a clustered pre-tubular aggregate (PTA) undergoes epithelialization into a circular renal vesicle (RV). Next, polarization of the RV forms the comma and S-shaped body, followed by segmentation into specialized podocyte (glomerular), proximal and distal structures of the nephron (Little and McMahon, 2012). The formation of new nephrons occurs in the nephrogenic zone, located in the periphery of the kidney, and is synchronized with the iterative branching of the UB to form a new nephron at the tip of each UB.
A delicate balance between the expansion of the progenitor cell pool and epithelialization to form RVs must be maintained throughout nephrogenesis to ensure the complete complement of 300,000 to 1 million human nephrons (Nyengaard and Bendtsen, 1992). Depletion of the progenitor cell pool by unrestrained differentiation can result in early arrest of nephrogenesis, causing renal hypoplasia or agenesis. Important studies have identified several factors responsible for the maintenance of the renal progenitor cell population. Wnt9b, secreted from the UB, acts as the initial inductive signal for the adjacent CM and simultaneously promotes the expansion of the progenitor pool (Carroll et al., 2005; Karner et al., 2011). Interpretation of the Wnt9b signal seems to be dependent on the level of expression of Six2within the niche. Six2, expressed in the CM, maintains the nephron progenitors in the undifferentiated state. Deletion of Six2 causes the CM to prematurely differentiate into RV structures, exhausting the progenitor cell pool and halting kidney formation (Self et al., 2006).
Fgf9 and Fgf20 are also important in the CM to maintain the multipotent state of progenitor cells (Barak et al., 2012). Simultaneous deletion of both factors causes premature differentiation, similar to the phenotype observed in the Six2mutant. Together, these studies represent key advances in understanding what factors maintain the renal progenitor cell niche. However, apart from Six2, there is limited information about the transcriptional regulators that determine whether a cell in the CM will self-renew or undergo differentiation to form the RV.
Sall1 encodes a multi-zinc-finger transcription factor highly expressed in multipotent renal progenitor cells (Osafune et al., 2006) and CM-derived differentiating structures (PTA, RV, comma and S-shaped bodies) (Takasato et al., 2004). Mutations in human SALL1
cause Townes Brocks syndrome (TBS; Online Mendelian Inheritance in Man, no. 107408), an autosomal dominant disorder associated with a variety of multi-organ defects, including renal hypoplasia and renal agenesis (Kohlhase, 2000; Kohlhase et al., 1998). Sall1plays an important role for the initial outgrowth of the UB into the surrounding MM early during metanephric development (Nishinakamura et al., 2001). However, in a majority of Sall1
mutants, the UB invades the mesenchyme and undergoes several rounds of branching before arresting. Using a colony-formation
Sall1
balances self-renewal and differentiation of renal progenitor
cells
Jeannine M. Basta1,2, Lynn Robbins1,3, Susan M. Kiefer1,2, Dale Dorsett2and Michael Rauchman1,2,3,*
assay, Osafune and colleagues showed that isolated Sall1-expressing cells were able to form colonies from a single cell and were also competent to differentiate into all tubular structures of the nephron. The same population of isolated multipotent cells deficient in Sall1
also formed colonies and were competent to differentiate, although the colony size was significantly smaller (Osafune et al., 2006), indicating that Sall1is important for the expansion of the progenitor population, but is not required for its differentiation.
We sought to identify the molecular mechanism by which Sall1 functions during kidney development. In addition to the early function of Sall1for UB invasion (Nishinakamura et al., 2001), we show here that Sall1is required to expand the renal progenitor cell pool by regulating the differentiation of these cells into RVs. In the absence of Sall1, the progenitor cell pool is exhausted as a result of unrestrained differentiation, leading to the early arrest of kidney development.
RESULTS
A majority of Sall1 mutants form small kidneys with reduced branching
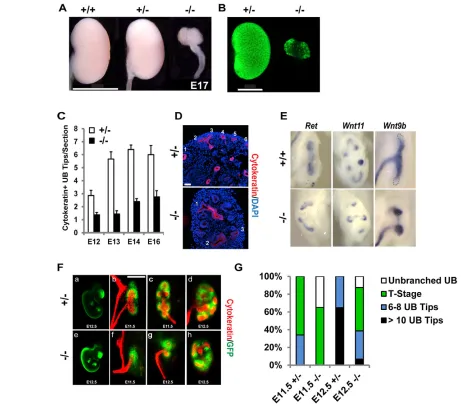
In mice of the ICR background, the UB invaded the MM, branched and formed a small kidney in 88% of Sall1GFPhomozygous mutant
embryos (Fig. 1A,G). We took advantage of the mutant metanephroi that formed small kidneys to investigate the molecular mechanism of Sall1 in kidney development. Branching was significantly reduced in the mutant from embryonic day (E)12 to 16 compared with heterozygous controls (Fig. 1C,D). The expression of the UB tip markers Retand Wnt11were not altered in the mutant. In the wild type, Wnt9b was expressed in the stalks of the ureter and downregulated in the tips of the UB. In the mutant, Wnt9bexpression was expanded from the stalks to the tips of the ureter (Fig. 1E).
[image:2.612.48.513.240.646.2]We characterized the distribution of the UB branching events in E11.5 and E12.5 Sall1GFPheterozygous control and mutant kidneys
Fig. 1. UB branching is decreased and delayed in the Sall1GFPmutant kidney.(A) E17 kidneys from wild-type (+/+), Sall1GFPheterozygotes (+/–) and
Sall1GFPhomozygous mutant (–/–) embryos. The homozygous mutant kidney is significantly hypoplastic. Scale bar: 2 mm. (B) GFP expression from the
Sall1GFPallele in +/– and –/– kidney. Scale bar: 1 mm. (C) Quantification of UB tips. The difference between the mutant and heterozygous samples at each
stage (E12-16) was statistically significant: P≤0.008. (D) Representative images of E14 +/– and –/– kidneys used for quantification of UB tips, stained for cytokeratin. Scale bar: 50 μm. (E) In situhybridization for UB markers. Retand Wnt11have normal expression in the mutant UB compared with the wild type control. In the mutant, Wnt9bexpression is upregulated in the UB tip. (F) GFP fluorescence in E12.5 Sall1GFP+/– (a) and –/– (e) embryos. At E11.5, the
Sall1GFP+/– ureter, stained for cytokeratin, has branched once (T-stage; b) or twice forming 6 ureter tips (c), while the E11.5 Sall1GFP–/– ureter has grown into
(Fig. 1F,G). We found that a majority of mutant kidneys branched by E12.5, but were delayed. At E11.5, 66% of the heterozygous kidneys were at T-stage and 34% had branched to form six to eight UB tips. By contrast, we did not observe any mutant kidneys with six to eight UB tips at E11.5. Instead, 35% of mutant kidneys had ureters that were unbranched, with the remainder of the kidneys at the T-stage. The percentage of kidneys with unbranched ureters in the mutant dropped to 12% by E12.5. Half of the mutant kidneys at E12.5 were at the T-stage, 32% had six to eight UB tips, and 7% of kidneys had 10 or more UB tips. A majority of the heterozygous kidneys had 10 or more UB tips at E12.5. These data indicate that whereas UB invasion of MM is delayed in the Sall1mutant, in most cases the UB invades the mutant MM and undergoes several rounds of branching to form a small kidney.
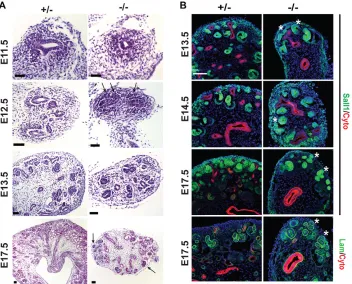
Sall1GFPmutants have ectopic renal vesicle formation Histological analysis of E11.5-E17 kidneys revealed a number of RV or tubular-like structures (hereafter referred to as RV/tubule structures) throughout the mutant kidney, including some in ectopic locations toward the periphery of the kidney (Fig. 2A). Interestingly, at the T-stage, the mutant had ectopically located condensed clusters of cells with early lumen formation on the dorsal side of the ureter. At E13.5 we observed few UB tips, numerous differentiated RV-like structures, and very few differentiated comma and S-shaped bodies. At E17.5 we observed numerous differentiated structures ectopically located toward the periphery of the kidney, including structures that resembled glomeruli. To investigate this observation further we performed immunohistochemistry for Sall1-GFP (expressed in CM, stroma, RV and differentiating tubule structures) and cytokeratin (expressed in UB; Fig. 2B). We were able to use an N-terminal antibody to Sall1 because the Sall1GFP mouse expresses 52
N-terminal amino acids fused to GFP. Similar to the histological analysis, in the mutant we observed many differentiated RV/tubule structures that were Sall1-GFP positive (Sall1-GFP+) and cytokeratin negative. These structures were also laminin positive and
cytokeratin negative at E17.5 (Fig. 2B). There were very few UB tips in the mutant. We observed Sall1+, laminin+ RV/tubule structures in ectopic locations, and a lack of Sall1-GFP+ CM.
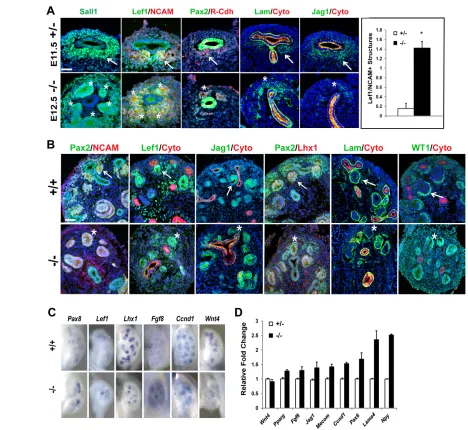
Investigating earlier development, we observed numerous differentiating structures (PTAs or RVs) that formed on the dorsal side of the ureter (ectopic location) in the E12.5 Sall1GFPmutants
that expressed Sall1, Lef1, NCAM1/2, R-cadherin (Cdh4), laminin and Jag1 (Fig. 3A). Control E11.5 heterozygous kidneys matched for the number of UB tips (stage matched) had a small number of condensing cells forming PTAs. Quantification of Lef1+NCAM+ structures with a morphologically distinct lumen in control and mutant stage-matched kidney (T-stage to six UB tips) revealed that the mutant had significantly more differentiating structures (0.15±0.06 versus 1.42±0.22, P=1.1×10⁻⁸). We analyzed the
RV/tubule structures by immunofluorescence at E13 using markers of RVs (NCAM, Lef1, Jag1, Lhx1 and laminin; Fig. 3B). E13 wild-type kidneys had a highly structured pattern of ureteric bud tips surrounded by organized CM cells with RVs forming in the ‘arm pit’ of the ureter. These RVs were NCAM+, Lef1+, Lhx1+, Jag1+ and laminin+ and formed on the ventral side of the ureter, towards the interior of the kidney. In the mutant, some renal vesicles were located ectopically on the dorsal side of the ureter, towards the periphery of the forming kidney. Whereas the peripheral nephrogenic zone of the wild type was populated by CM cells, the mutant kidney lacked Pax2+ CM cells in the nephrogenic zone. RV formation was abnormal, with no apparent UB/RV pattern, and RVs formed without apparent contact with the UBs. The RV structures in the mutant expressed NCAM, Lef1, Lhx1, Jag1 and laminin, and at E13 the mutant lacked more differentiated comma and S-shaped bodies. The vesicle structures also expressed Wt1, indicative of a podocyte lineage; however, the mutant RV morphology was abnormal with no organized podocyte layer.
[image:3.612.49.401.453.737.2]We performed whole-mount in situhybridization for renal vesicle markers Pax8,Lef1,Lhx1,Fgf8,Ccnd1and Wnt4(Fig. 3C). We found that gene expression in renal vesicles was irregular in the
Fig. 2. Ectopic differentiated structures in the Sall1mutant.(A) Histological analysis of
Sall1GFP+/– and –/– kidneys. Mesenchymal
cells surround the ureter at E11.5 in the mutant and by E12.5 there are ectopic condensations with early lumen formation on the dorsal side of the ureter (arrows). At E13.5 there are few UB tips and multiple RV-like structures with very few S- and comma-shaped bodies. At E17.5, ectopic
differentiated structures were located toward the periphery of the kidney (arrows). Scale bars: 50 μm. (B) Immunofluorescence staining reveals that a majority of Sall1-GFP+ cells are located in differentiated RV or tubule structures. At E17 these structures are laminin+. Asterisks mark ectopically located differentiated structures in the mutant. Scale bar: 100 μm.
mutant, and the expression of some genes (Pax8 and Lef1) was higher in larger foci compared with the controls. Quantitative real-time PCR analysis (qRT-PCR) using stage-matched kidneys revealed that similar to the findings with in situanalysis, Wnt4
expression was not altered in the mutant, but other genes expressed in RVs such as Fgf8,Jag1,Mecom,Ccnd1,Pax8,Lama4and Npy
(Barak et al., 2012; Brunskill et al., 2008; Grieshammer et al., 2005; Karner et al., 2011; Thiagarajan et al., 2011; Yu et al., 2012), were increased in the mutant (Fig. 3D), supporting the evidence for unrestrained differentiation in the Sall1mutant.
We investigated whether these ectopic RVs could differentiate normally in the Sall1GFPmutant (supplementary material Fig. S1).
[image:4.612.50.518.57.487.2]At E16.5 the mutant had very few mature differentiated structures; however, we detected some Cdh6+lotus tetragonolobus lectin (LTL)+ proximal tubules in ectopic locations toward the periphery of the kidney in the nephrogenic zone. We also detected Wt1+ structures that were probably developing glomeruli, although these were also peripherally located and the cells making up the presumptive podocyte layer were poorly organized.
Fig. 3. Unrestrained differentiation in the Sall1mutant kidney.(A) Immunofluorescence was performed on E11.5 Sall1GFP+/– and E12.5 Sall1GFP–/–
kidneys stage matched for UB branch number (T-stage – 6 UB tips). The Sall1GFP+/– kidney has formed PTAs or early RVs (arrows), while the Sall1GFP–/–
kidney exhibited multiple Sall1+, NCAM+, Lef1+, R-Cdh+, laminin+, Jag1+ differentiated structures around a single UB tip, and in ectopic locations (asterisks). The number of Lef1+NCAM+ structures with a distinct lumen was counted (average ± s.e.m.) on non-sequential sections in six independent stage-matched E11.5 Sall1GFP+/– and E12.5 Sall1GFP–/– kidneys from three different embryos. There were significantly more structures in the mutant than in the control.
(*P=1.1×10⁻⁸). Scale bar: 50 μm. (B) Immunofluorescence analysis of E13.5 +/+ and E13.5 Sall1GFP–/– kidneys. E13.5 +/+ kidneys show renal vesicles
forming on the ventral side of the ureter (arrows). The E13.5 Sall1GFP–/– kidney lacks organized Pax2+ CM cells, and shows NCAM+, Lef1+, Jag1+, Lhx1+,
laminin+ renal vesicles that form ectopically on the dorsal side of the ureter (asterisks). RVs in the E13.5 Sall1GFP–/– kidney express Wt1, but the normal
C-shaped pattern (arrow) of presumptive podocytes is not apparent in the mutant (asterisk). Scale bar: 50 μm. (C) Whole-mount in situhybridization of RV markers. In E13.5 Sall1GFP–/– kidney, the RV markers Pax8and Lef1show increased focal expression. Lhx1,Fgf8,Ccnd1and Wnt4are preserved, but have
an abnormal pattern of expression. (D) qRT-PCR for genes expressed in the RV, in stage-matched E11.5 +/– and E12.5 –/– Sall1GFPkidneys. Wnt4remains
unaltered in the mutant, whereas the expression of all other RV markers has increased.
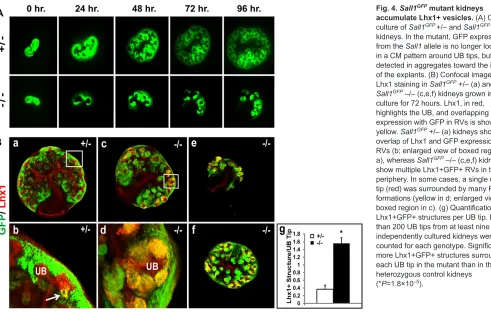
We also observed unrestrained differentiation in the Sall1GFP
mutant kidney when cultured ex vivoin organ culture. At the T-stage, mutant kidneys displayed GFP+ CM cells around each UB tip, similar to stage-matched control kidneys (Fig. 4A). After 96 hours, the heterozygous kidney had branched many times with GFP+ CM cells surrounding the UB tips. Mutant rudiments exhibited fewer branches than heterozygous controls. However, we consistently observed that the GFP+ cells in the mutant formed condensed foci, presumably induced CM cells, that were larger and more numerous than those observed in the heterozygote (Fig. 4A). To investigate whether the condensed GFP+ cells were in fact differentiated RVs, we immunostained organ-culture kidneys for Lhx1. After 72 hours in culture, the heterozygous kidneys had few Lhx1+GFP+ structures, whereas the mutant had multiple differentiating structures (Fig. 4Ba-f). Many RVs in the mutant were ectopically located toward the periphery of the kidney and there were multiple RV structures surrounding a single UB tip (Fig. 4Bd). Quantification of Lhx1+GFP+ RV formations per UB tip revealed significantly more RV formations per UB tip in the mutant compared with the control (Fig. 4Bg). These organ-culture studies indicated that the CM is formed around UB tips at E12.5, but it is progressively lost through differentiation in the Sall1GFPmutant.
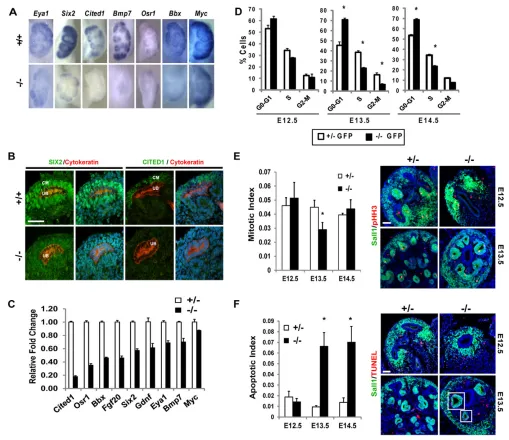
Renal progenitor cells are depleted in Sall1GFPmutants Taken together, the lack of Pax2+ CM cells and overabundance of RV structures led us to hypothesize that the progenitor cell pool in the Sall1mutant kidney was depleted because of the onset of rapid nephrogenesis. Progenitor cell markers Six2,Cited1, Bmp7and Osr1
were significantly reduced in the mutant, indicating that the progenitor cells were depleted by E13 (Fig. 5A). This was confirmed by immunofluorescence, by which we observed markedly reduced expression of Six2, and Cited1 expression was undetectable
(Fig. 5B). qRT-PCR analysis revealed that Cited1,Osr1,Bbx,Fgf20
and Six2were significantly reduced (≥50%) in the mutant, and Gdnf,
Eya1,Bmp7and Mycwere moderately reduced in the stage-matched mutant in comparison with the heterozygous control (Fig. 5C).
To determine whether reduced proliferation could account for progenitor cell depletion, we performed cell cycle analysis on sorted GFP+ cells (Fig. 5D). In the Sall1-GFP+ cells, the cell cycle was not significantly altered at E12.5 between control and mutant. However, at E13.5 the mutant had a higher percentage of cells in the G0-G1 stage (45.5±3.3 versus 70.7±1.4, P=0.02), and a decrease in the percentage of cells in the S and G2-M stages. Similar cell cycle alterations were observed at E14.5 in the mutant. We confirmed this result using pHH3 immunofluorescence to determine the percentage of cells in the G2-M phase of the cell cycle (Fig. 5E). We observed a significant decrease in the percentage of cells in the G2-M phase of the cell cycle only at E13.5, confirming our cell cycle results using the GFP-sorted cells. TUNEL staining revealed that there was no significant apoptosis in either the heterozygous control kidney or the mutant kidney at E12.5. Significant apoptosis was observed at E13.5 and E14.5 in the mutant, although a majority of the cells undergoing apoptosis in the mutant were located in RVs (Fig. 5F).
At E12.5, when we observed ectopic differentiation in the mutant, we did not observe an alteration in the cell cycle or an increase in apoptosis. Changes in cell cycle and apoptosis only became apparent at E13.5 and E14.5. At these stages the majority of the CM in the mutant was depleted, leaving stroma and differentiating structures (Figs 2, 3; Fig. 5E,F). These data, together with the findings of ectopic RV formation (Figs 3, 4), support the conclusion that Sall1
mutant nephron progenitors are biased towards differentiation, leading to their depletion.
[image:5.612.52.543.57.372.2]To investigate the early (E11.5-12.5) mechanism of kidney development in the absence of Sall1, we performed whole genome
Fig. 4.Sall1GFPmutant kidneys accumulate Lhx1+ vesicles.(A) Organ culture of Sall1GFP +/– and Sall1GFP–/–
kidneys. In the mutant, GFP expression from the Sall1allele is no longer localized in a CM pattern around UB tips, but is detected in aggregates toward the interior of the explants. (B) Confocal images of Lhx1 staining in Sall1GFP+/– (a) and
Sall1GFP–/– (c,e,f) kidneys grown in organ
culture for 72 hours. Lhx1, in red, highlights the UB, and overlapping expression with GFP in RVs is shown in yellow. Sall1GFP+/– (a) kidneys show
overlap of Lhx1 and GFP expression in RVs (b; enlarged view of boxed region in a), whereas Sall1GFP–/– (c,e,f) kidneys
show multiple Lhx1+GFP+ RVs in the periphery. In some cases, a single ureter tip (red) was surrounded by many RV formations (yellow in d; enlarged view of boxed region in c). (g) Quantification of Lhx1+GFP+ structures per UB tip. More than 200 UB tips from at least nine independently cultured kidneys were counted for each genotype. Significantly more Lhx1+GFP+ structures surrounded each UB tip in the mutant than in the heterozygous control kidneys (*P=1.8×10⁻⁵).
transcriptional profiling using GFP+ cells from Sall1GFP
heterozygous and mutant E11.5 and E12.5 kidney. We precisely matched the stage of development between the heterozygote and the mutant to compare gene expression based on developmental stage of the kidney and embryonic day. Sall1GFPheterozygous mice are
indistinguishable from wild type, thus could serve as a suitable control, and enabled sorting of GFP+ cells. Samples collected were as follows: E11.5 heterozygous kidneys at the T-stage to 6 UB tip stage; E12.5 mutant kidneys at the T-stage to 6 UB tip stage; and E12.5 heterozygous kidneys with 12-18 UB tips (Fig. 1F).
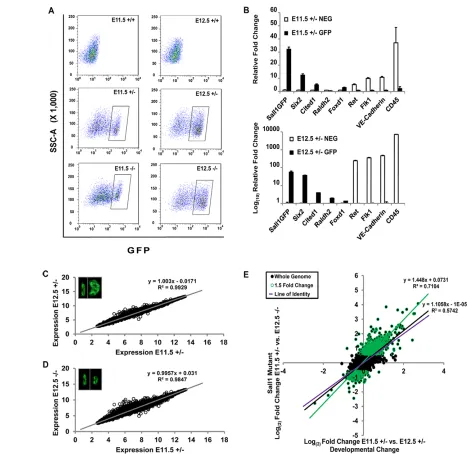
Using the FACS strategy previously described to isolate Sall1GFP Hi multipotent progenitor cells (Osafune et al., 2006),
~100,000 GFP+ cells from more than 350 embryos for each sample type were collected (Fig. 6A). We performed qRT-PCR to confirm that the sorted GFP+ pool reflected that of Sall1-expressing cells. The GFP+ population was enriched with the Sall1GFPtranscript, and
CM progenitor cell markers Six2 and Cited1. Stromal markers
Raldh2(Aldh1a2 – Mouse Genome Informatics) and Foxd1were present at very low levels in the GFP+ population. The UB marker
[image:6.612.50.559.56.496.2]Retand endothelial cell markers Flk1(Kdr), VE-Cadherin (Cdh5) Fig. 5. Progenitor gene expression is downregulated in the Sall1GFPmutant kidney.(A) In situhybridization of E12.5 +/+ and E13.5 –/– Sall1GFPkidney
shows decreased expression of CM genes in the mutant. (B) Six2 and Cited1 immunofluorescence in E13.5 Sall1GFP+/+ and –/– kidneys shows that in the
mutant expression of Six2 is decreased, whereas Cited1 expression is not detectable. Scale bar: 50 μm. (C) qRT-PCR for genes expressed in the CM, in stage matched E11.5 +/– and E12.5 –/– Sall1GFPwhole kidney. The expression of all the genes is decreased in the mutant. (D) Cell cycle analysis of GFP+ cells
indicates no statistically significant change at E12.5 between Sall1GFP+/– and –/–; however, at E13.5 and 14.5, there is a statistically significant increase in the
percentage of cells in G0-G1 (*P≤0.02). (E) Quantification of mitotic index using pHH3 staining of E12.5-14.5 embryonic kidney. The mitotic index at E13.5 is significantly decreased in the mutant (*P=0.05). Shown are representative images of E12.5 and E13.5 kidneys. Scale bar: 50 μm. (F) Quantification of apoptotic index using TUNEL staining of E12.5-14.5 embryonic kidney. No statistically significant difference in apoptotic index was detected at E12.5, and we observed very few TUNEL+Sall1+ cells in the CM of the control or mutant. Significantly more cells were TUNEL+ at E13.5 and E14.5 (*P<0.01) in RV formations in the mutant (boxed regions in the images on the right), but not in the remaining CM cells. Representative images from E12.5 and E13.5 are shown. Scale bar: 50 μm.
and CD45(Ptprc) were enriched in the GFP-negative population (Fig. 6B). The precise morphological and developmental staging of this assay allowed us to analyze gene expression profiles for the normal developmental progression between the initial invasion of the UB at E11.5 and the beginning of differentiation at E12.5, as well as those genes that were altered in the mutant.
When we compared expression profiles of the E11.5 and E12.5 heterozygous samples, we found very similar global distributions, confirming that the overall composition of the CM differs very little at these stages (Fig. 6C). However, when we compared expression
profiles of the E11.5 heterozygote and E12.5 mutant that were matched for developmental stage (Fig. 6D), we observed a significant deviation in the distribution of many genes. This was intriguing because although the control and mutant samples were specifically matched for stage, there were significant gene expression changes occurring in the mutant.
[image:7.612.51.523.55.509.2]The stage-matched comparison between control and mutant GFP+ cells revealed 248 upregulated genes and 46 downregulated genes, by at least twofold. This finding is consistent with the predominant role of Sall1 as a transcriptional repressor through its association Fig. 6. Whole-genome transcriptional profiling analysis.(A) The Sall1-GFP+ cell population was isolated by FACS (rectangular gate). Top panels, from +/+ kidneys, show GFP-negative cells. (B) Validation of the sorted cell pool by qRT-PCR of GFP+ and GFP-negative cells (± s.e.m.). GFP+ cells are enriched for the Sall1GFPtranscript, Six2and Cited1.Stromal markers Raldh2and Foxd1were present at very low levels in the GFP+ population. UB marker Retand EC
markers Flk1, VE-cadherin and CD45were enriched in the GFP-negative population. (C,D) Scatter plots comparing the global gene expression values of E11.5 +/– to E12.5 +/– or E12.5 –/– Sall1-GFP+ cells. A linear correlation is observed with little deviation from the line of best fit in both cases. However, expression of more genes deviated (open circles) from the line of best fit in the mutant (D) than seen with control samples (C). Insets show representative kidneys from which GFP+ cells were sorted. (E) Scatter plot comparing normal developmental change in gene expression (x-axis) with changes in the mutant (y-axis). Globally there is little deviation in the mutant (black line) from the line of identity (purple line) indicating that genome-wide a majority of genes do not change. However, the line of best fit shifts (green line) when genes that change at least 1.5-fold in the mutant are considered. A majority of genes in the mutant change in the same direction as that of normal development, but to a significantly greater extent.
with the NuRD complex (Kiefer et al., 2002; Lauberth et al., 2007; Lauberth and Rauchman, 2006). Among the statistically significant changes were genes previously reported to be altered in Sall1
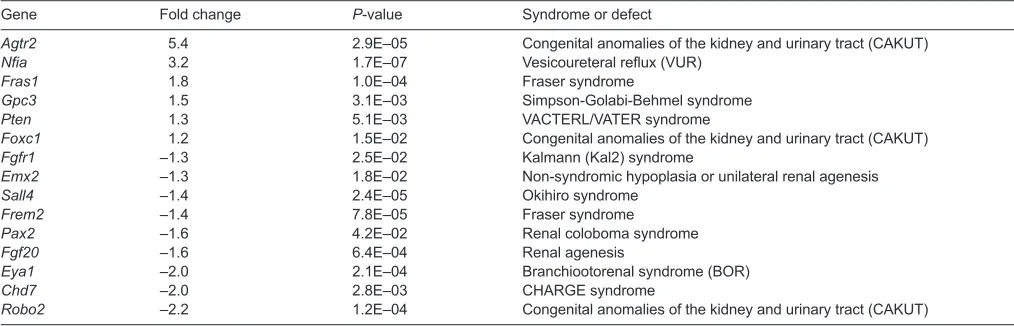
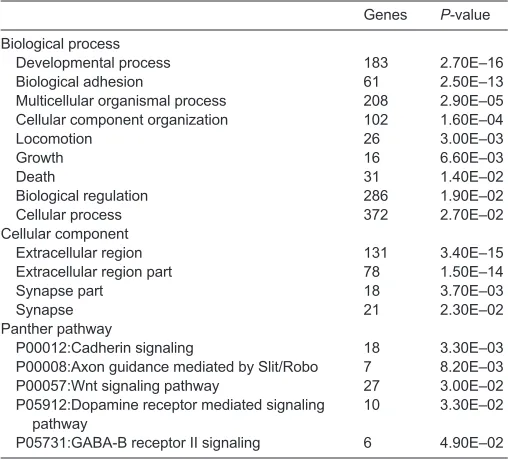
mutants (Itga8, Gdnf, Kif26b) (Nishinakamura et al., 2001; Uchiyama et al., 2010), supporting the validity of our data. We confirmed the gene expression changes observed in the microarray with qRT-PCR on a number of genes (supplementary material Fig. S2A). Table 1 lists the top 25 genes and their fold change. Many genes identified with altered expression in the mutant are associated with renal syndromes (Table 2), indicating that the data may reveal new genes important for kidney development and birth defects. Gene ontology analysis using DAVID (http://david.abcc.ncifcrf.gov/) (Table 3) revealed that many of the genes with altered expression in the mutant are associated with the extracellular region, indicating that Sall1may affect genes expressed in the MM that signal to the ureter, surrounding CM or stromal cells. Biological adhesion, cellular component organization, locomotion and growth were among the biological processes affected with high
statistical significance in the mutant. Pathway analysis revealed highly statistically significant values for cadherin signaling, axon guidance mediated by Slit-Robo, and Wnt signaling, which are all pathways important in the development of the kidney (Carroll et al., 2005; Grieshammer et al., 2004; Karner et al., 2011; Kispert et al., 1998).
When we analyzed the fold changes in our samples and focused on genes that were altered ≥1.5-fold in the mutant, we uncovered a significant trend (Fig. 6E). The control sample exhibited a subset of genes that had increased or decreased expression between E11.5 and E12.5. The same genes in the mutant had magnified gene expression changes. Genes that were upregulated in expression between E11.5 and E12.5, as the kidney developed, in the control progenitor pool had higher expression in the mutant, whereas genes that decreased in expression in the control progenitor pool as the kidney developed had significantly lower expression in the mutant (Table 1). This suggested that the normal developmental changes that occurred at the initiation of kidney development were amplified in Sall1-deleted Table 1. Top fold changes in control and mutant Sall1GFPprogenitor cells
E11.5 +/– versus E12.5 +/– E11.5 +/– versus E12.5 –/–
Gene (development) P-value (stage matched) P-value
Figf 6.6 1.2E–06 16.8 2.1E–08
Slitrk6 2.2 4.0E–02 14.4 8.5E–06
Fap 4.4 4.2E–08 12.8 1.7E–10
Egfl6 3.3 1.8E–05 12.5 1.1E–08
Rxfp2 3.9 1.4E–05 11.1 5.3E–08
Cfh 5.8 2.7E–06 10.4 1.6E–07
Bmp5 1.6 1.1E–04 8 9.2E–11
Lin28a –5.4 2.0E–08 –6.9 4.8E–09
Gria4 3.6 2.9E–07 6.1 8.6E–09
Postn 3.4 1.2E–05 6 2.8E–07
Cxcl13 2.7 2.4E–04 5.7 1.3E–06
Sema3a 3.8 6.5E–07 5.7 4.6E–08
Khdrbs2 0.4 7.3E–03 5.6 3.4E–10
Kcnt2 3.1 1.2E–05 5.5 2.9E–07
Moxd1 –1.4 2.4E–03 –5.4 9.1E–10
Agtr2 3.5 3.5E–04 5.4 2.9E–05
Fam19a1 3.8 3.0E–08 5.3 2.9E–09
Slc26a7 1.8 3.1E–05 5.2 1.1E–09
Mme 4.0 2.6E–07 5 5.6E–08
Gm9912 3.1 8.4E–04 5 4.4E–05
Cntnap5b 1.6 5.3E–03 5 8.3E–08
Zmat4 –3.4 2.8E–06 –4.7 2.7E–07
Gm9911 1.4 3.8E–01 4.9 1.1E–03
Lum 1.6 4.2E–02 4.8 7.1E–06
[image:8.612.45.552.575.738.2]Galntl6 1.5 6.6E–03 4.6 1.5E–07
Table 2. Genes associated with renal syndromes or defects
Gene Fold change P-value Syndrome or defect
Agtr2 5.4 2.9E–05 Congenital anomalies of the kidney and urinary tract (CAKUT)
Nfia 3.2 1.7E–07 Vesicoureteral reflux (VUR)
Fras1 1.8 1.0E–04 Fraser syndrome
Gpc3 1.5 3.1E–03 Simpson-Golabi-Behmel syndrome
Pten 1.3 5.1E–03 VACTERL/VATER syndrome
Foxc1 1.2 1.5E–02 Congenital anomalies of the kidney and urinary tract (CAKUT)
Fgfr1 –1.3 2.5E–02 Kalmann (Kal2) syndrome
Emx2 –1.3 1.8E–02 Non-syndromic hypoplasia or unilateral renal agenesis
Sall4 –1.4 2.4E–05 Okihiro syndrome
Frem2 –1.4 7.8E–05 Fraser syndrome
Pax2 –1.6 4.2E–02 Renal coloboma syndrome
Fgf20 –1.6 6.4E–04 Renal agenesis
Eya1 –2.0 2.1E–04 Branchiootorenal syndrome (BOR)
Chd7 –2.0 2.8E–03 CHARGE syndrome
cells, confirming our previous observations in vivoof a sensitized differentiation program.
Many of the genes that had decreased expression in the microarray analysis in the mutant are expressed in the CM (Cited1,
Osr1,Meox1,Meox2,Bbx,Six2,Eya1,Bmp7,c-Myc,Fgf20,Fgf9,
Crym,Hoxa11and Gdnf). Importantly, this includes genes that have a defined functional role in maintaining or expanding self-renewing progenitors (Barak et al., 2012; Blank et al., 2009; Couillard and Trudel, 2009; Sajithlal et al., 2005; Self et al., 2006; Tena et al., 2007). This result indicated that the genetic program that defines self-renewing nephron progenitors is generally downregulated early in kidney development in the mutant. We also compared our genome-wide data to the list of genes that change in RVs relative to CM, identified by microarray analysis using laser capture microdissection of these cell populations (Brunskill et al., 2008). We found that there were 63 genes that displayed a statistically significant change (at least 1.5-fold) in expression, similar to induction of RV genes during normal development. We confirmed the bioinformatic analysis with qRT-PCR of whole embryonic kidney for a subset of these genes (supplementary material Fig. S2B; Fig. 3D). Strikingly, similar to the results of our array analysis, the change in gene expression (CM versus RV) was in the same direction as in the mutant; however, the fold change was greater, suggesting that Sall1 may be acting to control the dynamic range of gene expression responsible for the conversion of CM to RV (supplementary material Fig. S2B; Table 1).
DISCUSSION
Initial studies of Sall1mutants focused on the impaired outgrowth and initial branching of the UB, the earliest step where the gene is required in the developing kidney (Nishinakamura et al., 2001). However, in a majority of Sall1mutants, the UB invades the MM and initiates nephrogenesis. This observation, together with the finding that Sall1+ cells are multi-potent progenitors (Osafune et al., 2006), led us to investigate whether Sall1 has a direct role in regulating the fate of renal progenitor cells. Here, we present data revealing a crucial role for Sall1 in the progenitor cell niche, regulating the transition between the self-renewing CM and the
differentiation of these cells into RVs, the first epithelial structure in the developing nephron. Genetic deficiency of Sall1 leads to a reduction of CM gene expression, whereas the differentiation program is accentuated. These gene expression changes are accompanied by depletion of Cited1+Six2+ progenitor cells and evidence of ectopic renal vesicles in the peripheral nephrogenic zone.
Recent studies have identified Fgf9, Fgf20 and Bmp7 as important secreted factors, which together, promote survival, proliferation and competence of CM to respond to inductive signals (Barak et al., 2012; Blank et al., 2009; Oxburgh et al., 2004). In
Bmp7-null mice, progenitor cells are mainly lost through apoptosis soon after nephrogenesis initiates, but premature differentiation is not observed (Blank et al., 2009; Dudley et al., 1995). At E12.5 in
Sall1 mutant kidney, Bmp7 expression was modestly (<20%) reduced (Fig. 5C), and we did not observe cell cycle alterations or apoptosis at this stage (Fig. 5D-F). Yet, at this stage, there was evidence of premature differentiation in Sall1mutants, suggesting that reduced Bmp7 signaling is probably not contributing significantly to loss of CM. By contrast, Fgf9/Fgf20compound mouse mutants display a phenotype which is reminiscent of Sall1–/–
(Barak et al., 2012). Our microarray data showed a ~60% reduction in Fgf20expression at E12.5 in Sall1–/–mice, raising the possibility
that once the MM is specified and invaded by the UB, Sall1may regulate Fgf20expression to maintain self-renewing progenitor cells in a differentiation-competent state.
Our transcriptional profiling in Sall1–/–renal progenitors showed
many more genes were upregulated than downregulated. We have previously demonstrated that Sall1 associates with the nucleosome remodeling and deacetylase (NuRD) chromatin remodeling complex to repress gene transcription (Lauberth et al., 2007; Lauberth and Rauchman, 2006), suggesting a molecular mechanism for Sall1-mediated inhibition of gene expression in the kidney. Consistent with this finding, we recently showed that conditional deletion of the NuRD-specific component Mi2b
(Chd4) in Six2+ cells leads to the depletion of CM (Denner and Rauchman, 2013). Moreover, Sall1 and Mi2bdisplay a strong genetic interaction in the developing kidney, supporting a cooperative role for Sall1 and NuRD in maintaining renal progenitor cells. Investigation of lymphocyte differentiation suggests that proper genomic targeting of the Mi2-NuRD complex requires interaction with lineage-specific DNA-binding factors, such as Ikaros, to balance growth and differentiation of progenitors (Zhang et al., 2011). In embryonic stem cells (ESCs), Sall4 and NuRD are found in a macromolecular complex that has been shown to regulate pluripotency and lineage determination (Liang et al., 2008). A striking finding of our genome-wide analysis is that normal developmental gene expression is magnified in the Sall1–/–
mutant (Fig. 6E; Table 1). This is reminiscent of recent studies in which NuRD was shown to modulate transcriptional heterogeneity and the dynamic range of expression of pluripotency genes in ESCs (Reynolds et al., 2012). These findings raise the intriguing possibility that Sall1 and NuRD might function together to balance growth and differentiation in the kidney by similarly setting the threshold of expression of key CM genes, such as Six2and Fgf20
(Karantzali et al., 2011; Liang et al., 2008; Reynolds et al., 2012), that in turn, determine the decision of a cell to self-renew or differentiate.
[image:9.612.45.299.74.304.2]Six2 deficiency leads to a phenotype that is similar to that observed in Sall1mutants, in which there is ectopic RV formation and loss of progenitor cells (Self et al., 2006). In the Six2mutant, Sall1 expression is maintained in the CM (Self et al., 2006); Table 3. Gene ontology analysis
Genes P-value Biological process
Developmental process 183 2.70E–16
Biological adhesion 61 2.50E–13
Multicellular organismal process 208 2.90E–05
Cellular component organization 102 1.60E–04
Locomotion 26 3.00E–03
Growth 16 6.60E–03
Death 31 1.40E–02
Biological regulation 286 1.90E–02
Cellular process 372 2.70E–02
Cellular component
Extracellular region 131 3.40E–15
Extracellular region part 78 1.50E–14
Synapse part 18 3.70E–03
Synapse 21 2.30E–02
Panther pathway
P00012:Cadherin signaling 18 3.30E–03
P00008:Axon guidance mediated by Slit/Robo 7 8.20E–03
P00057:Wnt signaling pathway 27 3.00E–02
P05912:Dopamine receptor mediated signaling 10 3.30E–02 pathway
P05731:GABA-B receptor II signaling 6 4.90E–02
however, we observed reduction in Six2in the Sall1mutant (Fig. 5). The fact that Six2expression is significantly decreased, but not undetectable in Sall1 mutants, may explain why premature differentiation is apparent at an earlier stage (E11.5 versus E12.5) in
Six2–/–compared with Sall1–/–kidneys. We hypothesize that Sall1is
upstream of Six2and might be needed to maintain an appropriate level of expression in the CM so that at each UB tip only a subset of cells are committed to differentiation, with the remainder undergoing self-renewal. Although Sall1 has been defined as a transcriptional repressor, it is likely to have co-activator properties through its association with NuRD (Zhang et al., 2011) or other co-factors. Future studies to define Sall1 genomic binding sites will provide insight into whether Six2is a direct transcriptional target of Sall1.
Wnt9b signaling through the canonical β-catenin pathway induces CM to differentiate, but it is also required to promote proliferation of self-renewing progenitor cells. It has been proposed that interpretation of the Wnt9b signal in CM is dependent on the level of Six2and Cited1(Brown et al., 2013; Carroll et al., 2005; Karner et al., 2011) to define the cellular response to β-catenin transcriptional input. A current model suggests that relatively high levels of nuclear β-catenin together with reduced Six2 in Cited1-negative nephron progenitor cells favors differentiation (Brown et al., 2013; Park et al., 2012). By contrast, increased levels of Six2 in a transcriptional complex with Tcf/Lef, prevents differentiation induced by β-catenin. In the Sall1mutant, Wnt9b expression is upregulated and expands to the tip of the Sall1mutant UB (Kiefer et al., 2010) (Fig. 1E); therefore, it may serve as the signal to the CM that promotes unrestrained differentiation. Consistent with this notion, constitutively active β-catenin expressed in CM results in ectopic RV formation, indicating that at high levels this signal is sufficient for nephron induction (Kiefer et al., 2010; Park et al., 2012). Our previous studies showed that increased levels of Wnt9b, similar to those observed in Sall1 mutants (Kiefer et al., 2010) (Fig. 1E), was sufficient to increase expression of the RV genes
Wnt4, Fgf8and Pax8; yet this level of Wnt9bexpression did not induce ectopic RVs (Kiefer et al., 2012). This suggests that in the absence of a very strong canonical Wnt signal (as seen with the stabilized β-catenin gain-of-function allele), the renal progenitor cell cannot fully overcome barriers that restrain differentiation. In the
Sall1 mutant, the combination of reduced Six2 expression and elevated Wnt9b levels extending to the UB tip may synergize to cause ectopic RV formation. Recent studies suggest that stromal signals cooperate with Wnt9b to inhibit nephron progenitor expansion and promote expression of differentiation genes (Das et al., 2013). Future studies will determine whether Sall1-dependent signals from the stroma affect nephron progenitor cell fate. Alternatively, Sall1-deficient cells could bypass the requirement for a Wntinductive signal as shown for constitutively active Notch
(Boyle et al., 2011).
Together, our data show that Sall1 is a nuclear factor that is required to maintain the stemness of renal progenitor cells by restricting their differentiation. Loss of Sall1biases the cellular response to Wnt9b toward differentiation rather than self-renewal. We propose a model whereby Sall1 functions to coordinate UB branching with nephron induction (Fig. 7). In the CM, there is an intrinsic requirement for Sall1 to influence the responsiveness of the nephron progenitors to a β-catenin signal to determine whether the output is self-renewal or differentiation, possibly through the modulation of Six2expression levels. However, it is also possible that the Sall1-NuRD complex influences the β-catenin transcriptional output at the level of chromatin to determine the
cell fate decision in CM, as NuRD has been shown to inhibit canonical Wnt signaling (Major et al., 2008). Sall1-dependent factors from the MM also regulate the expression of Wnt9b to control the strength and domain of the inductive signal from the UB. Together, these two activities of Sall1 ensure that as the UB branches and induces the CM to differentiate, the population of progenitor cells is not depleted and remains adequate to produce a normal complement of nephrons.
MATERIALS AND METHODS Mice
Sall1GFPmice have been previously described (Takasato et al., 2004) and
bred onto the ICR background for at least ten generations. Female mice were checked for the presence of a mucosal plug, and noon on the day of detection was considered to be E0.5. These studies were performed according to the St. Louis University and VA St. Louis Health Care System animal care guidelines.
Whole-mount in situ hybridization, histology and immunohistochemistry
[image:10.612.321.548.57.197.2]In situhybridization was performed as previously described (Kiefer et al., 2010). Primer sequences used to produce the probes are listed in supplementary material Table S2. Embryonic kidneys were embedded in paraffin, sectioned at 4 μm, and stained using Harris’ Hematoxylin and Eosin Y (Sigma-Aldrich) for histology. For immunofluorescence, sections were boiled in 10 mM citric acid, pH 6, for antigen retrieval, and incubated with the following primary antibodies: rabbit anti-Sall1 (1:1000, Rauchman Lab), mouse anti-NCAM (1:500, Sigma-Aldrich), mouse anti-cytokeratin (1:1000, Sigma-Aldrich), mouse anti-Lhx1 (1:50, Developmental Studies Hybridoma Bank, University of Iowa), rabbit anti-Wt1 (1:1000, Santa Cruz), rabbit anti-Pax2 (1:1000, Covance), rabbit anti-CDH6 (1:1000, Sigma-Aldrich), rabbit anti-Lef1 (1:250, Cell Signaling), rabbit anti-CITED1 (1:800, Thermo Fisher Scientific), rabbit anti-SIX2 (1:200, Lifespan Biosciences), mouse anti-pHH3 (1:100, Millipore), rabbit anti-Jag1 (1:250, Santa Cruz), rabbit anti-laminin (1:500, Sigma-Aldrich), rat anti-R-cadherin (1:5, Developmental Studies Hybridoma Bank, University of Iowa), and biotin anti-LTL (1:100, Vector Laboratories). Antibody reactivity was detected using Cy3-labeled anti-mouse IgG (1:2000, Jackson ImmunoResearch), Alexa-Fluor-488-labeled anti-rabbit IgG (1:400, Life Technologies), Cy3-labeled anti-rat IgG (1:2000, Jackson ImmunoResearch), and fluorescein streptavidin (1:100, Vector Laboratories). Antigen retrieval was not used for sections co-stained with the R-cadherin and Pax2 primary antibodies (Fig. 3A). Without antigen retrieval Pax2 staining is strong in the ureter and very weak in the CM and differentiating structures. Sections were imaged using an Olympus 41BX upright epifluorescence microscope.
Fig. 7. Regulation of renal progenitors by Sall1.Loss of Sall1in renal progenitors (CM) leads to reduced Six2and Fgf20expression, and the inductive Wnt9bsignal is increased. This promotes differentiation of renal progenitors to renal vesicles (RVs) at the expense of progenitor cell self-renewal.
Quantification of UB branching
Embryonic kidneys were immunostained and the number of cytokeratin+ UB tips was counted on at least five non-sequential sections (20× magnification) from at least two independent embryos for each stage and genotype. Results are reported as the average number of tips per section ± s.e.m. Statistical analysis using standard t-tests was performed.
Quantitative real-time PCR (qRT-PCR)
Total RNA was isolated from sorted cells using an RNeasy Micro Kit or from embryonic kidney tissue using an RNeasy Mini Kit according to the manufacturer’s protocol (Qiagen). cDNA was prepared using the High Capacity RNA-to-cDNA kit (Life Technologies). Primer sequences are listed in supplementary material Table S1. qRT-PCR was performed using an ABI 7300 Real-Time PCR Thermocycler and SYBR Green PCR Master Mix (Life Technologies) as described previously (Kiefer et al., 2012). Real-time reactions were performed in triplicate and relative expression was calculated using the delta CT method and normalized to Rpl19or Hprt1control transcripts (Kiefer et al., 2012).
Cell cycle analysis
Embryonic kidneys were disaggregated using 50 μl 0.05% Trypsin-EDTA for 5-10 minutes on ice. Cells were fixed for 5 minutes at room temperature with 0.25% PFA, pelleted, washed with PBS, and incubated with 75% ethanol for 10 minutes. Cells were then stained in propidium iodide (PI; 50 μg/ml PI, 0.1 mg/ml RNase A, 0.1% Triton X-100 and 0.1 mM EDTA) for 1 hour at room temperature, and the cell cycle was analyzed using a FACS Calibur and ModFitLT V3.0 (Win32) software.
Mitotic and apoptotic index
Mitotic index was determined by staining embryonic kidneys for pHH3 and Sall1. Nuclei were stained using DAPI. The ratio of (pHH3+Sall1+)/(total Sall1+) cells was calculated. At least 800 nuclei for each stage and genotype were counted on at least five non-sequential sections (20× magnification) from at least two independent embryos. The apoptotic index was determined by performing TUNEL analysis using the ApopTag Red In SituApoptosis Detection Kit (Millipore) according to the manufacturer’s instructions. The ratio of (TUNEL+Sall1+)/(total Sall1+) cells was calculated. At least 900 nuclei for each stage and genotype were counted on at least five non-sequential sections (20× magnification) from at least two independent embryos. Results were reported as the mitotic/apoptotic ratio ± s.e.m. Statistical analysis using standard t-tests was performed.
Embryonic kidney organ culture
Embryonic kidney culture was performed as previously described (Barak and Boyle, 2011) with the following exceptions: kidneys were cultured on 0.1 μm filters (Millipore) supported by a metal grid, in DMEM and 10% FBS. The kidneys were imaged daily using a Leica M165 FC fluorescent stereo microscope to monitor development. Explants were stained overnight at 4°C with mouse-anti Lhx1 antibody (1:10, Developmental Studies Hybridoma Bank, University of Iowa) and for 2 hours at room temperature with Cy3-labeled anti-mouse IgG (1:800, Jackson ImmunoResearch) secondary antibody. Kidneys were imaged with an Olympus FV1000MPE confocal microscope.
Sall1GFPcell sorting and transcriptional profiling
E11.5 and E12.5 kidneys were disaggregated and sorted on a BD FACSARIA III. GFP+ cells were collected by using wild-type kidneys as a GFP-negative control. Using this method we achieved 93% purity of the GFP+ population of cells by post-sorting analysis. Approximately 100,000 sorted cells were collected into three independent pools for each sample and RNA extracted using Qiagen RNeasy Micro Kit. RNA integrity and concentration were tested using the Agilent Bioanalyzer on an RNA Pico chip. Total RNA (5-10 ng) was used for probe synthesis using NuGen WT-Ovation Pico + Exon Assay and the probe hybridized to Affymetrix GeneChip Mouse Gene 1.0 ST arrays. Probe production and hybridization were performed at the Cincinnati Children’s Hospital Gene Expression
Microarray Core. Array normalization, fold change, and statistical analysis were performed using R (http://www.r-project.org/) and Bioconductor (http://www.bioconductor.org/). Array data have been submitted to ArrayExpress with accession number E-MTAB-2159.
Acknowledgements
The authors thank the Flow Cytometry Core Facility and the Microscopy Core at St. Louis University for their services. We appreciate the assistance of Steven Potter and Shawn Smith at the Microarray Core Facility, Cincinnati Children’s Hospital, Cincinnati, OH. Ryuichi Nishinakamura generously provided Sall1GFP
mice. We also thank Darcy Denner and Jake Basta for thoughtful reading of the manuscript and Akbar Siddiqui for valuable assistance with the bioinformatic analysis of the microarray data.
Competing interests
The authors declare no competing financial interests.
Author contributions
J.M.B., S.M.K. and M.R. developed concepts, performed data analysis, and prepared and revised the manuscript. J.M.B., S.M.K. and L.R. performed experiments. D.D. assisted with microarray data analysis.
Funding
This work was funded by the American Heart Association and the National Institute of Diabetes and Digestive and Kidney Diseases. Deposited in PMC for release after 12 months.
Supplementary material
Supplementary material available online at
http://dev.biologists.org/lookup/suppl/doi:10.1242/dev.095851/-/DC1
References
Barak, H. and Boyle, S. C.(2011). Organ culture and immunostaining of mouse embryonic kidneys. Cold Spring Harb. Protoc.2011, pdb prot5558.
Barak, H., Huh, S. H., Chen, S., Jeanpierre, C., Martinovic, J., Parisot, M., Bole-Feysot, C., Nitschké, P., Salomon, R., Antignac, C. et al.(2012). FGF9 and FGF20 maintain the stemness of nephron progenitors in mice and man. Dev. Cell
22, 1191-1207.
Blank, U., Brown, A., Adams, D. C., Karolak, M. J. and Oxburgh, L.(2009). BMP7 promotes proliferation of nephron progenitor cells via a JNK-dependent mechanism.
Development136, 3557-3566.
Boyle, S., Misfeldt, A., Chandler, K. J., Deal, K. K., Southard-Smith, E. M., Mortlock, D. P., Baldwin, H. S. and de Caestecker, M.(2008). Fate mapping using Cited1-CreERT2 mice demonstrates that the cap mesenchyme contains self-renewing progenitor cells and gives rise exclusively to nephronic epithelia. Dev. Biol.
313, 234-245.
Boyle, S. C., Kim, M., Valerius, M. T., McMahon, A. P. and Kopan, R.(2011). Notch pathway activation can replace the requirement for Wnt4 and Wnt9b in mesenchymal-to-epithelial transition of nephron stem cells. Development138, 4245-4254.
Brown, A. C., Muthukrishnan, S. D., Guay, J. A., Adams, D. C., Schafer, D. A., Fetting, J. L. and Oxburgh, L.(2013). Role for compartmentalization in nephron progenitor differentiation. Proc. Natl. Acad. Sci. USA110, 4640-4645.
Brunskill, E. W., Aronow, B. J., Georgas, K., Rumballe, B., Valerius, M. T., Aronow, J., Kaimal, V., Jegga, A. G., Grimmond, S., McMahon, A. P. et al.(2008). Atlas of gene expression in the developing kidney at microanatomic resolution. Dev. Cell15, 781-791.
Carroll, T. J., Park, J. S., Hayashi, S., Majumdar, A. and McMahon, A. P.(2005). Wnt9b plays a central role in the regulation of mesenchymal to epithelial transitions underlying organogenesis of the mammalian urogenital system. Dev. Cell9, 283-292.
Couillard, M. and Trudel, M.(2009). C-myc as a modulator of renal stem/progenitor cell population. Dev. Dyn.238, 405-414.
Das, A., Tanigawa, S., Karner, C. M., Xin, M., Lum, L., Chen, C., Olson, E. N., Perantoni, A. O. and Carroll, T. J.(2013). Stromal-epithelial crosstalk regulates kidney progenitor cell differentiation. Nat. Cell Biol.15, 1035-1044.
Denner, D. R. and Rauchman, M.(2013). Mi-2/NuRD is required in renal progenitor cells during embryonic kidney development. Dev. Biol.375, 105-116.
Dudley, A. T., Lyons, K. M. and Robertson, E. J.(1995). A requirement for bone morphogenetic protein-7 during development of the mammalian kidney and eye.
Genes Dev.9, 2795-2807.
Grieshammer, U., Le Ma, Plump, A. S., Wang, F., Tessier-Lavigne, M. and Martin, G. R.(2004). SLIT2-mediated ROBO2 signaling restricts kidney induction to a single site. Dev. Cell6, 709-717.
Grieshammer, U., Cebrián, C., Ilagan, R., Meyers, E., Herzlinger, D. and Martin, G. R.(2005). FGF8 is required for cell survival at distinct stages of nephrogenesis and for regulation of gene expression in nascent nephrons. Development132,
Karantzali, E., Lekakis, V., Ioannou, M., Hadjimichael, C., Papamatheakis, J. and Kretsovali, A. (2011). Sall1 regulates embryonic stem cell differentiation in association with nanog. J. Biol. Chem.286, 1037-1045.
Karner, C. M., Das, A., Ma, Z., Self, M., Chen, C., Lum, L., Oliver, G. and Carroll, T. J. (2011). Canonical Wnt9b signaling balances progenitor cell expansion and differentiation during kidney development. Development138, 1247-1257. Keller, G., Zimmer, G., Mall, G., Ritz, E. and Amann, K.(2003). Nephron number in
patients with primary hypertension. N. Engl. J. Med.348, 101-108.
Kiefer, S. M., McDill, B. W., Yang, J. and Rauchman, M.(2002). Murine Sall1 represses transcription by recruiting a histone deacetylase complex. J. Biol. Chem.
277, 14869-14876.
Kiefer, S. M., Robbins, L., Stumpff, K. M., Lin, C., Ma, L. and Rauchman, M.(2010). Sall1-dependent signals affect Wnt signaling and ureter tip fate to initiate kidney development. Development137, 3099-3106.
Kiefer, S. M., Robbins, L. and Rauchman, M.(2012). Conditional expression of Wnt9b in Six2-positive cells disrupts stomach and kidney function. PLoS ONE7, e43098.
Kispert, A., Vainio, S. and McMahon, A. P.(1998). Wnt-4 is a mesenchymal signal for epithelial transformation of metanephric mesenchyme in the developing kidney.
Development125, 4225-4234.
Kobayashi, A., Valerius, M. T., Mugford, J. W., Carroll, T. J., Self, M., Oliver, G. and McMahon, A. P.(2008). Six2 defines and regulates a multipotent self-renewing nephron progenitor population throughout mammalian kidney development. Cell Stem Cell3, 169-181.
Kohlhase, J. (2000). SALL1 mutations in Townes-Brocks syndrome and related disorders. Hum. Mutat.16, 460-466.
Kohlhase, J., Wischermann, A., Reichenbach, H., Froster, U. and Engel, W. (1998). Mutations in the SALL1 putative transcription factor gene cause Townes-Brocks syndrome. Nat. Genet.18, 81-83.
Lauberth, S. M. and Rauchman, M.(2006). A conserved 12-amino acid motif in Sall1 recruits the nucleosome remodeling and deacetylase corepressor complex. J. Biol. Chem.281, 23922-23931.
Lauberth, S. M., Bilyeu, A. C., Firulli, B. A., Kroll, K. L. and Rauchman, M.(2007). A phosphomimetic mutation in the Sall1 repression motif disrupts recruitment of the nucleosome remodeling and deacetylase complex and repression of Gbx2. J. Biol. Chem.282, 34858-34868.
Liang, J., Wan, M., Zhang, Y., Gu, P., Xin, H., Jung, S. Y., Qin, J., Wong, J., Cooney, A. J., Liu, D. et al.(2008). Nanog and Oct4 associate with unique transcriptional repression complexes in embryonic stem cells. Nat. Cell Biol.10, 731-739. Little, M. H. and McMahon, A. P.(2012). Mammalian kidney development: principles,
progress, and projections. Cold Spring Harb. Perspect. Biol.4, a008300.
Major, M. B., Roberts, B. S., Berndt, J. D., Marine, S., Anastas, J., Chung, N., Ferrer, M., Yi, X., Stoick-Cooper, C. L., von Haller, P. D. et al.(2008). New regulators of Wnt/beta-catenin signaling revealed by integrative molecular screening.
Sci. Signal.1, ra12.
Mugford, J. W., Sipilä, P., McMahon, J. A. and McMahon, A. P.(2008). Osr1 expression demarcates a multi-potent population of intermediate mesoderm that undergoes progressive restriction to an Osr1-dependent nephron progenitor compartment within the mammalian kidney. Dev. Biol.324, 88-98.
Nishinakamura, R., Matsumoto, Y., Nakao, K., Nakamura, K., Sato, A., Copeland, N. G., Gilbert, D. J., Jenkins, N. A., Scully, S., Lacey, D. L. et al.(2001). Murine homolog of SALL1 is essential for ureteric bud invasion in kidney development.
Development128, 3105-3115.
Nyengaard, J. R. and Bendtsen, T. F.(1992). Glomerular number and size in relation to age, kidney weight, and body surface in normal man. Anat. Rec.232, 194-201.
Osafune, K., Takasato, M., Kispert, A., Asashima, M. and Nishinakamura, R. (2006). Identification of multipotent progenitors in the embryonic mouse kidney by a novel colony-forming assay. Development133, 151-161.
Oxburgh, L., Chu, G. C., Michael, S. K. and Robertson, E. J.(2004). TGFbeta superfamily signals are required for morphogenesis of the kidney mesenchyme progenitor population. Development131, 4593-4605.
Park, J. S., Ma, W., O’Brien, L. L., Chung, E., Guo, J. J., Cheng, J. G., Valerius, M. T., McMahon, J. A., Wong, W. H. and McMahon, A. P.(2012). Six2 and Wnt regulate self-renewal and commitment of nephron progenitors through shared gene regulatory networks. Dev. Cell23, 637-651.
Reynolds, N., Latos, P., Hynes-Allen, A., Loos, R., Leaford, D., O’Shaughnessy, A., Mosaku, O., Signolet, J., Brennecke, P., Kalkan, T. et al. (2012). NuRD suppresses pluripotency gene expression to promote transcriptional heterogeneity and lineage commitment. Cell Stem Cell10, 583-594.
Sajithlal, G., Zou, D., Silvius, D. and Xu, P. X.(2005). Eya 1 acts as a critical regulator for specifying the metanephric mesenchyme. Dev. Biol.284, 323-336. Self, M., Lagutin, O. V., Bowling, B., Hendrix, J., Cai, Y., Dressler, G. R. and Oliver,
G.(2006). Six2 is required for suppression of nephrogenesis and progenitor renewal in the developing kidney. EMBO J.25, 5214-5228.
Takasato, M., Osafune, K., Matsumoto, Y., Kataoka, Y., Yoshida, N., Meguro, H., Aburatani, H., Asashima, M. and Nishinakamura, R. (2004). Identification of kidney mesenchymal genes by a combination of microarray analysis and Sall1-GFP knockin mice. Mech. Dev.121, 547-557.
Tena, J. J., Neto, A., de la Calle-Mustienes, E., Bras-Pereira, C., Casares, F. and Gómez-Skarmeta, J. L.(2007). Odd-skipped genes encode repressors that control kidney development. Dev. Biol.301, 518-531.
Thiagarajan, R. D., Georgas, K. M., Rumballe, B. A., Lesieur, E., Chiu, H. S., Taylor, D., Tang, D. T., Grimmond, S. M. and Little, M. H.(2011). Identification of anchor genes during kidney development defines ontological relationships, molecular subcompartments and regulatory pathways. PLoS ONE6, e17286. Uchiyama, Y., Sakaguchi, M., Terabayashi, T., Inenaga, T., Inoue, S., Kobayashi,
C., Oshima, N., Kiyonari, H., Nakagata, N., Sato, Y. et al.(2010). Kif26b, a kinesin family gene, regulates adhesion of the embryonic kidney mesenchyme. Proc. Natl. Acad. Sci. USA107, 9240-9245.
Yu, J., Valerius, M. T., Duah, M., Staser, K., Hansard, J. K., Guo, J. J., McMahon, J., Vaughan, J., Faria, D., Georgas, K. et al.(2012). Identification of molecular compartments and genetic circuitry in the developing mammalian kidney.
Development139, 1863-1873.
Zhang, J., Jackson, A. F., Naito, T., Dose, M., Seavitt, J., Liu, F., Heller, E. J., Kashiwagi, M., Yoshida, T., Gounari, F. et al. (2011). Harnessing of the nucleosome-remodeling-deacetylase complex controls lymphocyte development and prevents leukemogenesis. Nat. Immunol.13, 86-94.