IJPSR (2013), Vol. 4, Issue 2 (Research Article)
Received on 28 September, 2012; received in revised form, 24 November, 2012; accepted, 23 January, 2013
DEVELOPMENT AND VALIDATION OF A HPLC METHOD FOR IN-VIVO STUDY OF DICLOFENAC POTASSIUM
Mohamed Aly Abd El Aziz Aly El Degwy*, Mohamed Aly Mahmoud Aly and Mamdouh Salah El Den
Mepaco Pharmaceutical Company, 141 Street Ahmed Zaki, Maadi, Cairo, Egypt
ABSTRACT
A High Performance Liquid Chromatographic method was developed for determination of Diclofenac Potassium in in-vivo study during bioavailability study. The chromatographic separation was conducted on Shimadzu Prominence LC 20 connected with PDA detector; using mixed column ODS/Cyano; ACE, (100 x 4.6 mm, 5 µm). The mobile phase was isocratic consisted of Methanol: 50 mM potassium dihydrogen phosphate buffer, in ratio of (50 : 50 v/v) and was delivered to the system at a flow rate of 1.5 ml/min, with an injection volume of 20 µl and the detection wavelength (λ
max) was 280 nm. Diazepam was used as internal standard. All assays were
performed at ambient conditions. The calibration curve of Diclofenac Potassium in plasma was linear with correlation coefficient (r2) = 0.9996; over a concentration range of 0.25 - 3 ug/ml. The retention times for Diclofenac Potassium and the internal standard (Diazepam) were found to be 5.95 and 7.90 minutes, respectively. The mean recovery was found to be 90.57%.The relative standard deviation (RSD) was found to be < 2. The proposed method was validated and successfully applied to the determination of Diclofenac Potassium in human plasma for bioavailability studies.
INTRODUCTION: Diclofenac Potassium is an effective non-steroidal anti-inflammatory drug (NSAID) indicated for various painful indications. Chemically, Diclofenac Potassium is Potassium [2-[(2,6-dichlorophenyl)amino] phenyl]acetate, (C14H10Cl2KNO2), (Molecular weight =
334.24) and having a melting point of 283-285oC. Its structure is as follows 1:
FIGURE 1: CHEMICAL STRUCTURE OF DICLOFENAC POTASSIUM
It is official on USP 2, BP 3, and Ph. Eur which describe potentiometric method for estimation of the drug. Various literatures disclose UV spectrophotometric methods and different HPLC methods for estimation of Diclofenac Potassium in different dosage forms 4 & 5 and in different biological fluids as plasma and serum 6
& 7
.
The present manuscript describes a new simple, sensitive, accurate, precise, and rapid HPLC method for estimation of Diclofenac Potassium in human plasma.
MATERIALS AND METHODS: Diclofenac Potassium
standard was supplied by Sinochem, China. Acetonitrile, Water, and Methanol were HPLC grade; supplied by Merck, Germany.
Correspondence to Author:
Mohd. Aly Abd El Aziz Aly El Degwy
Formulation Section Head, Mepaco Pharmaceutical Company, 141 Street Ahmed Zaki, Maadi, Cairo, Egypt E-mail: [email protected]
Keywords:
Diclofenac Potassium, HPLC, Mixed column, Method Validation, In-vivo
Diazepam (as internal standard) and Potassium dihydrogen phosphate were supplied by Sigma-Aldrich, Germany. The method development was performed with Shimadzu Prominence LC 20 connected with PDA detector; using mixed column ODS/Cyano; ACE, (100 x 4.6 mm, 5 µm). Injection volume was 20 µl.
Analytical procedure for determination of Diclofenac Potassium in plasma:
1. Assay Method Description and Chromatographic
conditions: A simple, rapid, specific and reliable HPLC assay of Diclofenac Potassium in human plasma has been developed. The analysis was conducted on Shimadzu Prominence LC 20 connected with PDA detector; using mixed column ODS/Cyano; ACE, (100 x 4.6 mm, 5 µm). The mobile phase was isocratic consisted of Methanol: 50 mM Potassium dihydrogen phosphate, in ratio of (50 : 50 v/v) and was delivered to the system at a flow rate of 1.5 ml/min, with an injection volume of 20 µl and the detection wavelength (λ max) was
280 nm. Diazepam was used as internal standard. All assays were performed at ambient conditions.
2. Preparation of stock and working standard
solution: Stock solution of Diazepam (internal standard) solution was prepared by dissolving 50 mg of Diazepam in 100 ml methanol; then sonication for 5 minutes (500 µg/ml). The working internal standard was prepared on each day of analysis by diluting the stock solution to contain (1.5 µg/ml). Stock solution of Diclofenac Potassium was prepared by dissolving 50 mg Diclofenac Potassium in 100 ml methanol; then sonication for 5 minutes (500 µg/ml). The working solution was prepared on each day of analysis by diluting the stock solution with methanol to give serial dilutions containing 0.25, 0.5, 1, 1.5, 2, 2.5 and 3 µg/ml of Diclofenac Potassium; which were shaken well and filtered over 0.45 µm syringe filter and injected onto HPLC.
3. Plasma sample preparation for determination of Diclofenac Potassium: The extraction procedure was applied in the preparation of plasma samples
1 ml of internal standard working solution and 1 ml methanol were added. The mixture was vortexed for 2 minutes and centrifuged at 6000 rpm for 30 minutes. The upper layer was transferred to another tube and filtered through 0.45 µm syringe filter. A 20 µl volume of the supernatant was injected onto the HPLC column. Concentrations of Diclofenac Potassium in unknown samples were calculated with reference to the prepared calibration curve. Retention time of Diclofenac Potassium was 5.95 minutes.
4. Preparation of in-vivo standard calibration curve: For calibration curve, plasma standards were prepared by spiking 1 ml of blank plasma with 1 ml of the internal standard working solution and appropriate volumes of Diclofenac Potassium working solution to produce concentrations ranging from (0.25, 0.5, 1, 1.5, 2, 2.5 and 3 µg/ml). The spiked plasma standards were processes as described above.
The calibration curve was obtained by plotting chromatographic peak area ratios (Diclofenac Potassium/Diazepam) against the corresponding nominal Diclofenac Potassium concentration added. Samples were prepared and injected on the same day.
5. Sample calculation: The unknown sample
concentration was calculated from the following formula: C = [(R - Y) /S]; where C is Diclofenac Potassium concentration, R is the peak area ratio (drug/internal standard), S is the slope of the calibration curve and Y is the Y-intercept.
6. Assay method Validation:
c. Intraday Accuracy and Precision: The intraday accuracy and precision evaluations were assessed by repeated analysis and human plasma samples containing different concentrations of Diclofenac Potassium on separate occasions in the same day (3 times on the same day). The analytical precision of the method was determined by the relative standard deviation of the percentage drug recovered.
d. Inter-day Reproducibility: The day to day
reproducibility of the assay for plasma samples was evaluated by comparing the least squares linear regression analysis of three standard plots obtained from spiked plasma standard at three different days over three weeks period.
e. Freeze and Thaw Stability in Human Plasma: Diclofenac Potassium stability in human plasma was determined after three freeze-thaw cycles. In order to determine the effect of storage on the stability of frozen samples, three concentrations were selected representing the low, medium and high spiked plasma samples of the calibration curves. These concentrations were analyzed when fresh and after storage just prior to analysis (storage at -20°C for 24 hours). The freeze-thaw cycle were repeated two more times, and then analyzed using the previously validated method.
f. Extraction Recovery: Relative recoveries of all Diclofenac Potassium concentrations used in the plasma standards were evaluated by comparing their peak area ratios with those obtained from direct injection of unprocessed reference solutions of the same concentrations.
RESULTS AND DISCUSSION:
Assay Method Validation of Diclofenac Potassium:
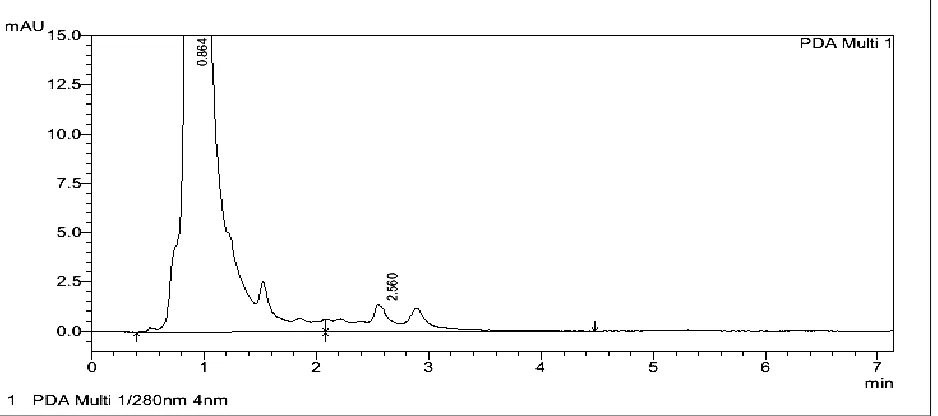
1. Selectivity: Chromatograms obtained at the lower
of sensitivity for drug free plasma showed no interfering peaks at the retention times of Diclofenac Potassium and the internal standard. Typical chromatograms obtained from a processed blank human plasma sample alone, with Diclofenac Potassium and with Diclofenac Potassium/Diazepam are illustrated in figures 2, 3, and (4) respectively.
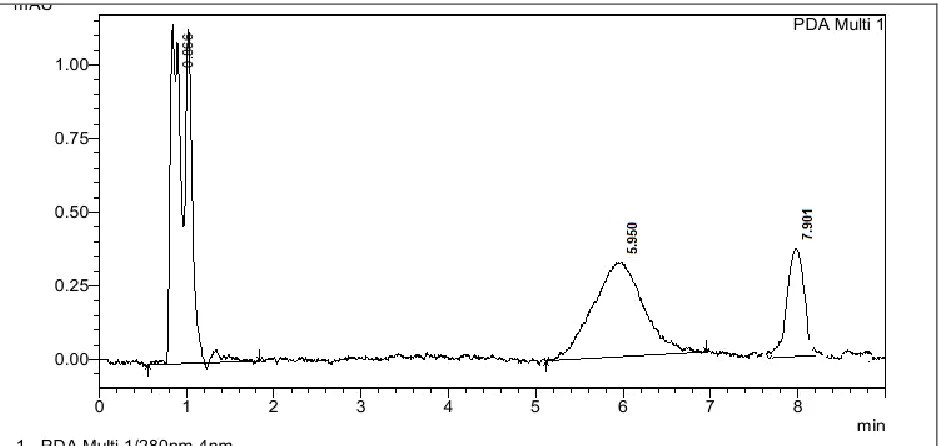
[image:3.612.74.543.472.680.2]The retention times of Diclofenac Potassium and the internal standard (Diazepam) are approximately 5.95 and 7.9, respectively. Both peaks were sharp with good baseline resolution and minimal tailing, thus facilitating accurate measurements of the peak area ratios. No interferences by the metabolites or normal constituents of plasma were observed. The overall chromatographic time is 10 minutes.
FIGURE 3: A TYPICAL CHROMATOGRAM OBTAINED FROM PROCESSED HUMAN PLASMA SPIKED WITH DICLOFENAC POTASSIUM
FIGURE 4: A TYPICAL CHROMATOGRAM OBTAINED FROM PROCESSED HUMAN PLASMA SPIKED WITH DICLOFENAC POTASSIUM AND DIAZEPAM
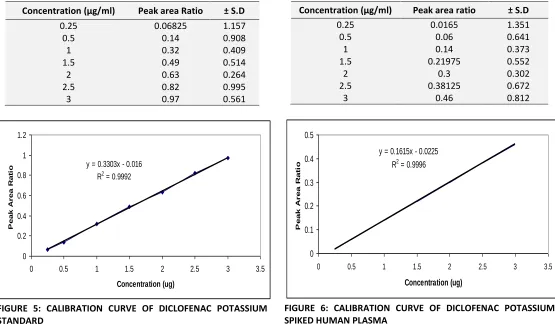
2. Linearity and Linear working range: Table 1 and
figure 5 represents the standard curve of
Diclofenac Potassium using HPLC. The regression equation: Y = 0.3303x – 0.016 (where Y is the peak area ratio of Diclofenac Potassium and x is the concentration of Diclofenac Potassium in µg/ml). The lower limit of quantification was 0.25 µg/ml, with a linear response across the full range of concentrations from 0.25 - 3 µg/ml (R2 = 0.9992). Standard curve obtained for Diclofenac Potassium
Linear regression analysis of the standard calibration plot for human plasma was y = 0.1615x – 0.0225, where y and x are the peak area ratio and Diclofenac Potassium concentration, respectively. The correlation coefficient of the line was (R2 = 0.9996). The data is represented by table 2 and figure 6.
[image:4.612.73.543.292.515.2]TABLE 1: RELATIONSHIP BETWEEN THE CONCENTRATION OF DICLOFENAC POTASSIUM AND THE MEAN RELATIVE PEAK AREA USING HPLC
Concentration (µg/ml) Peak area Ratio ± S.D
0.25 0.06825 1.157
0.5 0.14 0.908
1 0.32 0.409
1.5 0.49 0.514
2 0.63 0.264
2.5 0.82 0.995
3 0.97 0.561
y = 0.3303x - 0.016
R2 = 0.9992
0 0.2 0.4 0.6 0.8 1 1.2
0 0.5 1 1.5 2 2.5 3 3.5
Concentration (ug) P e a k A r e a R a ti o
FIGURE 5: CALIBRATION CURVE OF DICLOFENAC POTASSIUM STANDARD
TABLE 2: RELATIONSHIP BETWEEN THE CONCENTRATION OF DICLOFENAC POTASSIUM IN HUMAN PLASMA AND THE MEAN RELATIVE PEAK AREA USING HPLC
Concentration (µg/ml) Peak area ratio ± S.D
0.25 0.0165 1.351
0.5 0.06 0.641
1 0.14 0.373
1.5 0.21975 0.552
2 0.3 0.302
2.5 0.38125 0.672
3 0.46 0.812
y = 0.1615x - 0.0225 R2 = 0.9996
0 0.1 0.2 0.3 0.4 0.5
0 0.5 1 1.5 2 2.5 3 3.5
Concentration (ug) P e a k A r e a R a ti o
[image:5.612.30.585.80.405.2]FIGURE 6: CALIBRATION CURVE OF DICLOFENAC POTASSIUM SPIKED HUMAN PLASMA
TABLE 3: ANALYTICAL PRECISION FOR THE ANALYSIS OF DICLOFENAC POTASSIUM PERFORMED ON 3 SETS OF STANDARD CURVES OF THE SAME DAY
Spiked conc. (µg/ml) Peak area ratio Mean ± S.D RSD %
1 2 3
0.5 0.05744 0.05675 0.05731 0.06 0.000367 0.641
1 0.13857 0.13834 0.13933 0.14 0.000518 0.373
1.5 0.21785 0.21859 0.21712 0.22 0.000735 0.337
2 0.30326 0.30614 0.3032 0.30 0.001680 0.552
2.5 0.38944 0.38467 0.38652 0.39 0.002405 0.871
3 0.45973 0.46251 0.46102 0.46 0.001391 0.302
r2 0.99938 0.99966 0.999866 0.99963
Slope 0.162826 1.0017 0.99676 0.162907
Intercept -0.02389 -0.00033 0.000428 -0.024
4. Inter-day (Day to Day) Reproducibility: Table 4 reveals the results of the inter-day evaluations. The results show that the correlation coefficients mean was higher than 0.99 and the coefficient of variance of the slope of the three trend lines was less than 2%. The analysis of variance of the data showed no significant difference in the slopes of the three standard plots. The results thus confirmed excellent linearity of the calibration lines and high reproducibility of the assay.
TABLE 4: INTRA-DAY REPRODUCIBILITY FOR THE STANDARD PLOT OF DICLOFENAC POTASSIUM IN PLASMA
Standard
plot i Slope
ii
Intercept ii Correlation Coefficient
1 0.162907 -0.0240 1.00
2 0.163049 -0.02378 0.9997
3 0.162977 -0.02396 0.9993
i- Obtained in 3 different days
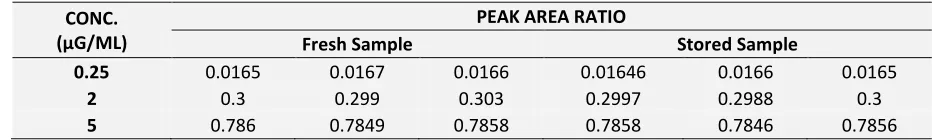
[image:5.612.64.553.440.579.2]5. Freeze and thaw stability in Human Plasma: Table 5 shows the peak area ratio of three Diclofenac Potassium concentrations, namely 0.25, 2 and 5 μg/ml; representing low, medium and high spiked
plasma samples of the calibration curve when fresh and stored at -20°C. Slight difference between spiked drug concentration in both fresh and stored samples were observed.
TABLE 5: THE PEAK AREA RATIO OF DICLOFENAC POTASSIUM TO THE INTERNAL STANDARD OF THREE DIFFERENT CONCENTRATIONS, (FRESH AND STORED AT -20°C)
CONC. (µG/ML)
PEAK AREA RATIO
Fresh Sample Stored Sample
0.25 0.0165 0.0167 0.0166 0.01646 0.0166 0.0165
2 0.3 0.299 0.303 0.2997 0.2988 0.3
5 0.786 0.7849 0.7858 0.7858 0.7846 0.7856
6. Extraction Recovery: Data of the extraction
recovery of Diclofenac Potassium from plasma samples fortified with the drug in the same concentrations of the drug used in the calibration curve in human plasma are shown in table 6. The extraction recovery ranged from (82.69 – 96.12%)
[image:6.612.70.536.132.202.2]with a mean percent recovery 90.576% and the average coefficient of variation was 0.717%. The previous outcomes revealed the suitability of the method for the determination of Diclofenac Potassium in the plasma samples.
TABLE 6: WITHIN DAY ACCURACY FOR DETERMINATION OF DICLOFENAC POTASSIUM IN PLASMA
Diclofenac Potassium (μg/ml) n = 3 Mean Recovery (μg/ml) ± S.D Recovery % CV%
0.5
3
0.41345 0.00675 82.69 2.00
1 0.8575 0.00587 85.75 0.838
1.5 1.33095 0.00758 88.73 0.697
2 1.9224 0.00262 96.12 0.167
2.5 2.36775 0.007 94.71 0.364
3 2.8629 0.0055 95.43 0.236
CONCLUSIONS: The developed method showed
adequate accuracy, precision, sensitivity and reproducibility. From which, it can be concluded that the proposed method can be used for in-vivo analysis of Diclofenac Potassium in plasma.
ACKNOWLEDGEMENTS: The authors are highly
thankful to Mepaco-Medifood Pharmaceutical Company for providing all the facilities to carry out this work. Also, we appreciate all the help from our fellow colleges in the research and development department, by which we would not have achieved our work.
REFERENCES:
1. Martindale 36 ed, Analgesics Anti-inflammatory Drugs and Antipyretics, Diclofenac Potassium, 2006; 44.
2. United State Pharmacopoeia 35 – NF 25, Diclofenac Potassium Monograph, 2012.
3. British Pharmacopoeia, Ph. Eur. monograph 1508, Diclofenac Potassium Monograph, 2012.
4. Matthieu Tubino, Rafael Leandro de Souza, Determination of Diclofenac in Pharmaceutical Preparations by Diffuse Reflectance Photometry, Talanta, 2006, 68: 776-780.
5. Beaulieu N, Lovering, E.G, Lefrancois, J, Ong, H., Determination of Diclofenac Sodium and Related Compounds in Raw materials and Formulation. J. Assoc. Off. Anal. Chem., 1990, 73:698-701. 6. A. A. Al-angary , Y. M. el-Sayed , M. A. al-Meshal, al-DardiriM.M,
G. M. Mahrous, HPLC Method for the Simultaneous Determination of Methocarbamol and Diclofenac Potassium in Serum, J. Clin. Pharm ,1991, 16: 93-101.
7. Chmielewska, A., Konieczna, L., Plenis, A., Bieniecki, M. and Lamparczyk, H., Determination of Diclofenac in Plasma by High-performance Liquid Chromatography with Electrochemical Detection. Biomed. Chromatogr., 2006, 20: 119–124.
How to cite this article: