3461
HYBRID METHOD FOR MEDICAL IMAGE SGMENTATION
IN WAVELET DOMAIN
1AREE ALI MOHAMMED, 2GORAN OMER ALI
1Department of Computer Science, University of Sulaimani and University of Human Development, KRG,
Iraq
2Department of Computer Science, University of Sulaimani, KRG, Iraq
E-mail: 1[email protected], [email protected], 2[email protected]
ABSTRACT
In this research, a hybrid medical image segmentation in both spatial and frequency domain is proposed. It is aimed to detect tumor and find the accuracy detection in both spatial and frequency domain. An important algorithm is added to our research which is finding the biggest contour algorithm. This algorithm used to detect tumor region in digital image that differ in properties and provide complementary information about regions, which is not obtained from hybrid image segmentation. This filter is used to remove smaller objects (noise) and extracting only the biggest objects. Finally the average time is found in both spatial and frequency domain. Test results show that for the five set of the image samples, when the contour algorithm is used in both spatial and frequency domain the accuracy is getting better compared with the results obtained without using contour algorithm.
Keywords: Medical Image Segmentation; Wavelet Transform; Contour Algorithm; K-Mean Clustering; Accuracy of Detection
1. INTRODUCTION
Segmentation is a fundamental operation performed on images that divides the image into homogeneous segments or regions to facilitate the analysis of the images. It is the process of grouping pixels together, with each group having at least one or more features in common.
A digital image is essentially an array in two dimensions of square regions known as pixels. In case of gray scale image, the intensity of each pixel is denoted by a numeric value. It is also described as a fixed set of values in digital form of a two-dimensional image called pixel elements or pixels. Digital images can be formed by a number of input devices and techniques: Digital cameras, scanners and coordinate measuring machines [1]. There are different types of digital images which are binary image, gray scale image and color image. A binary image is basically a digitized image which has only two values, zero and one, for each pixel. They are also termed as two-level image. A binary image is stored in memory space as a bitmap. Binary images often ascend in digital image processing as masks
or as the product of certain operations such as segmentation and thresholding [2].
3462 medical applications because doctors exhibit interest in exploring the internal anatomy. Many techniques have been developed based on X-ray or cross-sectional images like Computed Tomography (CT) or Magnetic Resonance Imaging (MRI), or other tomography modalities (SPECT, PET, or ultrasound) [5], [6], [9], [10].
2. RELATED WORKS
Medical image segmentation is considered as a hot research topic. Several researchers have suggested various methodologies and algorithms for image segmentation. In [2] proposed a novel approach to separate the position of tumor objects from other items of an MRI image by using K-means clustering and Threshold filter. The main objective of this research work is to automatically develop a framework that can classify a tumor from abnormal tissues in an accurate way. A hybrid framework that uses the K-means clustering followed by Threshold filter to track down the tumor objects in magnetic resonance (MR) brain images is used. Experiments discover that the method can successfully achieve segmentation for MRI brain images to help pathologists distinguish exactly lesion size and region. In [3] presents an active image segmentation approach using K-means clustering method integrated with Fuzzy C-means algorithm. It is put up with thresholding and level set segmentation steps to provide an accurate brain tumor detection . The proposed technique can get advantages of the K-means clustering in the aspects of minimal counting time. In addition, it can get advantages of the Fuzzy C-means in the aspects of accuracy. The performance of this approach was assessed by different algorithms proposed in a state of art in terms of accuracy and efficiency. The accuracy test was done by comparing the results with the ground truth of each processed image. The experimental results show the effectiveness in case when dealing with a crucial segmentation problems to improve the segmentation quality in minimal execution time. In [1] proposed a new algorithm for color image segmentation using hybrid k-means clustering technique which mixing between two methods , geometric and block method. Geometric method counts on equal areas of distribution. Block method segments the image into uniform areas. In this survey presented a natural validity measure based on the intra-cluster and inter-cluster distance measures which allows determining the number of clusters. In [11] used human’s Knee MRI (Magnetic resonance imaging) images of
patients and applied various image segmentation and edge detection methods for knee cartilage visualization. Pratondo et al proposed a framework to construct a group of (edge-stop functions) ESFs for edge-based active contour models to segment objects with poorly defined boundaries. Experiments on medical images using the distance regularized level set for edge-based active contour models as well as the k-nearest neighbours and the support vector machine confirm the effectiveness of the proposed approach [12]. A novel method, the adaptive local window, for improving level set segmentation technique is proposed in [13]. The window is estimated separately for each contour point, over iterations of the segmentation process, and for each individual object. The method considers the object scale, the spatial texture, and the changes of the energy functional over iterations. The results indicate that our proposed method outperforms the other methods in terms of agreement with the manual marking and dependence on contour initialization or the energy model used.
In [14] a review of recent advances in the development of methods for segmentation of the breast boundary and the pectoral muscle in mammograms is presented. The proposed method will address the most often used methods for segmentation such as thresholding, morphology, region growing, active contours, and wavelet filtering. Mostaar et al, introduced a novel, locally statistical active contour model (ACM) for magnetic resonance image segmentation in the presence of intense inhomogeneity with the ability to determine the position of contour and energy diagram. In the proposed method, the size and position of the initial contour and to count iterations to have a better segmentation is determined. The energy function for 20 to 430 iterations was calculated. The energy function was reduced by about 5and 7% after 70 and 430 iterations, respectively. These results showed that, with increasing iterations, the energy function decreased, but it decreased faster during the early iterations, after which it decreased slowly. Also, this method enables us to stop the segmentation based on the threshold that we define for the energy equation [15].
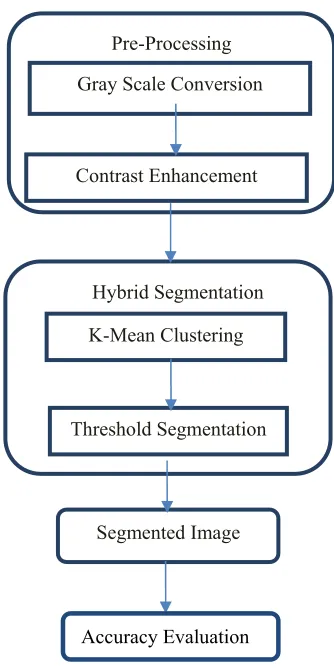
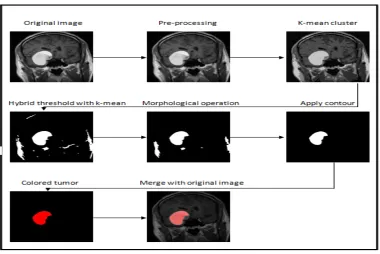
3463 either MRI or CT-Scan image. The input image is first pre-processed by converted from RGB color to gray scale image then contrast enhancement algorithm is applied by using median filter. The segmentation algorithm is applied to detected tumors. Two techniques of image segmentation are used in spatial domain (K-Means clustering algorithm) and (thresholding algorithm).While in the wavelet domain a thresholding is applied on the one level of decomposition (LL) sub-band. The segmented image (binary image) is post-processed by applying morphological operating. Then connected components labeling filter is applied to detect cancer in color. Finally sensitivity and specificity are used to find the accuracy of detection. The general block structures of the proposed image segmentation scheme are shown in Fig 1.
3.1 k-Mean Clustering Algorithm
After the input image is pre-processed, a method based on K-means clustering algorithm is used to detect the tumor on MRI or CT-Scan image [7].
3.2 Threshold Algorithm
After the input image is segmented by applying k-means clustering, then the threshold technique is combining with a k-means algorithm to separate out regions of an image corresponding to objects which we want to analyze. To differentiate the pixels a comparison of each pixel intensity value is performed with respect to a threshold, known as thresholding value. The thresholding value is determined from the intensity of image in gray scale.
The thresholding operation can be mathematically explained as follows:
1, if f(x, y)> T
[image:3.612.326.493.110.444.2](1) 0, if f(x, y) <= T
Figure 1: Proposed Scheme Diagram
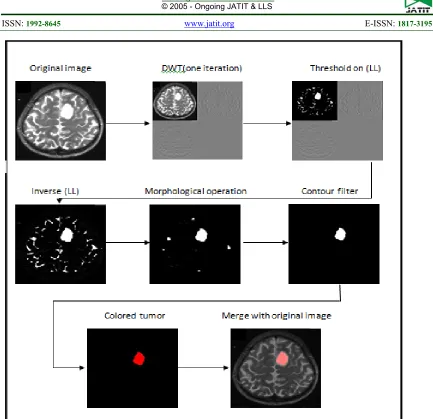
3.3 Medical Image in Wavelet Domain
In this research a Haar wavelet transform is used in MIS. The Haar wavelet transform may be considered to simply pair up input values, storing the variation and passing the sum. This process is repeated recursively, pairing up the sums to provide the next scale: finally resulting in (2n-1) differences and one final sum. In case of images, we need 2D FWT. First, we perform 1D forward transform for all rows, and next, for all columns. For color Images, we deal with RGB components of color, and perform DWT for each component separately. Any component (R G B) has values from 0 to 255 before transformation the values are scaled. For displaying image after transformation, we scale back transformed values [8].
3.4 Thresholding with Wavelet Transform A new thresholding function is proposed for tumor image detection in the wavelet domain. This function has some advantages over classical g(x, y) =
MRI or CT images
Input Image
Pre-Processing
Gray Scale Conversion
Contrast Enhancement
Hybrid Segmentation
Threshold Segmentation K-Mean Clustering
Segmented Image
3464 methods and produces better results in detection tumor. In our research threshold algorithm is applied on (LL) sub-band. The simulation results show that the proposed thresholding function has superior performance. This makes it an efficient method in image detection tumor applications. Fig.2 shows the threshold algorithm in wavelet domain.
3.5 Contour Filter Algorithm
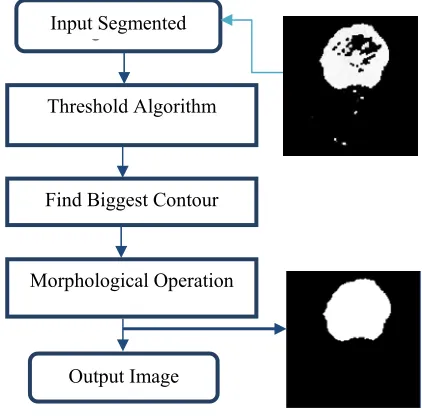
Contour filter is one of the most important methods that are used to detect tumor region in digital image that differ in properties. The motivation of using this filter is to provide complementary information about regions, which is not obtained from hybrid image segmentation. This filter is used to remove smaller objects (noise) and extracting only the biggest objects. The results showed that the use of this filter increases the accuracy in both spatial and frequency domain. After the image is segmented, the contour filter passes through three stages in the first stage image is converted to gray, then the threshold is applied on the gray image. At last the biggest contour is found. Fig. 3 shows the flow diagram for contour filter.
Figure 3: Effect of Contour Filter
4. TEST RESULTS
[image:4.612.336.497.132.244.2]The implementation of the proposed hybrid image segmentation will be carried out on the MRI and CT-Scan images samples which have different resolutions and covering the most use cases possible as shown in Table 1.
Table 1: Test sample (Brain, Breast Images)
Properties Value
Resolution 256x256 Image Width 256 Pixels Image Height 256 Pixels
Bit Depth 24 Item Types Bmp files
Size 192 KB
[image:4.612.318.524.289.408.2]In figure 4, brain and breast images with tumor are shown.
Figure 4: MRI Image Samples
4.1 Performance Parameters
The sensitivity, specificity and accuracy represent the statistical measures of the performance. Sensitivity refers to the test's ability to correctly detect patients who do have the condition. Specificity relates to the test's ability to correctly detect patients without a condition. The sensitivity of the test is the proportion of people who test positive for the disease among those who have the disease. Specificity of a test is the proportion of healthy patients known not to have the disease, who will test negative for it. Mathematically, this can be expressed as:
Sensitivity or (TPR) = TP / (TP + FN) (2)
Specificity (SPC) = TN / (TN + FP) (3)
In general, Positive = identified and negative = rejected. Therefore:
True positive = correctly identified False positive = incorrectly identified True negative = correctly rejected Input Segmented
I
Threshold Algorithm
Find Biggest Contour
Morphological Operation
[image:4.612.88.299.400.609.2]3465 False negative = incorrectly rejected
To find accuracy of detection, this equation is used.
ACC = (TP + TN) / (TP + FP + FN + TN) (4)
Where, TP is the true positive and FN
represents false negative of the tumor samples. 4.1.1 Imperceptibility
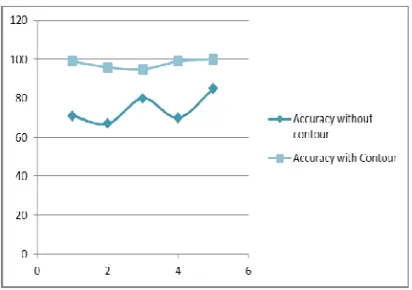
[image:5.612.96.299.325.444.2]The impact on the perceptual quality of the image segmentation was tested on the image test samples mentioned previously in both spatial and frequency domain. Figure 5 shows the accuracy of (5 set) test result without performing contour algorithm in the spatial domain, while figure 6 shows the accuracy of 5 set test result with contour algorithm.
Figure 5: Accuracy of detection for 5 set result
Figure 6: Accuracy of detection using contour
4.1.2 Average Time Calculation
The average time between two proposed
techniques is calculated in (MS) for both spatial and frequency domain. As mentioned in the above results, the accuracy of detection is almost close to each other when the biggest contour selection is applied. While the execution time for each algorithm is significantly varied. Figure 7 shows the average time in spatial and frequency domain. the average time is determined based on selecting 15 images in each set and finding the average time for K-mean clustering algorithm in the spatial domain while in the wavelet domain the average time of threshold algorithm is calculated for LL band.
Figure 7: Average time in both spatial and frequency domain
4.2 Results in Spatial Domain
Figure 8 illustrates the comparison of accuracy detection between the proposed method in spatial domain with and without applying contour algorithm for five set of 100 images.
Figure 8:Effect of Contour on Accuracy Detection – Spatial Domain
Figure 9 demonstrate that when the maximum contour algorithm is applied on the tumor detected image in the spatial domain, the accuracy detection is increased. The Sensitivity and Specificity are also changed according to the nature of the image sample.
4.3 Results in Frequency Domain
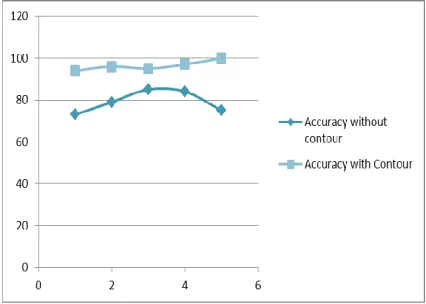
Figure 10 illustrates the comparison of accuracy detection between the proposed method in
0
20
40
60
80
100
set 1
set 2
set 3
set 4
set 5
acc
A
cc
u
ra
c
y
%
0 20 40 60 80 100
set 1 set 2 set 3 set 4 set 5
acc
A
ccu
ra
cy
%
[image:5.612.319.525.377.522.2] [image:5.612.97.300.480.589.2]3466 frequency domain with and without applying contour algorithm for five set of 100 images.
Figure 10:Effect of Contour on Accuracy Detection – Frequency Domain
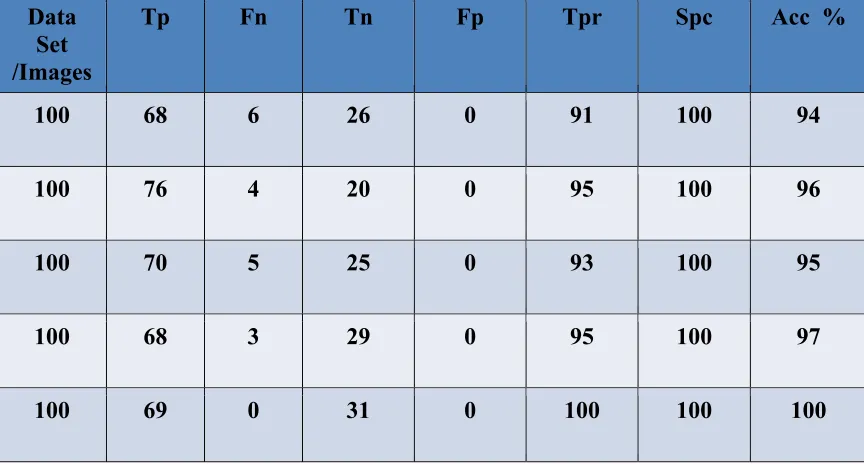
Figure 11 demonstrate that when the maximum contour algorithm is applied on the tumor detected image in the frequency domain, the accuracy detection is increased. The Sensitivity and Specificity are also changed according to the nature of the image sample (Table 1 and Table 2).
5. CONCLUSIONS
In this research, the hybrid medical image segmentation in both spatial and frequency domain are studied and some improvements are proposed to enhance its performance in term of tumor detection. The description of the image test samples with their specifications, which have different resolutions and covering the most use cases possible, is tested on MRI and CT-Scan images. According to the threshold value, the best image quality is shown in the case, if the threshold value varies between (120-160). According to the number of k-means cluster the best value is taken 5 to obtain an optimal result. Test results led to better accuracy and performance in both spatial and frequency domain when contour algorithm is performed. The sensitivity and specificity test result for image samples in both spatial and frequency domain has a good result when using the contour algorithm. In some cases the accuracy of detection attains 99.8%. The advantage of the proposed method is the increasing of detection rate of the tumor regions while the drawback is that the detection is not done automatically. The performance parameters (TP, TN, FP and FN) are manually determined according to the data set images.
For further performance improvement, other image quality (3D MRI and CT-Scan) can be used for testing. A hybrid k-means cluster and thresholding algorithm can be applied on (LH, HL and HH) bands for detecting exact tumor in the medical image.
Machine learning methods can also applied to classify whether the tumor is benign or malignant for diagnostic purposes.
REFRENCES:
[1] A. H. AlAsadi, “Hybrid k-means Clustering for Color Image Segmentation”, International Journal of Computer Science and Engineering,
Vol. 2, No. 4, 2016, pp. 17-26.
[2] S.S. Mankikar,"A Novel Hybrid Approach using K-Means Clustering and Threshold Filter for Brain Tumor Detection ", International Journal of Computer Trends and Technology,
Vol. 4, No. 3, 2013, pp. 206-209.
[3] E. Abdel-Maksoud , M. Elmogy , R. Al-Awadi," Brain Tumor Segmentation Based on A Hybrid Clustering Technique", Egyptian Informatics Journal Production and hosting by Elsevier, Vol. 16, No. 1, 2015, pp. 71-81.
[4] P. Sharma, J. Suji, “A Review on Image Segmentation with its Clustering Techniques”,
International Journal of Signal Processing, Image Processing and Pattern Recognition,
Vol. 9, No.5, 2016 pp. 209-218.
[5] Senthilkumaran N and Vaithegi S, "Image Segmentation by using Thresholding Techniques for Medical Images", Computer Science & Engineering: An International Journal, Vol. 6, No. 1, 2016, pp. 1-13.
[6] P.S. Shijin Kumar, "Hybrid Brain MRI Segmentation Algorithm Based on K-Means Clustering and Texture Pattern Matrix",
International Journal of Applied Engineering Research, Vol. 11, No. 6, 2016, pp. 4343-4348.
[7] N. Dhanachandra, Khumanthem and Y. J. Chanu," Image Segmentation using K-Means Clustering Algorithm and Subtractive Clustering Algorithm", Eleventh International Multi-Conference on Information Processing (IMCIP) by Elsevier, Vol. 54, 2015, pp.
764-771.
[8] S.S. Tamboli, V. R. Udupi," Image Compression using HAAR Wavelet Transform",
International Journal of Advanced Research in Computer and Communication Engineering
3467 [9] A.V.Kavitha, Madhulika.Y, S. Kumar .M,"
Comparison of Edge Detection Techniques for Brain MRI Image", International Journal of Computer Science and Information Technology & Security, Vol. 5, No. 3, 2015, pp. 279-284.
[10] B. Karthikeyan et al, “Analysis of Image Segmentation for Radiographic Images”, Indian journal of Science and Technology, Vol. 5, No.
11, 2012, pp. 3660-3664.
[11] N. Mahmood et al, “Image Segmentation Methods and Edge Detection: An Application to Knee Joint Articular Cartilage Edge Detection”,
Journal of Theoretical and Applied Information Technology, Vol. 71, No. 1, 2015, pp. 87-96.
[12] A. Pratondo et al, “Robust Edge-Stop Functions for Edge-Based Active Contour Models in Medical Image Segmentation”, IEEE SIGNAL PROCESSING LETTERS, Vol. 23, No. 2, 2106,
pp. 222-226.
[13] A. Hoogi, “Adaptive Local Window for Level Set Segmentation of CT and MRI Liver Lesions”, Medical Image Analysis,
ScienceDirect, Accepted 2017.
[14] M. Mustra, “Review of Recent Advances in Segmentation of the Breast Boundary and the Pectoral Muscle in Mammograms”.
International Federation for Medical and Biological Engineering, Springer, 2017.
[15] A. Mostaar, “A Novel Active Contour Model for MRI Brain Segmentation used in Radiotherapy Treatment Planning”, Electronic Physician Journal, Vol. 8, No. 5, 2016, pp. 2443-2451.
3468
Figure 2: Threshold Algorithm On LL Wavelet Band
[image:8.612.117.497.372.626.2]3469
3470
Table 2: Test Result (Without Contour Algorithm)
Table 3: Test Result (With Contour Algorithm)