2114
IMPLEMENTATION OF AUTOREGRESSIVE INTREGATED
MOVING AVERAGE (ARIMA) METHODS FOR
FORECASTING
MANY APPLICANTS MAKING DRIVER’S
LICENSE A WITH EVIEWS 7 IN PATI INDONESIA
1WARDONO, 2SCOLASTIKA MARIANI, 3YULIYANA FATHONAH
1
Doctor, Department of Mathematics, Universitas Negeri Semarang, Indonesia
2
Doctor, Department of Mathematics, Universitas Negeri Semarang, Indonesia
3
Student, Department of Mathematics, Universitas Negeri Semarang, Indonesia E-mail: [email protected], 2 [email protected],
3
ABSTRACT
Driver’s License A or Surat Ijin Mengemudi A (SIM A) is the evidence given by the police to a person who has fulfilled all requirement of driving a motor vehicle. Data SIM A services than at past time can be used to predict the data in the future. One of them using Autoregressive Integrated Moving Average (ARIMA) methods with Eviews 7. The purpose of this research is to find the best model of ARIMA and using the best model to predict the average public services in the field of SIM A in Pati Regency, Indonesia for the coming period. The data used in the form of monthly data from January 2010 until December 2015. The steps in the search for the best model of ARIMA that are : stasionary test of the data using a data plot, a correlogram, and a unit root test; make the data become stationary by differencing and transformation logarithms; estimate the model when the data is already stationary; doing the diagnostic checking with a residual normality test, a autocorrelation test, and a heteroskedastic test; as well as selecting and determining the best model. The step resulted in the best model that is ARIMA (0,2,2) with a logarithmic transformation which has the value SSR = 0.937246, AIC = 0.002447, and R2 = 0.755068.
Keywords: Driver’s License A, Forecasting, ARIMA, Eviews 7
1. INTRODUCTION
[18]
In the era of globalization with the conditions of competition and challenging government agencies demanded to provide the best service to the public and oriented to the needs of the public.
[16]
Service present should be oriented to the needs and satisfaction of the public so that aspect can not be ignored.
[31]
According to the Laws No. 2 of 2002 on the Indonesian National Police (Polri), in Article 2 explained that: "The function of the police is one of the functions of state government in maintaining security and public order, law enforcement, protection, shelter and services to the public.” Patterns and behavior within the police service can be analyzed from the performance of the police service in the provision of important papers needed by the public, among others, Vehicle Registration Number License (STNK), Driver’s License (SIM),
and public services. SIM is made or published as police attempt to regulate traffic on the highway.
[21]
Driver’s license is a certificate that is valid, stating that the person whose name and address listed in the description that meets the general requirements, spiritual and physical health, and no disability, understand traffic rules and deemed competent driving a particular vehicle.
[27]
The majority of road accident victims (injuries and fatalities) in developing countries are the vulnerable road users, pedestrians, cyclists, motorcyclists and non-motorised vehicles. [24]The fraction of crashes that result in deaths is much higher in low- and middle-income countries, and the population groups with the lowest incomes are particularly vulnerable.
ISSN: 1992-8645 www.jatit.org E-ISSN: 1817-3195
2115 important factor is the traffic conditions, where the traffic condition is an accumulation of the interaction of the various characteristics of the driver, vehicle, road infrastructure, and environmental characteristics.
According to the Article 211 (2) Government Regulation 44/93, SIM classified into six, namely:
SIM A, Special SIM A, SIM B1, SIM B2, SIM C and
SIM D. And that contribute significantly to traffic
accident fatalities was the rider of the vehicle with
SIM A and SIM C. [1]Although the number of
accidents is not as much as on a four-wheeled motorcycle accident but the severity of traffic accidents is higher than the four-wheel motorcycle accident.
Driver’s license absolutely needed for someone who barely a few hours a day drive using the motorcycle / car, not only to prevent operations or raids sometimes carried out by the police but driver’s license is also helpful when we experienced an event that we do not want such as an accident or may be involved in an accident albeit inadvertently. In fact, do not doubt that there are also people who are qualified but do not have a license but is free to use a motor vehicle on the highway. This is caused by the slow pace of the apparatus and service mechanism convoluted, so sometimes people often feel lazy to queue up and administrative complexity of making the driving license. Moreover, the driver’s license is based on the domicile of birth, making people lazy to process. The existence of brokers with different price also makes people reluctant to take care of, even though his license inanimate as well as the lack of socialization and inform the public about the procedures and costs when obtaining driver's license.
Driver’s license A ownership is very important for motorists, while taking care services takes possession of a driver's license, infrastructure and energy enough waiters. Driver’s license A ownership that services effectively requires accurate data from driver’s license A prospective applicant at any particular time period in the future. Data on the number of applicant making driver’s license A accurate to be acquired quickly and appropriately when has made forecasting, and forecasting a good one with the method intregated Autoregressive Moving Average (ARIMA) using Eviews 7 this. So here is clearly important to forecast the number of citizens who need the service of making a driver's license in the future in order to know the level of public awareness of the importance of a driver's license in the future. In addition, to assess the Pati Indonesian police
success in providing services to the public because it can plan strategies so that people no longer lazy to take care of driver's license A.
1.1 Pati Regency, Indonesia.
Pati Regency is one of 35 districts/cities in Central Java, Indonesia, it bordered with Kudus and Jepara Regency in the western part, the Java Sea in the north, Rembang in the east, and Grobogan and Blora Regency in the south. Location of astronomy between 110 and 111 east longitude and 6 and 7.00 south latitude. [2] The total area of 150 368 ha Pati Regency is composed of 58 448 ha of wetland and 91 920 ha of land instead of the fields.
1.2 Central Bureau of Statistics (BPS)
According to the laws No. 16 of 1997, the role of
BPS is as follows:
1.Providing the data needs for governments and publics.
2.Assist the statistical activities in the departments, government agencies and other institutions, in developing the national statistical system.
3.Develop and promote a standard statistical techniques and methods, and provide services in the field of education and training statistics. 4.Establish cooperation with international
institutions and other countries to the benefit of Indonesia's statistical development. [34], [35], [36], [37].
1.3 Driver’s License (SIM)
Driver’s License (SIM) is the registration and identification evidence given by police to person who has fulfilled the administrative requirements, physical and spiritual health, understand the traffic rules and skilled driving a motor vehicle.
1.3.1 The Use of The Driver’s License
Groups
According to the Article 211 (2) Governement Regulation 44/93, the use of the driver’s license groups are as follows:
1.SIM A : driver’s license for four-wheel motor
vehicles with a weight that is allowed no more than 3,500 Kg.
2116
3.SIM B1 : driver’s license for motor vehicles
with a permissible weight of more than 1,000 Kg.
4.SIM B2 : driver’s license for motorists who
use the train patch with permissible weight of more than 1,000 Kg.
5.SIM C : driver’s license for two-wheel motor
vehicles are designed with a speed of over 40 km / hour.
6.SIM D : Special diver’s license for drivers
with disabilities / special needs.
1.3.2 Requirements of Driver’s License Applicant
According to the Article 217 (1) Governement Regulation 44/93, the requirements of driving lisence applicant that are : a request in writing, can reading and writing, have knowledge of the road traffic rules and basic technique of a motor vehicle, the age limit (16 years for the SIM Group C, 17 years for SIM Group A, 20 Years to SIM Group BI / BII), skilled driving a motor vehicle, physically and mentally healthy, pass the theory and practice exams. (www.polri.go.id)
1.4 Forecasting
[23]
Forecasts are based on data or observations on the variable of interest. This data is usually in the form of a time series. Forecasting appears because of the time lag between awareness events or future needs with the event themselves. [17]Basically there are two approaches to forecasting that the approach of qualitative and quantitative approaches. Qualitative methods can be divided into methods of exploratory and normative. Qualitative forecasting methods used when historical data is not available. Qualitative forecasting methods are subjective methods (intuitive). This method is based on qualitative information. Quantitative forecasting methods can be divided into the two types of regression methods (causal) and time series (time series). Causal forecasting methods include factors related to the variable being predicted. Instead forecasting time series is a quantitative method for the prediction based on past data of a variable that has been collected regularly. The past data with the right technique can be used as a reference for forecasting in the future.
[20]
The purpose of time series forecasting methods is to find patterns in historical data series extrapolates this pattern into the future. A causal model assumes that the predicted factor shows a
causal relationship with one or more independent variables.
Quantitative forecasting can be applied when there are three of the following conditions:
a.Available information about the past.
b.Such information can be quantified in the form of numerical data.
c.It can be assumed that some aspects of the pattern of the past will continue in the future.
[17]
An important step in selecting an appropriate time series method is to consider the types of data patterns. The pattern data can be divided into four types of data patterns, namely:
a.Horizontal Pattern (H)
[image:3.612.334.509.320.401.2]Occurs when data is fluctuating around an average constant (this data is stationary on the average value).
Figure 1. A Pattern Of Horizontal Data
b.Seasonal Pattern (S)
Occurs when the value of the data which are affected by seasonal factors (eg quarter of a given year, monthly or day-to-day on a particular week). [22] In practice, all periodic data business and economics has a seasonal pattern.
Figure 2. A Pattern Of Seasonal Data
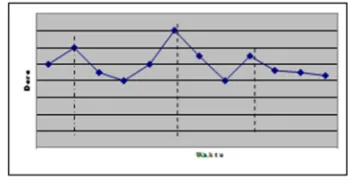
c.Cyclical Pattern (C)
[image:3.612.333.509.528.622.2]ISSN: 1992-8645 www.jatit.org E-ISSN: 1817-3195
[image:4.612.89.293.71.175.2]2117
Figure 3. A Pattern Of Cyclical Data
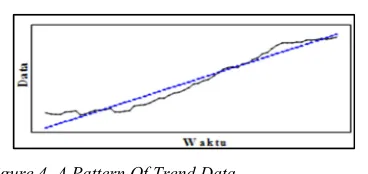
d.Trend Patterns (T)
Occurs when there is an increase or decrease in the long-term secular data.
Figure 4. A Pattern Of Trend Data
In order to understand the modeling of time series, note some types of data over time, which can be distinguished as follows:
• Cross-section of data, is the type of data collected for / on a number of individuals and / or category for a number of variables at any given point in time.
• Time series (time series) of data is the type of data collected in a timely manner within a certain time frame. [25] A sequence of observed data, usually ordered in time, is called a time series, although time may be replaced by other variables such as space. [19]As regards time series, the main ideas of generalized linear models, exponential families and monotone links, can be extended quite readily. [13] Time series can be written with
, , … , 1, 2, … with
as a random variable. [30] Here are some additional examples of time-series data:
The price of wheat every year for the past 50 years, adjusted for inflation.
Retail sales, recorded monthly for 20 years.
• Panel / Pooled of Data, is the type of data collected in chronological order in a given time period on a number of individual / category.
1.5 Autoregressive Integrated Moving
Average (ARIMA)
[9]
The calculation of the forecast function is easily generalized to deal with more complicated
ARIMA processes. [26]Forecasts from ARIMA models are said to be optimal forecasts. This means that no other univariate forecasts have a smaller mean-squared forecasts error. [29] ARIMA model was popularized in the landmark work by Box and Jenkins (1970). Therefore, the Autoregressive Integrated Moving Average (ARIMA) models which is usually known as the Box-Jenkins approach. [15] With the advent of the computer, it popularized the use of Autoregressive Integrated Moving Average (ARIMA) models and their extensions in many areas of science.
ARIMA models necessary to build a sufficient number of samples. Box and Jenkins suggested minimum sample size required is 50 observational data, especially for time series data seasonality required sample sizes larger. If the observational data available less than 50 it is necessary caution in interpreting the results. The first step to using the Box-Jenkins model is to determine whether the time series data used stationary or not and if there are significant seasonal shape happens to be modeled.
[14]
For ARIMA models, the forecasts can be expressed in several different ways. Each expression contributes to our understanding of the overall forecasting procedure with respect to computing, updating, assesing precision, or long-term forecasting behavior.
[17]
ARIMA models are divided into three elements, namely the model Autoregressive (AR), Moving Average (MA), and Integrated (I). These three elements can be modified so as to form a new model for example, the model Autoregressive Moving Average (ARMA). However, if it would be made in the form of generally being ARIMA (p, d, q). p stating the order AR, d and q Integrated declare the order stated order MA. If the AR model into the models generally be ARIMA (1,0,0). However, if it would be made in the form of generally being ARIMA (p, d, q).
[11]
In practice, to model possibly nonstasionary time series data, we may apply the following steps : 1.Look at the ACF to determine if the data are
stasionary
2.If not, process the data, probably by means of differencing
3.After differencing, fit an ARMA (p,q) model to the differenced data.
[12]
[image:4.612.107.291.249.336.2]2118 models may be tried until a satisfactory model is found.
1.6 Eviews
[28]
Eviews provides ease of doing econometric analysis, forecasting and simulation with a Graphical User Interface (GUI) that is user-friendly, Windows-based operating system. Predecessor Eviews is MicroTSP (Time Series Processor) which was first launched in 1981. The software vendor Eviews is Quantitative Micro Software, the latest version of Eviews (August 2011) is version 7. In terms of common interfaces, Eviews version 5, 6 and 7 not much different. The main difference is only in the completeness of statistical and econometric methods are implemented in each version of the software.
Some methods of forecasting the number of the applicant's driver's license A are single moving average methods, double moving average method, single exponential smoothing method, double exponential smoothing methods, triple exponential smoothing methods with SPSS [33]. In this research using other methods that are tailored to the characteristics of the data that is using Autoregressive Intregated Moving Average (ARIMA) method with Eviews 7.
1.7 Problem Formulation
On this research will be discussed two issues as follows :
1) How best model of ARIMA for forecasting an average many applicants making of a driver's license A in Pati Regency, Indonesia?
2) How is forecasting an average many applicants making of a driver's license A in Pati Regency, Indonesia from 2016 until 2017 by using ARIMA model ?
2. METHOD
In this research, the methods used in the implementation of ARIMA method to forecast the data driver’s license in Pati Regency, Indonesia with Eviews 7, are as follows :
1) Insert the data of the applicant's driver's license A Pati Regency, Indonesia into Eviews 7
2) Test data stationary using a data plot, correlogram, and a unit root test. Data is stationary if the absolute value of the ADF Test Statistic > absolute value of t statistic with the critical value at α = 5%. If the data is not stationary made stationary as in step 3)
3) Made data stationary by doing differencing and logarithm transformation
4) Estimate the model when the data is stationary 5) Perform diagnostic examinations with residual normality, autocorrelation test, and test heteroskedastic. Model good if the data residual normal, do not contain residual correlations among the data, and do not contain residual heteroscedasticity in the data. The third requirement is met if the value of probability < 5% as well as on non autocorrelation test and test non heteroskedastic is no lag out of line Bartlet.
6) Select and determine the best model having obtained a diagnostic workup. The best model is obtained with the criteria of existing data has been stationary against the mean and variance, SSR and AIC values were minimal, R2 maximum value, and the probability value of < 5%.
7) Furthermore, using the best ARIMA models to predict data the number of applicants making driver's license A in Pati Indonesia in the next two years
3. RESULTS AND DISCUSSION
3.1RESULTS
3.1.1 Data
The data obtained from BPS Pati Regency is located at Pati-Kudus Highway Street km 3, 59163 Telp. 0295-381905 Fax : 0295-386056. Email : [email protected]. Homepage: http://patikab.bps. go.id. On July 25, 2016 until August 26, 2016.
The data used in this report is the data of SIM A
in Pati Regency from January 2010 until December 2015.
[3] 2010
[4] 2011
[5] 2012
[6] 2013
[7] 2014
ISSN: 1992-8645 www.jatit.org E-ISSN: 1817-3195
2119 Nov 631 665 814 887 910 1072 Dec 577 685 784 1049 1319 1048
3.1.2Input Data in Eviews 7
a.Open a new workfile by clicking File and then New, select workfile
b.In the following dialog box, select the frequency Monthly and fill in start date jan-2010 and end date dec-2015. Click OK. c.Click File and then Import, then Import from
file. Select the folder containing the file to import, and then select the file to import and click Open (Excel file to be imported to Eviews must be closed). After clicking Open selection, click Next.
d.Change Series01 to the SIM, click Next e.Fill in the Start date jan-2010, click Finish f.Retrieved the output SIM series.
3.1.3 Stationary Test
To view the data stationary, there are three ways, as follows:
a.Using a Data Plot b.Using a Correlogram c.Using a Unit Root Test
The steps are as follows: a.Click view on the SIM series,
b.Then select and graph to plot the data, click correlogram for using correlogram (it will come out to see Correlogram Specification, select a level, fill lags to include in accordance with the amount of data that is 72) and the unit root test for the unit root test,
c.Click OK.
Figure 5. A Unit Root Test Of SIM Series
H0: The data contains a unit root
H1: The data does not contains a unit root
From these results, the absolute value of ADF Test Statistic is 1.837861 < the absolute value of t statistic with the critical value at α = 5% is 2.904198. This means that H0 is accepted, it indicates that the data contains the roots of the unit so that the data is not stationary.
3.1.4 Making The Data Stationary
[image:6.612.320.524.254.373.2]Therefore the data is not stationary, then the next step should be done is making a data to be stationar. According to the test results obtained then do differencing and logarithm transformation on the data. In this paper been the transformation of the logarithm. Although the data has been stationary after differencing first time, do diffenrencing again to determine the best model. To see if the data was stationary after differencing 2 times and transformed the way in which the same as seeing stationary in the original data. Here are the results output by looking at the unit root test.
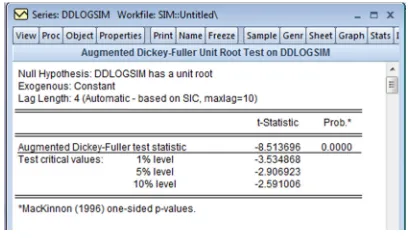
Figure 6. A Unit Root Test Of DDLOGSIM
From the results of the above output, the absolute value of ADF Test Statistic is 8.513696 > absolute value of t statistic with the critical value at α = 5% is 2.906923. This indicates that the data is stationary.
3.1.5 Estimation of Model
Once the data is stationary against the mean and variance for having done differencing and transformation logarithms 2 times, the next step is selecting the best model by doing overfitting. Examples of model estimation formula using Eviews7: d (log (sim)) ar (1) (For ARIMA (1,1,0)). There are 9 models are approaching the best model seen from the SSR and AIC minimum, maximum value and the value 2 probab < 5%. So that will be analyzed further by doing a diagnostic checking.
3.1.6 Diagnostic Checking
There are three tests in the diagnostic checking, namely a residual normality test, a non autocorrelation test, and a non heteroskedastic test.
[10]
In practice portmanteau tests are more useful for disqualifying unsatisfactory models. Here are the steps:
2120 b.Select Histogram-Normally Test for the
residual normality test, select Correlogram-Q-statistics for the non autocorrelation test, and select Correlogram Squared Residuals for the non heteroskedastic test (appears the dialog box of Lag Specification and fill in ags to include that is 72),
[image:7.612.328.517.89.295.2]c.Click OK
Figure 7. A Residual Normality Test Of ARIMA (1,1,0) With A Translog
[image:7.612.104.291.148.351.2]Visible the output value of probability 0.178962 > 0.05 = 5%, the data showed normal distribution.
Figure 8. A Non Autocorrelation Test Of ARIMA (1,1,0) With A Translog
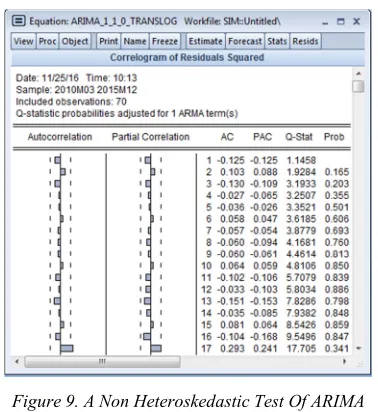
Figure 9. A Non Heteroskedastic Test Of ARIMA (1,1,0) With A Translog
Based on output above, it appears that the probability value is more than the value of alpha is 0.05 (5%) that are significant. Nor is there a marked Lag is still out of the line of Bartlett, which means that the data is not there is heterokedastic symptoms of the residual data.
The same was done to the 8 models of approaching the best model, namely, ARIMA (0,1,1) with a TRANSLOG, ARIMA (2,1,0) with a TRANSLOG, ARIMA (1,2,0) with a TRANSLOG, ARIMA (0,2,1) with a TRANSLOG, ARIMA (1,2,1) with a TRANSLOG, ARIMA (2,2,1) with a TRANSLOG, ARIMA (2,2,0) with a TRANSLOG, and ARIMA (0,2, 2) with a TRANSLOG.
3.1.7 Results of Diagnostic Checking
After doing the diagnostic checking to the 9 models of approaching the best model, the results are as follows:
Model
I
II
III
ARIMA(1,1,0)
with a Translog
V
X
X
ARIMA(0,1,1)
with a Translog
X
V
V
ARIMA(2,1,0)
with a Translog
X
V
V
ARIMA(1,2,0)
with a Translog
V
X
V
[image:7.612.107.292.412.599.2]ISSN: 1992-8645 www.jatit.org E-ISSN: 1817-3195
2121
with a Translog
ARIMA(1,2,1)
with a Translog
V
X
V
ARIMA(2,2,1)
with a Translog
X
X
V
ARIMA(2,2,0)
with a Translog
V
X
V
ARIMA(0,2,2)
with a Translog
X
V
V
where,
I : Residual Normality Test II : Non Autocorrelation Test III : Non Heterokedastic Test
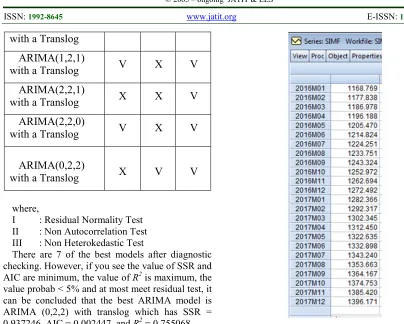
There are 7 of the best models after diagnostic checking. However, if you see the value of SSR and AIC are minimum, the value of R2 is maximum, the value probab < 5% and at most meet residual test, it can be concluded that the best ARIMA model is ARIMA (0,2,2) with translog which has SSR = 0.937246, AIC = 0.002447, and R2 = 0.755068.
3.1.8 Forecasting of The Best Model for The Next Two Years
In the estimation of the future of public services in the field of SIM, the authors using a dynamic forecasting, by predicting future periods are more, so the autors prefer to predict the next two years until December 2017.
Steps forecast as follows :
a.On the workfile, doubleclick range and change the end date 2015M12 becomes 2017M12 then OK
b.Click Quick, in the equation estimation type best model ARIMA (0,2,2) with a translog that is d (d (log (sim))) MA (1) MA (2)
c.Click OK
d.Click forecast, on the forecast series select SIM e.In the method, select Dynamic forecast f.On the simf, fill in Forecast name g.Click OK
[image:8.612.87.491.62.386.2]Double-click on the workfile simf so that it appears as follows forecasting results.
Figure 10. Results Of Forecasting Services SIM A For The Next Two Years
3.2 DISCUSSION
3.2.1 The best model of ARIMA for forecasting
an average Services SIM A in Pati Regency
According to the data from public services in the field of policing SIM A in Pati Regency from January 2010 to December 2015 may be said that the data tends to increase. The data is processed to find the best model of ARIMA with the first step is to enter the data into Eviews 7 with the name is SIM. After that, test data is stationary or not using a data plot, a correlogram, and a unit root test indicates that the data has not been stationary. It can be seen from the ADF Test Statistic absolute value is less than the absolute value of the t statistic with the critical value at α = 5% in the unit root test. Therefore, the data need to make stasionary with differencing and transformation logarithms twice, though as many as one single time already produce data that are stationary but it never hurts to get the best model.
The data that has been stationary the mean and variance, then the best model would have to see the value of SSR and AIC are minimum, the value of
2122 there are three stages of testing, that is normality residual test, non autocorrelation test, and non heteroskedastic test. A good model residual data is normal, do not contain residual correlations among the data, and do not contain residual heteroscedasticity in the data. The third requirement is met if a probability value is < 5% as well as on non autocorrelation test and non heteroskedastic test is no lag out of line Bartlet. The best model produced is ARIMA (0,2,2) with translog which has a value of SSR = 0.937246, AIC = 0.002447, and R2 = 0.755068.
3.2.2 Forecasting of The Best Model for The
Next Two Years
Methode dynamic forecast period can be used to predict the future more and forecast static method for forecasting future periods. Therefore, the authors use the method of dynamic forecast to forecast service data SIM A Pati Regency for the next two years because when using the method of forecasting dynamic, forecasting results obtained starting from the month of January 2016 to December 2017, but when using forecasting methods static, data generated only in January 2016 alone. Data forecasting results tend to increase every month. It can be seen from the data in January 2016, the number of services SIM A Pati Regency as many as 1168 people, while in December 2017 as many as 1396 people.
4. CONCLUSION AND SUGGESTION
4.1 Conclusion
Based on the analysis of time series data using Autoregressive Integrated Moving Average (ARIMA) models for forecasting the average public service in the field of driving license A in Pati Regency, it can be concluded as follows:
1.The best model based on testing that has been done is an ARIMA (0,2,2) with the logarithmic transformation which has the value SSR = 0.937246, AIC = 0.002447, and 2 = 0.755068.
2.Forecasting an average public service in the field of driver’s license A from January 2016 until December 2017 in Pati Regency, Indonesia shown in the following table.
Month-Year Forecasting Jan-2016 1168,769 Feb-2016 1177,838 Mar-2016 1186,978 Apr-2016 1196,188 May-2016 1205,470 Jun-2016 1214,824 Jul-2016 1224,251 Aug-2016 1233,751 Sep-2016 1243,324 Oct-2016 1252,972 Nov-2016 1262,694 Dec-2016 1272,492 Jan-2017 1282,366 Feb-2017 1292,317 Mar-2017 1302,345 Apr-2017 1312,450 May-2017 1322,635 June-2017 1332,898 July-2017 1343,240 Aug-2017 1353,663 Sept-2017 1364,167 Oct-2017 1374,753 Nov-2017 1385,420 Dec-2017 1396,171
4.2 Suggestion
Based on the research results and conclusions obtained, given some suggestions as follows;
1.Preferably, there should be more research on what methods can be used to predict public service SIM A in Pati Regency and petrified forecasting software, in order to obtain more accurate forecasting results and calculations easier.
2. With the forecasting results obtained, the forecasting results can be used by BPS Pati, Indonesia and police to plan strategies for the level of public awareness in taking care of driver’s license particularly in Pati Regency, Indonesia for two years.
ISSN: 1992-8645 www.jatit.org E-ISSN: 1817-3195
2123 Autoregressive Conditional Heteroscedasticity (GARCH etc., which adapts to the characteristics of the data there is.
REFERENCES
[1] Ambarwati, Lasmini et al. Karakteristik dan Peluang Kecelakaan pada Mobil Pribadi di Wilayah Perkotaan. Jurnal Rekayasa Sipil, 4(2) : 1978-5658. Malang : Brawijaya University of Malang. 2010.
[2] Anonymous. Pati dalam Angka 2006. Pati : BPS Pati Regency. 2006
[3] Anonymous. Pati dalam Angka 2011. Pati : BPS Pati Regency. 2011.
[4] Anonymous. Pati dalam Angka 2012. Pati : BPS Pati Regency. 2012.
[5] Anonymous. Pati dalam Angka 2013. Pati : BPS Pati Regency. 2013.
[6] Anonymous. Pati dalam Angka 2014. Pati : BPS Pati Regency. 2014.
[7] Anonymous. Pati dalam Angka 2015. Pati : BPS Pati Regency. 2015.
[8] Anonymous. Pati dalam Angka 2016. Pati : BPS Pati Regency. 2016.
[9] Brockwell, Peter J. and Richard A.Davis. Introduction to Time Series and Forecasting. Second Edition. USA : Springer. 2001.
[10]Brockwell, Peter J. and Richard A.Davis. Time Series : Thoery and Methods. Second Edition. USA : Springer. 1991.
[11]Chan, Ngai Hang. Time Series : Applications to Finance. United States of America : A Wiley-Interscience Publication. 2002.
[12]Chatfield, Christopher. The Analysis of Time Series : An Introduction. Fourth Edition. London : Chapman & Hall. 1989.
[13]Cochrane, John H. Time Series for Macroeconomics and Finance. Chicago : University of Chicago. 2005.
[14]Cryer, Jonathan D. and Kung-Sik Chan. Time Series Analysis With Applications in R Second Edition. USA : Springer. 2008.
[15]Gooijer, Jan G. De and Rob J. Hyndman. 25 Years of Time Series Forecasting. International Journal of Forecasting 22, 443-473. Australia : Monash University. 2006.
[16]Gusriani, Uci. Pelayanan Pengurusan Surat Izin Mengemudi (SIM) Di Kantor Kepolisian Resort Kota (Polresta) Samarinda. eJournal Administrasi Negara, 3(5):1553-1565. Available in ejournal.an. fisip.unmul.ac.id. [accessed 27-11-2016]. 2015.
[17]Hendikawati, P. Peramalan Data Runtun Waktu Metode dan Aplikasinya dengan Minitab dan
Eviews. Semarang : State University of Semarang. 2015.
[18]Hermansyah. Kualitas Pelayanan Surat Izin Mengemudi (SIM) pada Kantor Satlantas Polresta Samarinda. eJournal Administrasi Negara, 1(2) : 626-638. Available in ejournal.an. fisip-unmul.org. [accessed 27-11-2016]. 2013.
[19]Kedem, Benjamin and Konstantinous Fokianos. Regression Models for Time Series Analysis. United States of America : A Wiley - Interscience Publication. 2002.
[20]Makridakis, S. et al. Metode dan Aplikasi Peramalan. (Translated by Untung Sus Ardiyanto and Abdul Basith). Second Edition. Volume I. Jakarta : Erlangga Publisher. 1999. [21]Marsoedi,Soehoed. Pengetahuan Lalu Lintas.
Surabaya : Surabaya Press. 1994.
[22]Mason, Robert D. and Douglas A.Lind. Teknik Statistika untuk Bisnis & Ekonomi. (Translated by Widyono Soetjipto et al). Ninth Edition. Volume II. Jakarta : Erlangga Publisher. 1999. [23]Montgomery, Douglas C. et al. Introduction to
Time Series Analysis and Forecasting. New Jersey : John Wiley & Sons, Inc. 2007.
[24]Morris, Joseph R.. Improving Road Safety in Developing Countries. USA : National Research Council of the National Academies. 2006.
[25]Pandit, Sudhakar M. and Shien-Ming Wu. Time Series and System Analysis With Applications. United States of America : John Wiley & Sons, Inc. 1983.
[26]Pankratz, Alan. Forecasting With Univariate Box-Jenkins Models :Concepts and Cases. Canada : John Wiley & Sons, Inc. 1983. [27]Per, Lindskog and Ghazwan Al Haji. Road
Safety in Southeast Asia Factor Affecting Motorcycle Safety. Norrköping : Linköping University. 2005.
[28]Rosadi, D. Ekonometrika & Analisis Runtun Waktu Terapan dengan EViews. Yogyakarta : ANDI. 2011.
[29]Shumway, Robert H. and David S. Stoffer. Time Series Analysis and Its Applications With R Examples. Third Edition. USA : Springer. 2010.
[30]Siegel, Andrew F. Practical Business Statistics. Fourth Edition. USA : McGraw-Hill Higher Education. 2000.
2124 [32]Wicaksono,Dendy et al.. Analisis Kecelakaan
Lalu Lintas (Studi Kasus- Jalan Raya Ungaran-Bawen). Jurnal Karya Teknik Sipil, Universitas Diponegoro, 3(1):203-213. Online : http://ejournal-s1. undip.ac.id/index. php/jkts [accessed 27-11-2016]. 2014.
[33]Hendikawati, P. Metode Peramalan. Semarang: UNNES Press. 2011.
[34https://jateng.bps.go.id/ . [accessed 28-11-2016]. [35]https://patikab.bps.go.id/. [accessed 28-11-
2016].