http://dx.doi.org/10.4236/jpee.2014.24066
Probabilistic Analysis of Life Cycle Cost for
Power Transformer
Jianpeng Bian, Xiaoyun Sun, Mingming Wang, Haiqing Zheng, Hui Xing
School of Electronics and Information, Shijiazhuang Tiedao University, Shijiazhuang, China Email: [email protected]Received January 2014
Abstract
The selection of power transformer is very important to power sector. Most methods are utilized according to the initial cost and don’t consider the synthetical evaluation of economy and tech-nology. Based on previous research, this paper addresses a new practical probabilistic life cycle cost model. Then, in order to demonstrate the practicability of probabilistic life cycle cost for the power transformer, illustrative investment alternatives of actual power transformers are dis-cussed. From the result of the numerical investigation, it may be positively stated that the opti-mum investment alternative for the power transformer based on the probabilistic life cycle cost model proposed in this study will lead to a more rational, economical and effective procedure compared with the conventional method only considering the initial cost.
Keywords
Power Transformer; Probabilistic Analysis; Life Cycle Cost
1. Introduction
The distribution transformer is the most important single piece of electrical equipment installed in electrical dis-tribution networks with a large impact on the network’s overall cost, efficiency and reliability. Life cycle cost (LCC) is a technique to estimate the total cost of ownership (OGC, 2003). It is a structured approach which ad-dresses all the elements of this cost and can be used to produce a spend profile of the product over its anticipated life-span. The international standard was published in 1996. And in 2004, CIGRE proposed the equipment should be managed by life cycle cost. The international standard for life cycle costing, IEC 60300-3-3, has been published by International Electro technical Commission [1]. Most LCC models for power transformer assume deterministic behavior of its service life, including initial cost, operational cost, maintenance cost, fault cost and disposal cost. Reference [2] showed life cycle cost economic estimation for the measures on purchase of new power transformers and replacement of the existing ones for power system. Literature review shows that there are two main methods used in modeling life cycle cost: deterministic and probabilistic model [3]-[5]. Canova et al. (2003) showed an improvement of the standard LCC procedures to design electric lines constituted by cables also including the case of their parallel connections and the most convenient types of bus bars [4].
change of technology and economic, or complex, so the evaluation accuracy of life cycle cost will be immensely influenced and it is necessary to make uncertainty analysis.
Jiang et al. (2003) showed that the important nature of LCC estimation was uncertainty and cost elements were usually represented by statistical distributions [6]. The probabilistic cost analysis approach using Monte Carlo simulation for iterative process provided comprehensive and alternatives were presented [7].
Although references above consider life cycle cost with uncertainty as a stochastic model, the investment al-ternatives emphasize the economic and ignore the comprehensive evaluation of economy and technology. Moti-vated by gaps and difficulties mentioned above in particular and science research, it is an urgent need to develop a practical life cycle cost framework and the optimum investment alternative based on the comprehensive evalu-ation of economy and technology for power transformer.
2. Probabilistic Analysis of Life Cycle Cost
Probabilistic analysis involving parameterization of the probability of potential outcomes such that the uncer-tainty associated with the occurrence of an event is quantitatively evaluated in the decision framework and these decisions are based on maximizing expected utility. So the probabilistic decision analysis can be utilized to combine the life cycle cost.
All inputs with uncertainty can be considered by regarding the data in a life cycle cost analysis as an appro-priate probability distribution. Monte Carlo simulation can then be performed to get the true approximate proba-bility distributions of the output variables such as present value (PV).
The triangular distributions are selected as an option because both the minimum and maximum values that can be produced by the distribution are controllable, which is important when modeling inputs where it does not make sense to have any samples in the distribution. The width of the resulting distribution provides a measure of the sensitivity of the computed metric to the uncertainties in the data inputs [8]. The distribution functions of rand variable of triangular distribution:
( )( ) 0
(1 )( )( ) 1
m a
a m a b a r r
b a
x
m a
b r b m b a r
b a
−
+ − − ≤ ≤
−
= −
− − − − ≤ ≤
−
(1)
where r is the rand variable of homogeneous distribution. a is the minimum value. m is the most likely value. b is the maximum value. The rand variable of triangular distribution x can be got through by Equa-tion (1).
A life cycle costing model is a simplified representation of the real world, which extracts primary features from the real world and translates them into cost estimating relationships. Therefore the life cycle costing model should represent the characteristics of the system, including range and objective of use, maintenance mode and support scenarios, operation as well as any constrain and limitation.
This proposed model will construct general life cycle cost model, introducing the probabilistic distribution function. And the proposed model is base on the following formula:
LCC=CI+CO+CM+CF+CD (2)
where LCC represents the life cycle cost of power transformer, CI denotes the investment cost which includes purchase of power transformer and supports to operate the system properly; CO represents operational cost which mainly includes loss cost of power transformer. CM denotes maintenance cost; CF represents fault cost; CD denotes disposal cost.
(1) Investment cost
The initial investment cost contains all cost before the power transformer is utilized, mainly including pur-chase, mounting cost, test cost and so on.
E I
CI=CI +CI (3)
(2) Operation cost
The operation and maintenance cost mainly consist of the loss of power transformer.
0
( 2 ) 8760
k
CO= P +
β
P × ×η
×EL (4)where CO1 represents the loss cost of power transformer per year, P0 represents the equivalent no-load loss in kW. Pk refers to the equivalent load loss in kW, β refers to the load factor (i.e. the mean transformer loading over its time, that is, an equivalent percentage of its normal power), EL indicates the Purchasing cost of electricity in yuan/kWh, η is the loss rate of load per year,
2
max (1 ) ( max )
8760 8760
T T
K K
η= × + − × (5)
where K is the empirical coefficient, K=3 [9], Tmax represents the number of hours in maximum load per year.
(3) Maintenance cost
P M
CM =CO +CO (6)
where COP indicates the overhaul cost, COM represents the daily preventive maintenance cost. Due to the aging and fault of transformer, the maintenance cost per year is defined as linear increase model according to statistical data.
(4) Fault cost
According to the N−1 security principle of power system, when the power station loses any one incoming line or power transformer, it must be guaranteed that the next power station normally works. The direct fault of single power transformer causes the probability of losing load very tiny and the punishment cost can be ignored. So the fault cost mainly includes lose cost when power transformer is fault and restoration cost:
cos
N
CF= ×b S × ×β ϕ× +T RC× ×λ MTTR (7)
where b is the profits of unit of electricity (yuan/ kWh), SN indicates rating capacity of power transformer (kVA), β represents average load rate, cosϕ refers to average power factor, T represents interrupted time due to fault (h), RC represents average restoration cost per hour (ten thousand yuan/hour), λ represents av-erage failure number per year (n/year). MTTR denotes average restoration time (hour).
(5) Disposal cost
The disposal cost can be described as follows:
T R
CD=CD −CD (8)
where CD represents disposal cost, CDT refers to handling cost which mainly includes labor, transportation, environment protection cost and so on, CDR indicates residue value. Generally, the disposal cost can be got according to the proportion of purchase cost.
(6) Present value calculation
Due to expenses in an alternative plan occurring at different times, all future costs must be expressed in terms of their values at one given time in order to make the analysis credible. And the cost profile can be developed by running the cost model considering the effect of inflation, discount rate et al.
The amount that must be set aside at the present to cover an estimated future cost, considering both inflation and discount. The present value can be computed by utilizing the following equation:
(1 ) (1 ) n c last n PV first t t n
n t t
n k PV C d − − + = +
∑
(9)PV represents present LCC value of an alternative, Cn refers to cost for year n (in year tc RMB), nfirst represents the first year for which costs are to be accumulated, nlast represents the last year for which costs are to be accumulated, k represents inflation rate, d represents discount rate, tn represents the year n in which cost is to occur, tPV refers to the year for which PV is to be calculated, tc refers to the year for which cost data are entered.
3. Process of Probabilistic Analysis
1) Input values of parameters and the number N of simulations to be performed.
2) Define the probabilistic distribution and values of LCC variables through Equation (1). In practice, the tri-angular distribution is both practice and well understood by the engineers and is most often utilized.
3) Construct the LCC estimation model of every step through Equations (2)-(9).
4) Perform Monte-Carlo simulation a selected number of times for the investment data.
5) From result obtained, the probabilistic life cycle cost and standard deviation R=expectaion / variance
can be got. And if the standard deviation meets the requirement (R≤0.1), the maximum probabilistic life cycle cost can be got.
4. Illustrative Example and Discussions
To demonstrate the process of probabilistic analysis of power transformer, the 500 kV substation be constructing will be the hinge of local power system and the primary electric power source of 220 kV power system as the numerical example. So it will play an important role in improving the ability of power support and guarantee the stable operation of power system. And this project need choose a 750 MVA main power transformer [9]:
Three-phase transformer 515/230 ± 2 × 2.5%/36 kV adjusting voltage in no load, the equivalent no-load loss P0 = 223.33 kW, the equivalent load loss Pk = 1183.33 kW, OFAF. Table 1 summarizes the main parameters and their bounds of triangular distribution for this study.
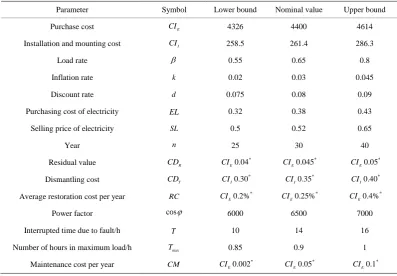
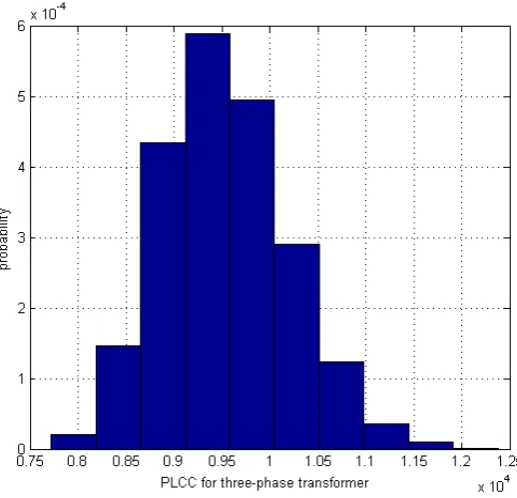
Figure 1 shows the PLCC for three-phase transformer, which is got through Mont-Carlo 1000 simulations. From the Figure 1, it can be seen that the maximum PLCC three-phase power transformer is 93.42 millon RMB and the standard deviation is 0.0703, which satisfies the requirement. Figure 2 shows the relationship among the discount rate, load factor and life cycle cost in three-phase transformer. From the Figure 2, it can be seen that the discount rate is negative correlation with life cycle cost and the load factor is positive correlation with life cycle cost. The relationship shows the discount rate and load factor has an important influence to PLCC.
5. Conclusions
[image:4.595.98.496.448.724.2]A preliminary assessment can be made through deterministic calculations, but due to the uncertainty of LCC parameters more detailed input can be used for, and far more information obtained from, a probabilistic ap-
Table 1.Model parameter of triangular distribution for PLCC/ ten thousand (RMB).
Parameter Symbol Lower bound Nominal value Upper bound
Purchase cost CIE 4326 4400 4614
Installation and mounting cost CII 258.5 261.4 286.3
Load rate β 0.55 0.65 0.8
Inflation rate k 0.02 0.03 0.045
Discount rate d 0.075 0.08 0.09
Purchasing cost of electricity EL 0.32 0.38 0.43
Selling price of electricity SL 0.5 0.52 0.65
Year n 25 30 40
Residual value CDR CIE0.04
*
E CI 0.045*
E CI 0.05*
Dismantling cost CDT CII0.30
*
I CI 0.35*
I CI 0.40*
Average restoration cost per year RC CIE0.2%
*
E CI 0.25%*
E CI 0.4%*
Power factor cosϕ 6000 6500 7000
Interrupted time due to fault/h T 10 14 16
Number of hours in maximum load/h Tmax 0.85 0.9 1
Maintenance cost per year CM CIE0.002
*
E CI 0.05*
Figure 1. The PLCC for three-phase transformer.
Figure 2. The relationship among the discount rate, load factor and life cycle cost in three-phase transformer.
proach. In the present program, the proposed method is based on Monte Carlo simulations. This would then be able to provide theoretical and practical support for decision of optimal investment alternatives.
The rationality and validity of Probabilistic analysis for LCC are demonstrated, and the quantitative evalua-tion of PLCC of power transformer is implemented.
At the same time, it shows that the evaluation approach is very clear and practical. However, there still are many critical issues need to be studied deeply, such as choice of vital indicator, improving method of synthetical evaluation and so on. So the next research will be focusing on these points.
Acknowledgements
[image:5.595.193.406.363.531.2]References
[1] International Electrotechnical Commission (2004) Life Cycle Costing. International Standard.
[2] Guseva, S., Breners, N., Skobeleva, N. and Vindbergs, H. (2009) Economic Criteria in Competition for Deliveries of Power Transformers. Latvian Journal of Physics and Technical Sciences, 35-42.
[3] Bhandari, S., Chakpitak, N. and Chandarasupsang, T. (2010) Decision Model for Life Cycle Assessment of Power Transformer during Load Violation. International Journal of Engineering Science and Technology, 2, 1147-1154. [4] Canova, A., Profumo, F. and Tartaglia, M. (2003) LCC Design Criteria in Electrical Plants Oriented to the Energy
Saving. IEEE Transactions on Industry Applications, 39, 53-58. http://dx.doi.org/10.1109/TIA.2002.807216
[5] Chattopadhyay, D. (2004) Life-Cycle Maintenance Management of Generating Units in a Competitive Environment.
IEEE Transactions on Power System, 1181-1189. http://dx.doi.org/10.1109/TPWRS.2003.821616
[6] Li, L., Huang, L., Ling, W., et al. (2010) Investment Decision-Making of Power Distribution Transformers Transfor- mation Based on Life Cycle Cost Theory. China International Conference on Electricity Distribution.
[7] Jiang, R., Zhang, W.J. and Ji, P. (2003) Required Characteristics of Statistical Distribution Models for Life Cycle Cost Estimation. International Journal Production Economics,185-194. http://dx.doi.org/10.1016/S0925-5273(02)00318-3 [8] Han, J.H. and Jang, G. (2009) Probabilistic Life Cycle Cost Analysis of Custom Power Devices for Voltage Sags and
Interruptions Mitigation. Transmission & Distribution Conference & Exposition: Asia and Pacific.