International Journal of Computer Applications (0975 – 8887) Volume 78 – No.12, September 2013
AdaBoost based EMD as a De-Noising Technique in
Time Delay Estimation Application
Kusma Kumari Cheepurupalli
Dept. of Electronics & Communication Engg, Andhra University, Visakhapatnam, A P, India.
Raja Rajeswari Konduri
Dept. of Electronics & Communication Engg, Andhra University, Visakhapatnam, A P, India.
ABSTRACT
Estimation of time delay between signals received at two spatially separated sensors has considerable practical importance in the applications like source localization, direction finding etc., in RADAR, SONAR and other communication systems. In this paper cross correlation (CC) generalized cross correlation with phase transform (GCC-PHAT) and maximum likelihood (ML) estimation methods are used as the time delay estimation methods. Prior to the delay estimation, the received signals are de-noised by AdaBoost based EMD technique. The performance of the delay estimation is significantly degraded by the signal-to-noise ratio (SNR) level and hence this factor has been considered as a principal factor. The simulation results of the proposed method are compared with the basic EMD as a de-noising technique at various SNR levels. The results show that the proposed method improves the resolution in the delay estimation in the noisy environment.
Keywords
EMD, Sifting process, Monotonic property, Adaptive Boosting, Cross-correlation, Generalized cross correlation, Maximum likelihood, time delay estimation.
1.
Introduction
Time delay estimation is considered as an important signal processing problem, which arises in various applications such as underwater acoustics [1], radar communications [2], wireless communication [3] etc. Classical delay estimation methods identifies the maximum value of the cross correlation between the reference and the delay signal. But in the presence of noise, the performance of the delay estimation methods may be degraded. Hence with the proper filtering of the signals an optimum delay estimate can be achieved. Various methods have been published in the literature to reduce the affect of noise. Among them Empirical Mode Decomposition [4] is considered as one of the best method for noise reduction application.
The motivation behind the use of EMD as a filtering technique is that it is completely adaptive and data driven method that operates on non-linear and non-stationary data which are generally encountered in the real environment. The main advantage of EMD is it does not depend on the filter orders as like linear and adaptive filters [5, 6] and also does not require any basic or prior function as in the case like Wavelets [7]. EMD also exhibits stable performance along with moderate speed and less complexity.
In our previous work [8] the noise reduction problem due to interference signals was addressed using EMD as a filtering technique in which the selection of Intrinsic Mode functions (IMFs) which are used for signal reconstruction was done
manually. In this paper, the Adaptive Boosting technique [9] is used to adaptively
select the IMF’s produced by EMD. The hybrid (ADA-EMD) use of these two methods provides improvement in the de-noising which is useful for the robust delay estimation.
Sections II provides a brief introduction to EMD and AdaBoost techniques. Section III presents the description of new structure of the AdaBoost based EMD filtering technique along with cross correlation (CC), generalized cross correlation with phase transform (GCC-PHAT) and maximum likelihood (ML) estimation methods as the time delay estimate methods by considering a simple sinusoidal signal as the source which is corrupted by white noise . The superior performance of the new algorithm is demonstrated using a set of simulation results. The results demonstrate the effectiveness of the presented system in delay estimates with ADA-EMD as a noise reduction technique.
2.
AdaBoost based Empirical Mode
3.
Decomposition (ADA-EMD)
A.
Empirical mode Decomposition
Nordon Huang et.al of NASA [5] has proposed Empirical Mode Decomposition (EMD) which is relatively unconventional method in signal processing. The decomposition method used in the EMD is called as “Sifting” process. The introduction of these instantaneous frequencies for complicated data sets, are used to eliminate the spurious harmonics that may present in nonlinear and non-stationary signals. The algorithm is described in the following steps:
The input signal applied to EMD is 1. Identify all extrema of input signal
2. Generate the upper envelope and the lower envelope of extrema and calculate the mean envelope as
(1)
3. Subtract from to generate the detail
(2)
4. Update using and then repeat the steps from 1 to 4 until satisfies stopping criterion. The resultant value is referred to as the first IMF as . In order to decompose into a series of IMF’s and above process is repeated as follows:
(3)
6. Treat the residual as the input signal and repeat the above sifting process to generate the next
and residual
7. Repeat the step 5 and 6 to generate a series of IMF’s and the last residual until the stopping criterion (i.e. must be monotonic) is satisfied. Finally, the input signal can be represented as the summation of the IMFs as shown in the following equation shown below:
(4)
where is the IMF order.
B.
Adapive Boosting
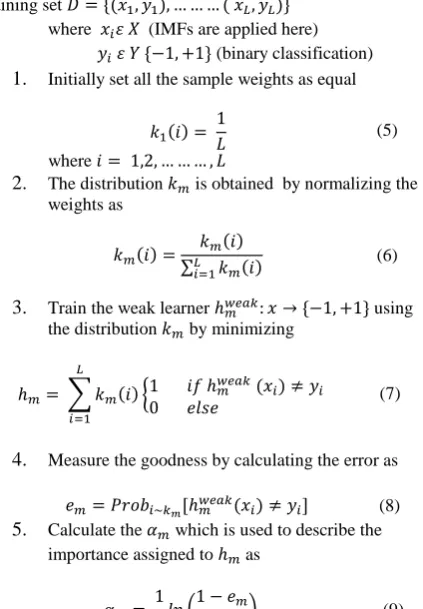
The AdaBoost algorithm was introduced in 1995 by Freund and Schapire [10]. AdaBoost is an efficient method which is used to increase the accuracy and robustness of the given learning algorithm. By giving a set of examples with initial weights, AdaBoost trains an initial weak learner with the given training dataset. It then focuses those training examples which are misclassified. Then, the second weak learner is trained with an updated training dataset which increases the weights of these misclassified examples. Finally, an ensemble is combined linearly by these trained weak learners with corresponding weights. The algorithm is described as follows: The input data required for the AdaBoost algorithm are: Training set
where (IMFs are applied here) (binary classification)
1. Initially set all the sample weights as equal
(5)
where
2. The distribution is obtained by normalizing the weights as
(6)
3. Train the weak learner using the distribution by minimizing
(7)
4. Measure the goodness by calculating the error as
(8)
5. Calculate the which is used to describe the importance assigned to as
(9)
6. If then AdaBoost operation is to be concluded or else if then update the distribution as
(10)
7. Then final output hypothesis which is treated as a strong hypothesis is obtained as
(11)
Here that represents the number of iterations to be carried out in the AdaBoost algorithm to achieve strong hypothesis.
4.
Time delay estimation
Let us consider this delay estimation problem as shown in Fig.1. The model consists of the signals received by two sensors.
(12)
The model contains and as the outputs of the sensors which are considered as differently delayed versions of the same signal , the two measurement noises and
[image:2.595.328.525.406.620.2]and represents the time delay between the two received signals.
Figure 1: Time delay associated between the two sensors.
The problem is to find an estimate delay of the true delay using finite set of samples of and . The signal
can also be treated as the reference signal.
i.
Cross correlation method
[image:2.595.66.278.433.738.2]argument that is related to the maximum peak in the output as the estimated delay. The CC method can be modeled as:
(13)
(14)
is the maximum peak in the output produced by the
CC method which represents estimated time delay.
ii.
GCC – PHAT method
In order to sharpen the cross correlation peak, certain weighting functions are assigned to the input signals. This process is called generalized cross correlation technique (GCC). The key role of the weighting function in GCC method is to ensure the large sharp peak obtained in the CC method thus provides high time delay resolution. Among the weighting functions like Smoothed Coherence Transform (SCOT), Roth processor, the Eckart filter, the Phase Transform (PHAT) is used due to its ability to avoid the spreading of the peak of the correlation function. [11]
This can be mathematically expressed as:
(15)
(16)
(17)
is the cross spectrum of the received signal, is the PHAT weighting function, is the maximum peak in the output produced by the GCC - PHAT method which represents estimated time delay.
iii.
Maximum likelihood method
Another important method in the GCC family is the maximum likelihood (ML) weighting function, which is used to improve the accuracy of the delay estimation. ML estimator is popularly used because of its simplicity in implementation and optimality under low SNR conditions. [12, 13]
The ML method is represented by:
(18)
(19)
(20)
where
is considered as the magnitude coherence squared, is the ML weighting function. is the maximum peak in the output produced by the ML method which represents estimated time delay. The ML method weights the cross spectral phase according to the estimated cross- spectral phase when variance of the estimated phase error is least.
5.
AdaBoost based EMD – proposed
de-noising method
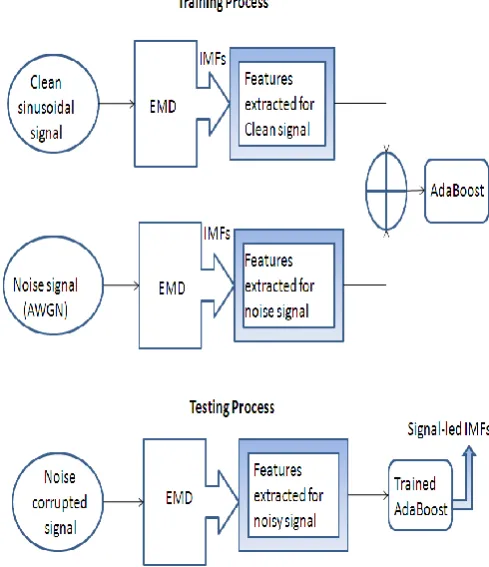
In this paper, a novel classification scheme for the IMFs using AdaBoost algorithm is shown in Fig. 2. The AdaBoost technique works out the operation in two stages i.e., in terms of training and testing process. From Fig.2 it can observed that the algorithm is first trained by using the feature extracts of the IMFs produced by EMD for the clean signal and noise individually. Once the algorithm is trained, then it is used in the testing process. The noise corrupted signal is applied to EMD and IMFs are obtained by decomposing the noisy signal. Then features are calculated for all the noisy IMFs and applied to the AdaBoost algorithm. Now the AdaBoost algorithm will distinguish the noise-led IMFs and signal-led IMFs and produces the ensemble of signal-led IMFs based on the feature extracts.
[image:3.595.318.563.343.627.2]In this paper for the feature extraction some of the features like mean, variance, skewness and kurtosis [14] both in frequency and time domain are calculated for all the noisy IMFs. Binary classification scheme is used to achieve accuracy in differentiating the signal and noise IMFs in the AdaBoost algorithm.
Figure 2: Process flow of EMD and AdaBoost for the selection of signal-led IMFs.
6.
Simulation Results
the adaptive selection of the IMFs by the AdaBoost technique. To achieve more accuracy the value of may be increased but at the cost of computational complexity. The signal and noises are assumed to be uncorrelated having zero mean and Gaussian distribution.
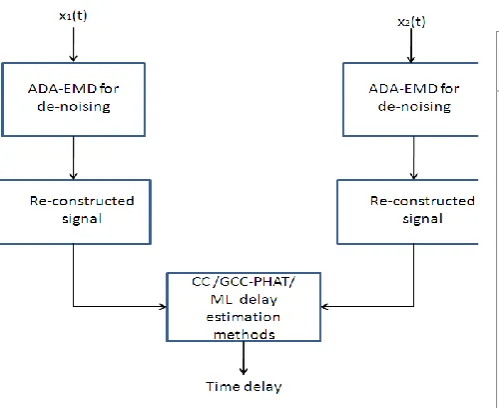
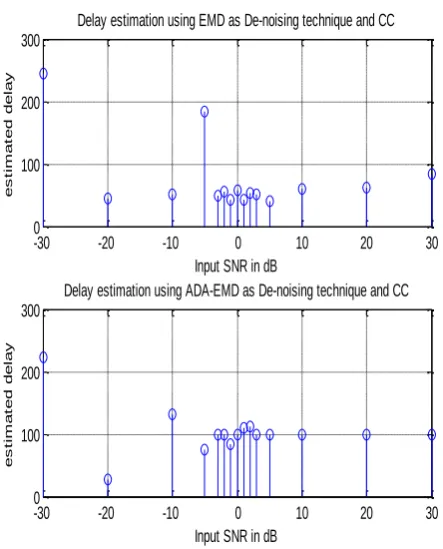
The process flow of the delay estimation using CC, GCC-PHAT and ML methods is shown in Fig.3, in which the signal reconstruction is done by AdaBoost based EMD as the de-noising technique. The reconstructed signal is then applied to the three methods for the delay estimation at various SNRs. Figure.4 describes the reconstruction of the delayed signal. The table 1 shown below represents the influence of the noise in the delay estimate. The plot shown in Fig.5 represents that the estimated time delay becomes incorrect when the SNR exceeds a certain threshold. It can be observed from the simulation results, that the delay estimate using ADA-EMD is providing improvement in accuracy in the time delay estimation, compared to the delay estimate using only EMD de-noising process.
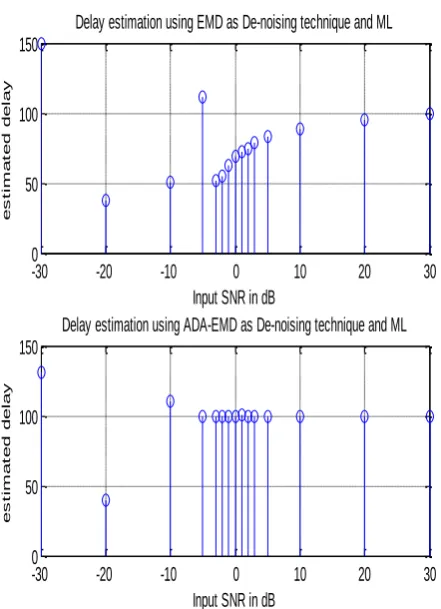
[image:4.595.324.563.86.323.2]At high SNRs we can achieve the true value using the ADA-EMD method. Even at low SNRs i.e. at -10dB the difference in the estimated delay is less compared to the EMD method. At the SNR levels -20dB and -30dB both the algorithms are providing incorrect values. If the number of features and the number of iterations in the AdaBoost process are increased then delay estimate may be improved even at very low SNRs but the complexity increases.
[image:4.595.289.551.376.675.2]Figure 3: Flow diagram of time delay estimation using the proposed method.
[image:4.595.57.556.381.650.2]Figure 4: Signal de-noising using the proposed method for the delayed signal.
TABLE I. THE IMPROVEMENT RESULTS FOR THE RANGE OF
SNR’S
True Delay
Estimated Delay using Cross Correlation Input SNR
(dB) EMD as de-noising
ADA-EMD as de-noising
100
-30 245 222
-20 44 28
-10 51 131
-5 184 76
-3 48 100
-2 55 100
-1 43 83
0 58 100
1 42 109
2 53 111
3 51 100
5 41 100
10 59 100
20 62 100
30 83 100
100 200 300 400 500 600 700 800 900 1000 -0.5
0 0.5
Number of Samples
A
m
p
li
tu
d
e
Clean Input
100 200 300 400 500 600 700 800 900 1000 -0.5
0 0.5
Number of Samples
A
m
p
li
tu
d
e
Noisy Input
100 200 300 400 500 600 700 800 900 1000 -0.5
0 0.5
Number of Samples
A
m
p
li
tu
d
e
[image:4.595.58.308.382.586.2]Figure 5: Relation between the range of SNRs and the estimated delay using CC method.
Table 2 and Table 3 represent the time delay estimates using GCC - PHAT and ML methods. Fig.6 and Fig.7 describes the plots of delay estimation. From the figures it can be observed that there is an improvement in delay.
TABLE II. THE IMPROVEMENT RESULTS FOR THE RANGE OF
SNR’S
True Delay
Estimated Delay using GCC-PHAT Input SNR
(dB) EMD as de-noising
ADA-EMD as de-noising
100
-30 195 145
-20 40 35
-10 63 82
-5 123 98
-3 50 100
-2 52 100
-1 46 83
0 60 100
1 65 103
2 68 101
3 73 100
5 82 100
10 85 100
20 92 100
30 99 100
Figure 6: Relation between the range of SNRs and the estimated delay using GCC-PHAT method.
TABLE III. THE IMPROVEMENT RESULTS FOR THE RANGE OF
SNR’S
True Delay
Estimated Delay using Maximum likelihood Input SNR
(dB) EMD as de-noising
ADA-EMD as de-noising
100
-30 150 131
-20 38 40
-10 51 110
-5 111 100
-3 52 100
-2 55 100
-1 63 100
0 69 100
1 72 101
2 75 100
3 79 100
5 83 100
10 89 100
20 95 100
30 100 100
-30 -20 -10 0 10 20 30
0 100 200 300
Input SNR in dB
e
s
t
im
a
t
e
d
d
e
la
y
Delay estimation using EMD as De-noising technique and CC
-30 -20 -10 0 10 20 30
0 100 200 300
Input SNR in dB
e
s
t
im
a
t
e
d
d
e
la
y
Delay estimation using ADA-EMD as De-noising technique and CC
-30 -20 -10 0 10 20 30
0 50 100 150 200
Input SNR in dB
e
s
t
im
a
t
e
d
d
e
la
y
Delay estimation using EMD as De-noising technique and GCC-PHAT
-30 -20 -10 0 10 20 30
0 50 100 150
Input SNR in dB
e
s
t
im
a
t
e
d
d
e
la
y
[image:5.595.326.546.100.393.2]Figure 7: Relation between the range of SNRs and the estimated delay using ML method.
7.
Coclusion
This paper proposes a robust time delay estimation using cross correlation method in which the combination of EMD and AdaBoost methods are used for de-noising. EMD algorithm is shown to be highly effective in reducing noise in non-stationary environments like RADAR/SONAR communications. AdaBoost guarantees an exponential decrease of error with the increase of number of hypothesis. Both theoretical and simulation results demonstrate that AdaBoost has an excellent generalization performance as robust learner. AdaBoost based EMD technique in combination with parameter estimation methods (like MUSIC, ESPRIT) can be used to improve the performance of the Direction of Arrival (DOA) calculation for sound signals in SONAR application which is the future scope of this paper.
A
CKNOWLEDGMENTThis work is being supported under the project “Robust Signal Processing Techniques for RADAR/SONAR Communications using VLSI Tools by Ministry of Science & Technology, Department of Science & Technology, New Delhi, India, under Women Scientist Scheme (WOS –A).
R
EFERENCES[1] R. J. Urick, Principles of Underwater Sound. New York: McGrawHill, 1983.
[2] A. Quazi, “An overview on the time delay estimate in
active and passive systems for target localization,” IEEE Trans. Acoust., Speech, Signal Process., vol. 29, no. 3, pp. 527–533, 1981.
[3] G. L. Turin, “Introduction to spread-spectrum antimultipath techniques and their application to urban digital radio,”Proc. IEEE, vol. 68, no. 3, pp. 328–353, Mar. 1980.
[4] N.E. Huang, Z. Shen, S.R. Long, M.L. Wu, H.H. Shih, Q. Zheng, N.C. Yen, C.C. Tung and H.H. Liu, “The empirical mode decomposition and Hilbert spectrum for nonlinear and non-stationary time series analysis,” Proc. Roy. Soc London A, Vol. 454, pp. 903–995, 1998.
[5] Ying He, Hong He, Li Li, Yi Wu, Hongyan Pan, “The Applications and Simulation of Adaptive Filter in Noise Cancelling”, International Conference on Computer Science and Software Engineering, 2008. [6] V.UdayShankar, “Modern Digital Signal Processing”
PHI, Second Edition, Apr 2012.
[7] D.L.Donoho, “De-noising by Soft thresholding,” IEEC Trans. Inform. Theory, vol.41,no.3, pp:613-627,1995.
[8] Kusma Kumari Cheepurupalli and Raja Rajeswari Konduri, “Enhancement of Performance Measures using EMD in Noise Reduction Application” International Journal of Computer Applications, vol 70, no.5, pp: 10-14, May 2013
[9] Y. Freund and R. Schapire. “A decision-theoretic generalization of on- line learning and an application to boosting”, Journal of Computer and System Sciences, 55(1):119–139, 1997.
[10] YushiZhang and WaleedH. Abdulla “A Comparative Study of Time- Delay Estimation Techniques Using Microphone Arrays,” School of Engineering Report No. 619, Department of Electrical and Computer Engineering, The University of Auckland, Private Bag 92019, Auckland, New Zealand, 2005
[11] H.Wang and P.Chu “Voice Source Localization for Automatic Camera Pointing System in Video conferenceing,” IEEE Acoustic, Speech and Signal Processing, vol.1 pp.187-190, 1997
[12] G. C. Carter “Coherence and time delay estimation: an applied tutorial for research, development, test, and evaluation engineers”, Piscataway, NJ: IEEE Press, 1993
[13] S. Bédard, B. Champagne and A. Stéphenne: “Effects Of Room Reverberation On Time-Delay Estimation Performance”, IEEE, Acoustics, Speech, and Signal Processing, vol.2, pp.261-264, April 1994
[14] Anurag Kumar, et.al., “ Speech Emotion Recognition by AdaBoost Algorithm and Feature Selection for Support Vector Machines” available in the following website:
http://home.iitk.ac.in/~subhali/reports/report_iptse.pdf
-30 -20 -10 0 10 20 30
0 50 100 150
Input SNR in dB
e
s
t
im
a
t
e
d
d
e
la
y
Delay estimation using EMD as De-noising technique and ML
-30 -20 -10 0 10 20 30
0 50 100 150
Input SNR in dB
e
s
t
im
a
t
e
d
d
e
la
y
AUTHORS PROFILES
[1]
Kusma Kumari Ch was born in 1982 at Visakhapatnam. She received her B.Tech (ECE) from JNTU Hyderabad and M.Tech (VLSI Design) from JNTU Kakinada. She has a teaching experience of 3 years. Presently she is pursuing her Ph.D in the area of Signal Processing in Andhra University, Visakhapatnam.
[2]
K. Raja Rajeswari obtained her B.E., M.E. and Ph.D. degrees from Andhra University, Visakhapatnam, India in 1976, 1978 and 1992 respectively. Presently she is professor in the Department of Electronics and Communication Engineering, Andhra University. She is Dean for Academics & Research, Andhra University College of Engineering. She has published over 150 papers in various National, International Journals and conferences. She is author of the textbook Signals and Systems published by PHI. She is