http://dx.doi.org/10.4236/sgre.2014.56013
Economic Evaluation Method of Photovoltaic
Power Generation Installed in Ordinary
Homes
Yasushi Iwasaki, Kayoko Yamamoto
Graduate School of Information Systems, University of Electro-Communications, Tokyo, Japan Email: [email protected], [email protected]
Received 15 April 2014; revised 16 May 2014; accepted 23 May 2014
Copyright © 2014 by authors and Scientific Research Publishing Inc.
This work is licensed under the Creative Commons Attribution International License (CC BY).
http://creativecommons.org/licenses/by/4.0/
Abstract
This study aims to develop an economic evaluation method for installing photovoltaic power gen-eration in ordinary homes using GIS (Geographic Information Systems). The conclusions can be summarized in the following three points: 1) This method determines the profit and loss and pay-back period in order to evaluate the installation of photovoltaic power generation, taking into ac-count the price of equipment, solar battery module conversion efficiency, subsidy, electricity pur-chase price, service life and rate for selling electricity. 2) The proposed evaluation method was applied to Kanagawa Prefecture in Japan, providing plural scenarios. Using a solar battery module conversion efficiency of more than 15%, it is possible to make the payback period shorter than the 20-year service life and anticipate a profit in almost the whole area. 3) The areas suitable for pho-tovoltaic power generation are Kawasaki City and Ninomiya-machi. It is necessary to adopt meas-ures to increase the subsidy and install photovoltaic power generating systems in specific places in areas where subsidies are not provided in enough amounts.
Keywords
Photovoltaic Power Generation, Economic Evaluation, Subsidy, Profit and Loss and Payback Period, GIS (Geographic Information Systems)
1. Introduction
eco-nomic support is provided for the installation of photovoltaic power generation. The “Residential photovoltaic power generation system installation support reconstruction project”, in which national government subsidies are provided when photovoltaic power generation systems are installed in ordinary households, and the “Feed-in Tariff Scheme for Renewable Energy” in which power companies purchase surplus generated power, have been in place since 2012. However, photovoltaic power generation is greatly influenced by the amount of solar radia-tion, and there is a problem in that the amount of electricity generated differs depending on the place of installa-tion. Further, the subsidy amount differs between local governments, and there are districts where the advantag-es of installing a photovoltaic power generation system cannot be gained. Therefore, this study aims to propose a method of evaluating the suitability of installing photovoltaic power generation systems, focusing on the profit and loss and the payback period.
To achieve these, this study focuses on ordinary household residences and uses Geographic Information Sys-tems (GIS) to estimate the amount of electricity generation that can be obtained by installing a photovoltaic power generation system. The estimate is based on the amount of solar radiation in the region subject to evalua-tion, and the area available for installation of a photovoltaic power generation system. The estimate of the amount of electricity generation, the cost of installing and maintaining a photovoltaic power generation system, subsidies and the electricity purchase price are then compared, and considered in order to evaluate the suitability of installing a photovoltaic power generation system. This evaluation method is applied to the entire area of Ka-nagawa Prefecture in Japan. As mentioned below, KaKa-nagawa Prefecture and cities, towns and villages in the prefecture have implemented unique subsidy schemes, and are tackling the installation of photovoltaic power generation systems in a positive manner.
In this study, first, Section 2 introduces the originality of this study comparing the related works. Section 3 describes the evaluation method of this study, and Section 4 shows the results of application of the evaluation method. Based on these, Section 5 proposes the policies for the promotion of the spread of photovoltaic power generation. Finally, Section 6 shows the conclusions and future works of this study.
2. Related Work
Research which uses GIS to estimate the amount of electricity generated by photovoltaic power generation sys-tems has been conducted from various viewpoints. Luca et al. (2011) [1] proposed a method of estimating the amount of electricity generation, and compared different power generation amounts that resulted from differ-ences in solar cell modules. In addition to solar energy, Furuichi et al. (2011) [2] obtained information regarding the amount of natural resources and the amount of energy reserves for biomass energy, temperature difference energy, and small and medium-scale hydraulic energy, and analyzed their availability. Further, Shinohara et al.
(2010) [3] considered the installation area ratio of solar energy collectors and power generators from the pers-pective of energy saving and CO2-reducing effects.
An example of a study in which an evaluation of economic efficiency relating to the installation of photovol-taic power generation systems was conducted using GIS is that of Sugihara et al. (2011) [4]. This study clarified differences in the amount of electricity generated by photovoltaic power generation systems which are caused by differences in the amount of subsidy money invested. Further, Tamura et al. (2010) [5] focused on surplus pow-er and analyzed economic efficiency for both the case of consumpow-ers who do install and the case of consumpow-ers who do not install photovoltaic power generation systems. The former study focused on the whole of Japan, and estimated power generation amount in broad regions. This study indicated that a detailed evaluation of economic efficiency which focuses on smaller units of spatial scale was a topic for further research. Further, neither of the studies grasped the extent of the profit that could be anticipated by users who introduced photovoltaic power generation systems. Nor did they consider the differences in profit and loss, payback period and so on that occur depending on where the photovoltaic power generation system is installed.
re-gional areas. Estimating the differences enables policies to be formulated for promoting the spread of photovol-taic power generation at the basic local government level.
3. Evaluation Method
[image:3.595.160.466.383.714.2]3.1. Evaluation Outline and Method
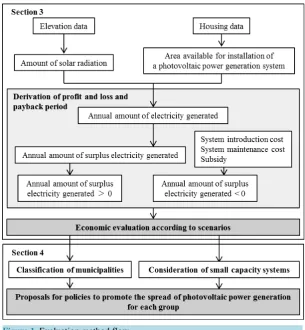
Figure 1shows the flow of the evaluation method of this study. In this study, according toFigure 1, Section 3 describes the evaluation method, and Section 4 shows the results of application of the evaluation method. The details of these sections are as follows. Firstly, in Section 3, economic evaluations of each scenario in the region for evaluation are conducted. In derivations of profit and loss and payback period for photovoltaic power gener-ation system installgener-ation, multiple scenarios are prepared, and profit and loss and payback period are estimated for each scenario. The conditions of scenarios where profit can be anticipated when a photovoltaic power gener-ation system is installed and the conditions of scenarios in which installing a photovoltaic power genergener-ation sys-tem results in loss occurring are clarified. Doing this enables the suitability of installing a photovoltaic power generation system to be evaluated.
In Section 4, based on the evaluation results in Section 3, in order to propose policies for promoting the spread of photovoltaic power generation, photovoltaic power generation system installation in different local government areas is compared and considered. Firstly, all local governments are classified, based on compari-sons of the profit and loss which result from photovoltaic power generation system installation and the payback period. A problem associated with installing a photovoltaic power generation system is the high initial cost. Taking this into account, the installation of small-capacity photovoltaic power generation systems (2 kW sys-tems which cost 1,000,000 yen or less are considered to be small-capacity syssys-tems) is considered. Based on the results of the comparisons and the consideration, policies for promoting the spread of photovoltaic power gener-ation that are suited to each group are proposed.
3.2. Method of Analysis
In this study, analysis was conducted according to the outline shown inFigure 1. Esri, Inc.’s Arc GIS ver. 10.1 was used as the GIS. The GIS was used in converting and processing all data into 500 m mesh units with the same format, organizing all analysis and evaluation results using similar units as well, and displaying the data on a digital map. Also, the GIS was used in further collecting and adding these results and grouping them by local government, and in estimating the annual amount of solar radiation.
3.2.1. Annual Amount of Solar Radiation
The amount of solar radiation is divided into three types: the amount of direct solar radiation, the amount of dif-fuse solar radiation, and the amount of reflected solar radiation. The Arc GIS tool for analyzing the amount of solar radiation was used to estimate the amount of direct solar radiation, the amount of diffuse solar radiation, and the amount of global solar radiation, which was the total amount of direct solar radiation and diffuse solar radiation. Estimation was performed taking into account the influence of the atmosphere, the latitude and eleva-tion of the locaeleva-tion, the angle of inclinaeleva-tion and the direceleva-tion of inclinaeleva-tion, the angle of the sun, and the influ-ence of shade resulting from the geographical features of the surroundings. A solar radiation amount map was then generated. However, concerning the amount of reflected solar radiation, with the exception of the surface of snow and the like, the amount of reflected solar radiation is minute; therefore, reflected solar radiation is not in-cluded in the calculation of the amount of global solar radiation performed by the tool for analyzing the amount of solar radiation. Further, elevation data was required in this analysis, so base map information (a digital eleva-tion model) from the Geospatial Informaeleva-tion Authority of Japan [6] was used. This digital map data was con-verted into raster data, the tool for analysis of the amount of solar radiation was used to output a map of solar radiation amounts for all regions evaluated, and the data was divided into 500 m mesh units.
3.2.2. Area Available for Installation of a Photovoltaic Power Generation System
In the derivation of the area available for installation of a photovoltaic power generation system on a single house (S), values from the “Housing and Land Survey (2003)” on e-stat (the Portal Site of Official Statistics of Japan) [7] for the average building area of a single house (Sh) in different local government areas were used. The
value for each local government area was used for all 500 m mesh units in the corresponding local government area in this study. The value was multiplied by roof shape efficiency (CR) and system installation efficiency (CS)
in order to derive the area available for installation of a photovoltaic power generation system (S). In this study, it was assumed that the roof would be a gabled roof, which is the form of roof most suited to the installation of a photovoltaic power generation system, and is found on many houses in Japan. It was considered that it would only be possible to use the southern half of the roof, so the roof shape efficiency (CR) was set as approximately
50% (Photovoltaic Power Generation/Photovoltaic Panel Comparison/Installation Guide) [8]. It is recommended that when installing a photovoltaic power generation system, the solar cell module be installed so as to avoid the edge of the eaves, the edge of the gabled roof, and the ridges of the roof. Therefore, these parts were taken into consideration in the system installation efficiency (CS), and it was assumed that installation was possible on
about 70% of the roof (The Panel for Improving the Quality of Construction of Residential Solar Power Genera-tion Systems of the Ministry of Economy, Trade and Industry’s Agency of Natural Resources and Energy, 2007) [9]. Further, the angle of the roof (θ) was set as 30˚, the angle at which the most amount of solar radiation can be expected in Japan (The Panel for Improving the Quality of Construction of Residential Solar Power Generation Systems of the Ministry of Economy, Trade and Industry’s Agency of Natural Resources and Energy, 2007) [9].
cos
S R h
S=C ×C ×S θ (1)
S: Area available for installation of a photovoltaic power generation system on a single house (m2)
CR: Roof shape efficiency (%) CS: System installation efficiency (%)
Sh: Average building area of a single house (m2) θ: Roof angle (˚)
3.2.3. Derivation of Annual Amount of Electricity Generated
amount of solar radiation (H) and the area available for the installation of a photovoltaic power generation sys-tem (S). In performing this derivation, the solar cell module conversion efficiency (CM) and loss coefficient (CT)
were taken into account. For the former, there are national government subsidy provision conditions and elec-tricity purchasing system conditions; however, in this study, investigation was made using three patterns of module conversion efficiency (silicon single crystal type—16%; silicon polycrystalline type—15%; and chemi-cal compound type—12%) which meet the national government subsidy provision conditions, which are stricter than the electricity purchasing system conditions. According to the Japan Photovoltaic Energy Association (2013) [10], the silicon polycrystalline-type solar cell module with a module conversion efficiency of 15% is the most widely used in Japan. Next, based on information from the New Energy and Industrial Technology Devel-opment Organization (2008) [11], the loss coefficient (CT) for loss caused by temperature rise and loss that
oc-curs when a power conditioner is used to convert direct-current power to alternating-current power which can be used in household products was considered. Taking into account loss caused by temperature rise (15%), loss caused by the power conditioner (8%), and loss caused by soiling of wiring, solar panel surfaces and so on (7%), the total for the loss coefficient (CT) was 73%.
M T
G=C ×C × ×H S (2)
G: Annual amount of electricity generated (Wh)
CM: Solar cell module conversion efficiency (%) CT: Loss coefficient
H: Annual amount of solar radiation (Wh/m2)
S: Area available for installation of a photovoltaic power generation system on a single house (m2)
3.2.4. Derivation of Profit and Loss and Payback Period
1) Annual amount of surplus electricity generated
In order to derive the profit and loss (P) that results from installation of a photovoltaic power generation sys-tem, firstly, the annual amount of surplus electricity generated (GS) was found. In the case where the amount of
electricity generated annually (G) exceeds the amount of electricity consumed annually (GC), during the time
outside the surplus electricity purchase period, the amount of electricity generated that exceeds the amount of electricity consumed annually is not utilized and does not lead to a profit. In order to take account of that amount of electricity, in Section 4, which concerns the derivation of profit, the calculation method is changed depending on the difference in the annual amount of surplus electricity generated (GS). The annual amount of surplus
elec-tricity generated (GS) is the difference between the annual amount of electricity generated (G) obtained by
in-stalling a photovoltaic power generation system and the annual amount of electricity consumed (GC) by an
ordi-nary household. Data from the “2010 National Census” on e-stat [7] concerning the number of households in each 500 m mesh unit, and data from “Electric Power Consumption by Prefecture (Electricity for Light)” in the “Japan Statistical Yearbook 2010” of the Statistics Bureau of the Ministry of Internal Affairs and Communica-tions of Japan [12] were used to calculate the annual amount of electricity consumed (GC). For each mesh unit,
electricity consumption was distributed proportionally based on the number of households to find the annual amount of electricity consumed (GC).
S C
G = −G G (3)
G: Annual amount of electricity generated (Wh)
GS: Annual amount of surplus electricity generated (Wh) GC: Annual amount of electricity consumed (Wh)
2) System price and cost of maintenance of system
The system price (PV) is derived by dividing the area available for installation of a photovoltaic power gener-ation system (S) by the system area per 1 kW (SPV), and then multiplying the result of that by the system price
per 1 kW (PVi). According to the Ministry of Economy, Trade and Industry’s Agency of Natural Resources and
conditioner with a new one once during that time. Therefore, in this study, it is assumed that the life of a photo-voltaic power generation system is 20 years long. To derive the cost of maintaining the system (PVM), based on
the results of an interview survey held with the Japan Photovoltaic Energy Association that were presented to the Ministry of Economy, Trade and Industry’s Agency of Natural Resources and Energy (2012) [14], as the cost of replacing a power conditioner with a new one, 1% of the system price (PV) was included in the calcula-tion and multiplied by the life of the system (T).
i PV
S
PV PV
S
= × (4)
0.01
M
PV =PV× ×T (5)
PV: System price (yen)
S: Area available for installation of a photovoltaic power generation system on a single house (m2)
SPV: System area per 1 kW (m2/kW) PVi: System price per 1 kW (yen/kW) PVM: System maintenance cost (yen) T: System life (years)
3) Subsidies
As subsidies for the installation of a photovoltaic power generation system, subsidies provided by the national government, prefectures and municipalities were taken into account. The sum of each of the subsidies was mul-tiplied by the capacity of the photovoltaic power generation system to be installed in order to derive the total subsidy amount. The subsidy amount per 1 kW provided by the national government is 20,000 yen when the cost per 1 kW to be subsidized is more than 20,000 yen and equal to or less than 410,000 yen, and 15,000 yen when the cost per 1 kW to be subsidized is more than 410,000 yen and equal to or less than 500,000 yen.
(
x y z)
PV
S
M M M M
S
= + + × (6)
M: Total subsidy amount (yen)
Mx: Subsidy from the national government per 1 kW (yen/kW) My: Subsidy from the prefecture per 1 kW (yen/kW)
Mz: Subsidy from the municipality per 1 kW (yen/kW)
S: Area available for installation of a photovoltaic power generation system on a single house (m2)
SPV: System area per 1 kW (m2/kW)
4) Profit and loss
In the derivation of the profit and loss (P) resulting from installation of a photovoltaic power generation sys-tem, the system price (PV), the system maintenance cost (PVM), and the total subsidy amount (M) are taken into
account in the sum of the profit during the electricity purchasing period (TM) and the profit in the period outside
the electricity purchasing period (T − TM). In the case where the annual amount of surplus electricity generated
(GS) is positive (Equation (7))—that is, in the case of a 500 m mesh unit where the annual amount of electricity
generated (G) is more than the annual amount of electricity consumed (GC)—a calculation in which profit from
the annual amount of surplus energy generated (GS × MS) is included in the profit during the electricity
purchas-ing period is conducted. The electricity rate was set as 24 yen per 1 kWh, which is the same as in the electricity rate system of TEPCO (Tokyo Electric Power Company) [15]. Further, according to the “Feed-in Tariff Scheme for Renewable Energy”, the electricity purchasing price for residential photovoltaic power generation (less than 10 kW) for the fiscal year 2013 is fixed at 38 yen, and the electricity purchasing period is fixed at 10 years. This study also uses that electricity purchasing price and electricity purchasing period. Concerning the rate for selling electricity (B), an average rate for selling electricity of 60% which is used in a provisional calculation by the Ministry of Economy, Trade and Industry’s Agency of Natural Resources and Energy (2009) [16], is used in this study.
(
)
{
}
(
)
{
}
(
) (
)
1 1 0S S C S C C M
C C M M S
P G M G B M G B M T
G B M T T PV PV M G
= × + × × + × − × ×
(
)
{
}
{
(
)
}
(
) (
)
1 1
0
S C M C
M M S
P G B M G B M T G B M
T T PV PV M G
= × × + × − × × + × − ×
× − − + − < (8)
G: Annual amount of electricity generated (Wh)
GS: Annual amount of surplus electricity generated (Wh) GC: Annual amount of electricity consumed (Wh) P: Profit and loss from installation (yen)
MC: Electricity rate (yen)
MS: Electricity purchasing price (yen) PV: System installation cost (yen)
PVM: System maintenance cost (yen) M: Total subsidy amount (yen)
B: Rate for selling electricity (%)
TM: Electricity purchasing period (years) T: System life (years)
5) Payback period
The payback period (Y), which is the period of time it takes until the initial cost of installing a photovoltaic power generation system is recovered by the annual profits, is derived. In this derivation, the profit which occurs during the electricity purchasing period is deducted from the necessary costs, which take into account the system price (PV), the system maintenance cost (PVM), and the total subsidy amount (M). The result of this is divided
by the profit gained in one year by electricity generated in the period outside the electricity purchasing period. The electricity purchasing period (TM) is then added to the result of that to obtain the payback period. It can be
determined that if the payback period (Y) is less than or equal to the device life (T), the region is suited to the in-stallation of photovoltaic power generation systems, and if the payback period (Y) exceeds the length of the de-vice life (T), the region is not suited to the installation of photovoltaic power generation systems.
(
)
(
(
)
)
(
)
(
)
1 0 1M S S C S C C M
M S
C C
PV PV M G M G B M G B M T
Y T G
G B M
+ − − × + × × + × − × ×
= + <
× − × (9)
(
)
(
(
)
)
(
)
(
)
1 0 1M C S M
M S C
PV PV M G B M G B M T
Y T G
G B M
+ − − × × + × − × ×
= + <
× − × (10)
G: Annual amount of electricity generated (Wh)
GS: Annual amount of surplus electricity generated (Wh) GC: Annual amount of electricity consumed (Wh) Y: Payback period (years)
MC: Electricity rate (yen)
MS: Electricity purchasing price (yen) PV: System cost (yen)
PVM: System maintenance cost (yen) M: Total subsidy amount (yen)
B: Rate for selling electricity (%)
TM: Electricity purchasing period (years) T: System life (years)
3.3. Subsidy Systems in the Regions Evaluated
3.3.1. Prefectural Subsidy Systemscase where the cost of a HEMS device is included in the price of the photovoltaic power generation system and the case where it is not included are imagined. Calculations are performed taking into account both the case where the prefectural subsidy can be used and the case where it cannot be used.
3.3.2. Municipal Subsidy Systems
Differences can be observed in the provision of subsidies for the installation of photovoltaic power generation systems in the municipalities in Kanagawa Prefecture. For example, in Kawasaki City, a subsidy of 25,000 yen per 1 kW is provided, whereas in Miura City there is no municipal subsidy system and a subsidy is not provided. Similarly, the maximum amount of subsidy money provided also differs. In Minamiashigara City the maximum is 28,000 yen, whereas in Ebina City it is 200,000 yen. Meanwhile, in Ninomiya Town, Isehara City, Yokohama City, Yokosuka City and Hiratsuka City, a fixed sum subsidy provision system is used. The amount of money provided differs among the fixed sum system regions too. In Ninomiya Town it is 70,000 yen, whereas in Yo-kosuka City it is 10,000 yen and in Hiratsuka City it is 30,000 yen.
4. Application of the Evaluation Method to the Regions for Evaluation
4.1. Outline of Evaluation Scenarios
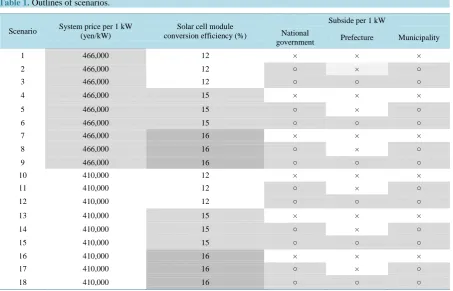
[image:8.595.88.542.432.723.2]Multiple scenarios were imagined, and evaluation was performed in order to find the differences in profit and loss and in payback period caused by differences in the price of photovoltaic power generation systems, solar cell module conversion efficiency, and subsidies provided by the national government, prefectures and munici-palities. For the photovoltaic power generation system price, two patterns were used: a system with a price of 466,000 yen per 1 kW, which is the standard in this study, as mentioned in Section 3.2.4; and a system with a price of 410,000 yen per 1 kW, which is the maximum price allowed in order to be eligible for the national sub-sidy of 20,000 yen per 1 kW. For the solar cell module conversion efficiency, three patterns of conditions for which the national subsidy is provided were used, as mentioned in Section 3.2.3. Concerning whether subsidies are provided or not, three patterns were used. These are the case where none of the national, prefectural and mu-nicipal subsidies is provided; the case where only the prefectural subsidy is not provided; and the case where all the subsidies are provided. Details of each scenario are summarized inTable 1.
Table 1. Outlines of scenarios.
Scenario System price per 1 kW (yen/kW)
Solar cell module conversion efficiency (%)
Subside per 1 kW
National
government Prefecture Municipality
1 466,000 12 × × ×
2 466,000 12 ○ × ○
3 466,000 12 ○ ○ ○
4 466,000 15 × × ×
5 466,000 15 ○ × ○
6 466,000 15 ○ ○ ○
7 466,000 16 × × ×
8 466,000 16 ○ × ○
9 466,000 16 ○ ○ ○
10 410,000 12 × × ×
11 410,000 12 ○ × ○
12 410,000 12 ○ ○ ○
13 410,000 15 × × ×
14 410,000 15 ○ × ○
15 410,000 15 ○ ○ ○
16 410,000 16 × × ×
17 410,000 16 ○ × ○
4.2. Results of Application of the Evaluation Method
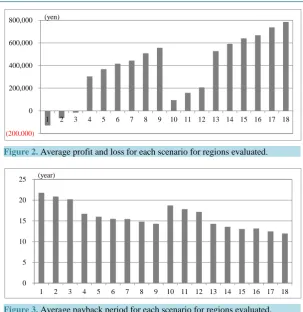
4.2.1. Evaluation of Profit and Loss for Each ScenarioAs mentioned in Section 3.2.4, 60% was used as the rate for selling electricity. Average profit and loss for each scenario for regions evaluated is shown inFigure 2. From the results for each scenario shown inFigure 2, it can be seen that there was a difference of over 900,000 yen between the largest loss, which was approximately 130,000 yen in Scenario 1 (system price 466,000 yen; module conversion efficiency 12%; no national, prefec-tural or municipal subsidy provided) and the largest profit, which was approximately 800,000 yen in Scenario 18 (system price 410,000 yen; module conversion efficiency 16%; national, prefectural and municipal subsidies all provided). In Scenarios 1, 2 and 3, which had a module conversion efficiency of 12%, only loss occurred. Sce-narios 10, 11 and 12, which also had a module conversion efficiency of 12%, also made less profit than other scenarios that had a module conversion efficiency of 15% or 16% but otherwise shared the same conditions as Scenarios 10, 11 and 12. Comparing scenarios which differed only in regard to module conversion efficiency (for example, Scenarios 1, 4 and 7), there was a difference in profit and loss of approximately 430,000 yen be-tween Scenario 1 (module conversion efficiency 12%) and Scenario 4 (module conversion efficiency 15%), and a difference in profit and loss of approximately 140,000 yen between Scenario 4 and Scenario 7 (module con-version efficiency 16%).
Meanwhile, concerning system price, pairing and comparing scenarios which had the same conditions except for system price, it can be seen that there was a difference of approximately 200,000 yen in profit and loss be-tween scenarios which have a system price of 466,000 yen (Scenarios 1 to 9), and scenarios which have a sys-tem price of 410,000 yen (Scenarios 10 to 18). Comparing scenarios which differed only in regard to whether subsidies were provided or not (e.g., Scenarios 1, 2 and 3), there was a difference of approximately 50,000 yen between Scenario 1 (in which no subsidies were provided) and Scenario 2 (in which only the prefectural subsidy was not provided), and a difference of approximately 50,000 yen between Scenario 2 and Scenario 3 (in which all subsidies were provided) as well. Therefore, because there are regions where it is possible that a loss will become a profit depending on whether or not subsidies are provided, when purchasing a photovoltaic power generation system, it is necessary to thoroughly check whether conditions for receiving the national, prefectural and municipal subsidies are fulfilled.
4.2.2. Evaluation of Payback Period for Each Scenario
The average payback period for each scenario for regions evaluated when the rate for selling electricity is 60% (as in the previous section) is shown inFigure 3. From the results for each scenario inFigure 3, it can be seen that the shortest payback period is the approximately 12 year payback period of Scenario 18, and the longest payback period is the approximately 22-year payback period of Scenario 1. There is a difference of about 10 years between these. The payback period for Scenarios 1, 2 and 3 (which have a module conversion efficiency of 12%) exceeds the 20-year life of the system assumed in Section 3.2.4, and it can be said that these scenarios are not suited to the installation of photovoltaic power generation systems. With a payback period of over 15 years, Scenarios 10, 11 and 12 (which also have a module conversion efficiency of 12%) also have a longer payback period than other scenarios which have a module conversion efficiency of 15% or 16% but otherwise share the same conditions as Scenarios 10, 11 and 12. When comparing scenarios which differ only in regard to module conversion efficiency, as in the previous section, it can be seen that there is a difference of approx-imately 5 years between the payback periods of Scenarios 1 and 4, and a difference of approxapprox-imately one year between the payback periods of Scenarios 4 and 7.
Figure 2. Average profit and loss for each scenario for regions evaluated.
Figure 3. Average payback period for each scenario for regions evaluated.
4.3. Summary of Evaluation Results
As an example of evaluation results in all regions evaluated,Figure 4 andFigure 5 show results for profit and loss and payback period for Scenario 6 (system price 466,000 yen; module conversion efficiency 15%; national, prefectural and municipal subsidies provided) when the rate for selling electricity is 60%. Taking account of what is outlined in Sections 3.2.3. and 3.2.4, it can be considered that as things stand now, Scenario 6 has the conditions that are most likely to apply when a photovoltaic power generation system is installed. Concerning the installation of photovoltaic power generation systems in Kanagawa Prefecture,Figure 4 andFigure 5 clear-ly show that in the case of a system with a silicon poclear-lycrystalline-type solar cell module with a conversion effi-ciency of 15% and an estimated system life of 20 years, a profit can be expected in almost all the regions in the prefecture. Therefore, it can be said that Kanagawa Prefecture is a region suited to the installation of photovol-taic power generation systems. InFigure 4, a trend for profit to be large in the southwest of the prefecture but small in the eastern part of the prefecture can be observed. Further, inFigure 5 it can be seen that depending on the location of installation, the payback period differs by several years. It is short in the northern part of the pre-fecture, but the further south the location of installation, the longer it is. However, the results of this study are based on the case of an estimated photovoltaic power generation system life of 20 years. Systems may actually operate for longer than the estimated life, and in such cases an increase in profit proportional to the extra oper-ating time can be obtained.
5. Proposals for Policies for the Promotion of the Spread of Photovoltaic Power
Generation
5.1. Classification of Municipalities
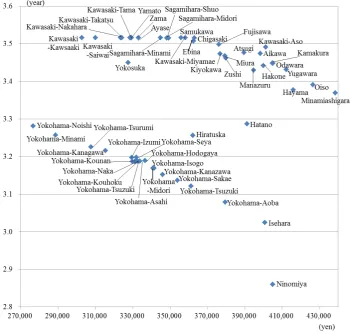
Based on the results described in the previous section concerning evaluation of profit and loss and payback pe-riod for Scenario 6 when the rate for selling electricity is 60%, using the average of the largest and smallest val-ues of these results as standards, the municipalities were classified into four groups (Figure 6). The Most Suita-ble type is a region in which a large profit can be anticipated and the payback period is relatively short. Regions
(200,000) 0 200,000 400,000 600,000 800,000
1 2 3 4 5 6 7 8 9 10 11 12 13 14 15 16 17 18
(yen)
0 5 10 15 20 25
1 2 3 4 5 6 7 8 9 10 11 12 13 14 15 16 17 18
Figure 4. Results for profit and loss (yen) for scenario 6 in all regions evaluated.
Figure 5. Results for payback period (year) for scenario 6 in all regions evaluated.
with small populations such as Ninomiya Town and Aikawa Town belong to this category. Meanwhile, some regions which are ordinance-designated cities, such as Asao Ward and Miyamae Ward in Kawasaki City and Aoba Ward in Yokohama City also belong to this group. In these regions, there is a large area available for the installation of a photovoltaic power generation system, and a large amount of subsidy money is provided as well. Therefore, the profit is large and the payback period is short, and these regions are the most suited to the instal-lation of photovoltaic power generation systems in Kanagawa Prefecture.
Next are the High-profit/Long-term Payback-type regions. In these regions, a large profit can be anticipated, but on the other hand, the payback period is long. In these regions there is a large area available for the installa-tion of a photovoltaic power generainstalla-tion system, so it is possible to install a high-capacity photovoltaic power generation system; however, doing this requires a large initial payment, and subsidies provided by local gov-
No houses
100,001 - 200,000
200,001 - 300,000
300,001 - 400,000
400,001 - 500,000
500,001 - 600,000
600,001 - 700,000
700,001 - 800,000
800,001 - 900,000
900,001 – 1,000,000 s6
0 5 10 20 km N
No houses
13.1 - 14.0
14.1 - 15.0
15.1 - 16.0
16.1 - 17.0
17.1 – 18.0
18.1 - 19.0
19.1 - 20.0
20.1 - 21.0 s6t
[image:11.595.142.484.370.580.2]Figure 6. Comparison of the profit and loss and payback period in each municipal.
ernments in these regions are less than those in other regions; therefore, the payback period is long. Minamia-shigara City has a particularly low subsidy of 8000 yen/kW (maximum subsidy: 20,000 yen), so it has an even longer payback period than the other regions in this group. Further, of the regions which are mostly mountainous, such as Hakone Town, because of the high elevation, in regions which receive sunlight there is a large amount of solar radiation and a large ultimate profit can be anticipated. On the other hand, in locations between moun-tains there are also places where there is not much solar radiation and not much profit can be anticipated. Therefore, in regions where the profit differs greatly depending on the installation location, it is necessary to pay attention to this point when installing a photovoltaic power generation system. However, in this group the pay-back period is long but the annual profit is large. Therefore, if the photovoltaic power generation system oper-ates for longer than the estimated 20-year life, more profit can be anticipated than for other groups.
In the Low-profit/Short-term Payback-type regions, the area available for the installation of a photovoltaic power generation system is small, so not much profit can be anticipated; however, the payback period is shorter than that of other groups. Many districts which are ordinance-designated cities and have large populations be-long to this group, such as Yokohama City, Kawasaki City and Sagamihara City. Because the area available for the installation of a photovoltaic power generation system is small, the initial cost can be kept down. Further, subsidies provided by the municipalities are larger than in other regions. Therefore, the payback period is short.
5.2. Consideration of Small Capacity Systems
The profit and loss and payback period in the case where the small capacity photovoltaic power generation sys-tem introduced in Section 2.1 is installed are estimated, and the suitability of installing this syssys-tem is also consi-dered. Concerning whether or not a region is suited to the installation of small capacity systems, in addition to considering the issue of whether a profit can be anticipated within the life of a regular photovoltaic power gen-eration system, it is necessary for differences in profit and loss and payback period to be small compared to the case where a regular system is installed on all the area available for installation of a photovoltaic power genera-tion system. If a small-capacity system is installed, it is possible that almost no surplus electricity generagenera-tion can be expected, profit will decrease, and the payback period will be long. Therefore, even if a profit can be ex-pected within the life of the system, for regions where there is a large difference in the profit and loss and the payback period compared to the case of installing a regular system, it is difficult to say that they are suited to the installation of a small-capacity system.
[image:13.595.137.488.375.709.2]Based on the above, the results of consideration of the installation of small-capacity systems are shown in Figure 7. The vertical axis shows the difference in payback period between the case of installing a small-capac- ity system and the case of installing a regular photovoltaic power generation system on all the area available for installation, and the horizontal axis shows the difference in profit and loss between these cases. Therefore, the closer a region is to the origin, the smaller the differences are in both profit and loss and payback period between the case of installing a small-capacity system and the case of installing a regular system on all the area available for installation of a photovoltaic power generation system, and the more suitable the area is for the installation of a small capacity system. Regions close to the origin are Yokohama City, Ninomiya Town, Isehara City, Hirat-suka City and so on. They are all regions with a fixed-sum subsidy system. Further, most districts in Kawasaki City and Yokohama City belong to the Low-profit/Short-term Payback-type group, but Yokohama City is more suited to the installation of small capacity systems.
5.3. Proposals for Policies for Each Group
Based on the classification of the local governments and the results of consideration of the installation of small capacity systems in this section, policies to promote the spread of photovoltaic power generation are proposed for each of the four groups. As a policy for the Most Suitable type of region, rather than by trying new subsidy systems or the like, it is more likely that the installation of photovoltaic power generation can be promoted by widely publicizing the fact that this type of region is suited to the installation of photovoltaic power generation. In particular, because the installation of small-capacity systems can also be recommended in Aoba Ward and Tsuzuki Ward in Yokohama city and in Ninomiya Town, if there is a desire to strongly promote this, a method where firstly, installation is tested in the above-mentioned regions and model cases are created can be consi-dered. In the High profit/Long-term Payback type of region, there are many regions where the subsidy provided by local governments is less than that of other regions. Therefore, for these regions, raising the amount of the subsidies provided by the local governments and implementing other similar measures can lead to promoting the spread of photovoltaic power generation.
In the Low-profit/Short-term Payback type of region, the subsidy provided by each local government is large, but the area available for the installation of photovoltaic power generation systems is small. Therefore, the sub-sidy provided by the prefecture is small in comparison to other regions. However, as indicated in the previous section, in Yokohama city, the subsidy is based on a fixed sum system. Therefore, if the subsidy provided by the prefecture is also based on a fixed sum system, an increase in profit can be expected. Further, Yokohama City is suited to the installation of small-capacity systems; therefore, by strongly recommending this, the number of households which install photovoltaic power generation systems can be increased. Among the Installation Dif-ficult-type regions, there are many regions where a subsidy is not provided or the subsidy amount is small, such as Miura City and Yokosuka City. Therefore, for this group, the provision of some subsidy money from each municipality or an increase in the amount of the subsidy provided by each municipality can be considered. Fur-ther, in this group, in regions where the profit is relatively large and the payback period is relatively short, a method where firstly, installation of photovoltaic power generation systems is encouraged in only the places where the profit is larger and the payback period is shorter can be considered.
6. Conclusions and Future Work
The conclusion of this study can be summarized into the three points below.
1) A method of evaluating the suitability of introducing a photovoltaic power generation system was proposed. In the method, profit and loss resulting from the installation of a photovoltaic power generation system and the payback period are derived taking into account the price of the photovoltaic power generation system, sunlight conversion efficiency of solar cell modules, subsidies, electricity purchase price, the life of the photovoltaic power generation system, the rate for selling electricity and so on.
2) Kanagawa Prefecture was selected as the region for evaluation. Multiple scenarios were prepared using different photovoltaic power generation system prices, solar cell module conversion efficiencies, and subsidies, and the evaluation method was applied. It was found that in Kanagawa Prefecture, if a system with a module conversion efficiency of 12% is used, there are few regions in which a profit can be anticipated. However, if a system with a module conversion efficiency of 15% or more is used, in almost all regions in the prefecture, the payback period is shorter than the 20-year life of the photovoltaic power generation system, and a profit can be expected. Further, it was found that in the southwest part of the prefecture, there are many regions where a large profit can be expected, and in the eastern part of the prefecture, there are many regions where the profit is small.
3) Based on the classification of each municipality and the results of consideration of the installation of small- capacity systems, policies for the promotion of the spread of photovoltaic power generation in each municipality were proposed. Regions which particularly suit the installation of photovoltaic power generation systems in-clude Asao Ward and Miyamae Ward in Kawasaki City and Ninomiya Town. Ninomiya Town is also suited to the installation of small-capacity systems. In contrast, it was found that in regions where a subsidy is not pro-vided or the amount of the subsidy propro-vided is small, such as Miura City and Yokosuka City, the profit is small and the recovery period is long compared to other regions. In such regions, policies which increase subsidy amounts and encourage the installation of photovoltaic power generation systems in a limited selection of places are required.
solar cell modules, if such data is available. Another example is to apply the evaluation method of this study to other regions.
References
[1] Luca, B. and Pietro, A. (2011) Scalable Methodology for the Photovoltaic Solar Energy Potential Assessment Based on Available Roof Surface Area: Application to Piedmont Region (Italy). Solar Energy, 85, 1041-1055.
http://dx.doi.org/10.1016/j.solener.2011.02.022
[2] Furuichi, H., Sadohara, S. and Yoshida, S. (2011) Study on the Possibility of Renewable Energy Use in Hadano. Tech-nical Paper Summaries from the 2011 Convention of the Architectural Institute of Japan, 969-970.
[3] Shinohara, S., Yoshida, S. and Sadohara, S. (2010) Study on the Use of Solar Energy Based on the Mesh Clustering of Regional Energy Supply and Demand Characteristics. Technical Paper Summaries from the 2011 Convention of the Architectural Institute of Japan, 703-704.
[4] Sugihara, H., Yamashita, J., Ikoma, Y., Akisawa A. and Kashiwagi, T. (2011) A Study on the Potential of Photovoltaic Power Generation Systems in All Houses in Japan Using Climatic Mesh Data. Solar Energy, 37, 41-48.
[5] Tamura, S., Uchiyama, Y. and Okajima, K. (2010) Analysis of Local Power Load and Economic Efficiency Resulting from the Spread of Photovoltaic Power Generation: A Case Study in Tsukuba City. Socio-Economic Research Center,
58, 15-25.
[6] The Ministry of Land, Infrastructure, Transport and Tourism’s Geospatial Information Authority of Japan (2013) Base Map Information Digital Elevation Model elevation Data. Accessed 2013.2.5. in Japanese.
http://www.gsi.go.jp/kiban/
[7] The Statistics Bureau of the Ministry of Internal Affairs and Communications of Japan (2013) the Portal Site of Offi-cial Statistics of Japan (E-Stat). Accessed 2013.2.5. in Japanese. http://wwwe-stat.go.jp/SG1/estat/eStatTopPortal.do [8] Photovoltaic Power Generation/Photovoltaic Panel Comparison/Installation Guide (2013) Accessed 2013.2.5. in
Japa-nese. http://xn--3ck6al9gm5gib0355ejqq630cny0ahx0ej4vacwb.com/myroof/
[9] The Panel for Improving the Quality of Construction of Residential Solar Power Generation Systems of the Ministry of Economy, Trade and Industry’s Agency of Natural Resources and Energy (2007) Residential Solar Power Generation System Design and Construction Guideline, 33.
[10] Japan Photovoltaic Energy Association (2013) Solar Cell Module Shipment Statistics, 1.
[11] New Energy and Industrial Technology Development Organization (2008) Technical Guidebook for Installation of Re-gional-Focused New Energy Systems and So Forth, 144.
[12] The Statistics Bureau of the Ministry of Internal Affairs and Communications of Japan (2013) Japan Statistical Year-book2010. Accessed 2013.2.5. http://www.stat.go.jp/data/nenkan/10.htm
[13] The Ministry of Economy, Trade and Industry’s Agency of Natural Resources and Energy (2013) Supporting Data for Considering Acquisition Cost in FY.
[14] The Ministry of Economy, Trade and Industry’s Agency of Natural Resources and Energy (2012) Data 2. Results of Interview, 36.
[15] TEPCO (Tokyo Electric Power Company) (2013) Accessed 2013.2.5. http://www.tepco.co.jp/index-j.html
currently publishing more than 200 open access, online, peer-reviewed journals covering a wide range of academic disciplines. SCIRP serves the worldwide academic communities and contributes to the progress and application of science with its publication.
Other selected journals from SCIRP are listed as below. Submit your manuscript to us via either