Robust Copy Move Image Forgery Detection using Scale
Invariant Features Transform
Himanshu Goyal
Department of Electronics & Communication Engineering, MMU, Mullana (Ambala), INDIA
Tarun Gulati
Department of Electronics & Communication Engineering, MMU, Mullana (Ambala), INDIA
ABSTRACT
Now a day’s digital images are widely used as compared to analog images because of several advantages of digital data. Images are used as the information source, evidence in court, diagnosis problem in bio-medical and in various other applications.For the last few years, tampering of images become easier with manipulated software like adobe Photoshop .In this paper the problem of detecting copy-move image forensic is investigated and attention has been paid about which area of an image is copied and pasted onto another zone to create a duplication of an image. To detect this kind of tampering, methodology based on scale invariant features transform (SIFT) is used. Such a method allows both to understand if a copy-move attack has occurred but some time when two similarobjectsare present duringthe photographySIFT can’t distinguish between them because SIFT are robust to illumination. But in this paper pixel intensity values are also used in forgery detection
General Terms
SecurityKeywords
Digital image forensics, copy-move attack, EXIF, SIFT, Authenticity Verification.
1.
INTRODUCTION
In our daily life digital media are playing a more and more important role because of the popularity of low-cost and high-resolution digital cameras are easily available. Digital imaging has matured to become the dominant in technology and has many applications in creating, processing, and storing pictorial memory and evidence.One of the specific type of forgeries, which is the main interest of this paper, is copy-move forgery that can be done very easily by using manipulated software and tools such as Cloning tool in Adobe Photoshop software. This type forgery usually aims to cover an unwanted scene in the image, by copying another scene from the same image, generally a textured region, and pasting it into the unwanted region. There are many ways to categorize the image tampering based on different points of view for example [1]. Generally, most often performed operations in image tampering are:
1. Hiding a region in the image.
2. Misrepresenting the image information. 3. Adding a new object into the image.
1.1
Copy-Move Forgery
Copy-Move image forgery is the widely used technique to edit the digital image. Copy move image manipulation technique become common, in which a portion of the image is copy and
[image:1.595.309.553.337.447.2]an object in the pictured scene. Sometime it can be very difficult to detect cloning, when retouching tools are used. Since the copied parts are from the same images, some components like noise, intensity, and color are same in original region and copied region in the image. Furthermore, since the cloned regions can be of any shape and location .To detect the region of some other image statistical methods may work but if the region pasted belongs to the same image then it’s quite difficult to detect this forgery. Many methods have been suggested to detect this type of forgery. Some methods regarding Copy-Move forgery are highlighted in [2].
Figure 1 : The photo (left) is a tampered with original (right)
To construct a persuade forgery, it is usually necessary to resize, rotate, or stretch portions of an image. So detection technique must be robust or invariant to rotation and scale. For example, when creating a composition of two objects, one object may have to be resized to match his relative heights and widths. Momentarily, local visual features like SIFT have been widely used for image improvement, and object recognition due to their robustness to several transformations (such as rotation and scaling), occlusions and clutter. More novel, attempts has been made to apply these kinds of features also in the digital forensic domain. In fact, SIFT features have been used for fingerprint detection [3], shoeprint image improvement, [4], and also for copy-move detection [5]. In copy-move forgery the single image is used to perform forgery within that image. In image composition sometime two or more images are combined together to form another image. In tampering image features the characteristics of the images like brightness, contrast is manipulated to change the image's meaning.
2.
PROPOSED METHOD
The proposed approach is based on the Scale Invariant Features Transform (SIFT) [6], which are used to robustly detect and describe clusters of points belonging to duplicate areas. [7], provided a comprehensive analysis of several local descriptors in while local affine region detectors are surveyed in [8]. Good copy-move forgery detection should be robust to some type of transformations. Most of the existing methods are time consuming and do not deal with all transformation. One of the main strengths of SIFT features is their scale invariance.
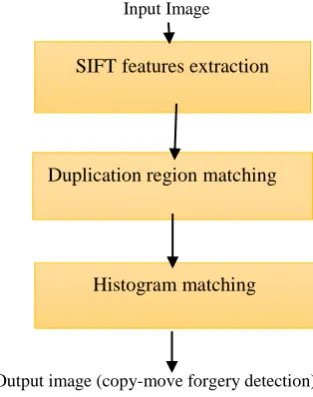
Input Image
[image:2.595.92.249.190.389.2]
Output image (copy-move forgery detection) Figure 2 Overview of the proposed system.
2.1
SIFT features extraction
SIFT is what actual human and animal visual system is essentially doing. There are neurons which doing operation similar to SIFT. SIFT feature extraction [6] consist of four steps:
a. Scale-space peak selection. b. Keypoint localization. c. Orientation assignment. d. Keypoint descriptor.
Let a given image for authentic verification say I, First identify the location of peaks in scale space (different size of sigma in Laplacian of Gaussian), then smoothing by the Gaussian filter with sigma value .sigma vale has been just a width of the mask used in filtering. One sigma value is very difficult to select. so instead of using one value, much value of sigma is used .Reason for using many value only because the author don’t know at what scale details appear in an image . Then pyramid levels are obtained by Gaussian smoothing and sub-sampling of the image resolution while interest points are selected as look 3*3 neighborhood of that point at that scale and look at scale above that and scale below that, the center point is local extrema (min/max) of all 26 points on the scale-space. These key points, referred to as xi [9] in the following, are extracted by applying a computable approximation of the Laplacian of Gaussian called Difference of Gaussians (DoG). Where L (x, y, kσ) is the convolution of the original image I (x, y) with the Gaussian blur G (x, y, kσ) at scale kσ. In order to guarantee invariance to rotations, the algorithm assigns to each keypoint a canonical orientation o.
(1) To actuate this orientation, a gradient orientation histogram is enumerate in the neighbourhood of the keypoint. Respectively, for an image sample at scale (the scale in which that keypoint was detected), the gradient magnitude and orientation are preassembled using pixel differences:
)
(2)
The extracted features must be well unconnected in the feature space to yield effective discrimination between images. In this work the features are extracted using SIFT. The feature descriptor is enumerated as a set of orientation histograms on 4 x4 pixel neighborhoods
.
(3)
2.2
Duplication
Region Matching
In this arrangement, to determine the duplication region, an agglomerative hierarchical clustering [9] [10] is executed on spatial locations i.e. x; y coordinates of the matched points. Hierarchy of clusters is developed by Hierarchical clustering which may be represented by a tree structure. The algorithm starts by assigning each keypoint to a cluster; then it enumerates all the interchangeable spatial distances among clusters, first finds the closest pair of clusters, and finally reduce them into a single cluster. Such calculation is iteratively repeated until a final reducing situation is achieved. The way this final reducing can be accomplished is basically conditioned both by the linkage method adopted and by the threshold used to stop cluster grouping.
2.3
Histogram matching
A digital image f (x, y) is discretized both in spatial coordinates and brightness. It can be considered as a matrix whose rows, column indicate specify a point in an image and the element value identifies the grey level at the point .these elements are referred to as pixels or PELs. Where are (x, y) the reflectivity of a surface of corresponding image point and I (x, y) represent the intensity of incident light.
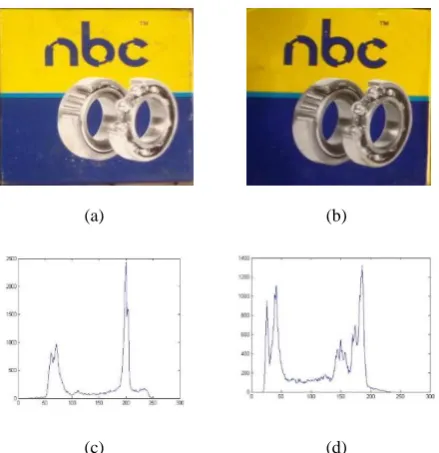
(4) So when copy move forgery was detected in testing image using SIFT algorithm, sometime original image detected as forgery so to improve False Positive Rate (FPR) intensity plot is calculated as the two similar looking objects which are detected as tampered has different intensity, if the intensity plot of both the similarities are same then they result as tampered but if the intensity plot of both the both the objects are not same then they result as the original image.
In figure 3 two similar objects (bearing) place a side to each other and then click a photo with 8MP camera then test that photo by SIFT, when matching result come to similar object in original image detect as tampered. Then recheck this by using a histogram plot of similar object. If the plot of both the images matches then this is forgery image else original image
.
SIFT features extractionDuplication region matching
(a) (b)
(c) (d)
Figure 3: (a) and (b) show two match region in tested image and their histogram in (c) and (d)
In figure 3, to match the region with SIFT matching and their histogram are shown. The graph of both the match region doesn't match with each other so this is not tampered image, more experiment are done in the next section.
3.
EXPERIMANTAL RESULTS
The proposed method has been implemented using MATLAB 8.2.0.701 (R2013b) in a computer of CPU 2.40 GHz with memory of 2 GB. The fast SIFT detector along with SIFT descriptors are used to detect interest point and descriptors. The main task in any object recognition is matching the similarity between two further points. For this agglomerative hierarchical clustering algorithm is used in the system. The some images have been downloaded from the internet. Since the image size is very important for any detection algorithms, six different images which are considered to be more challenging for copy-move forgery detectors with different resolution and different size of copying area are used in experiments. The original images are shown in Figure 4. Two images are of high resolution and two images are of low resolution. The copied region has basically the same appearance of the original one, therefore the key points extracted in the duplicated region will be similar to the original ones. Therefore, matching among the features can be adopted for the task of determining possible tampering. Since 1992 tampering of the image has been done by digital imaging technology, until now there has been No robust method available to solve the unique issues of image processing in an everyday digital forensic environment. Adobe Photoshop CS6 helps the manipulator for a tampering image like Professionals, digital images need legal personnel dealing and enforcement
.
A. Analysis for forgery detection
In the proposed method the SIFT Keypoint and Descriptor used, for the extract feature of tested image .A number of feature and detection of forgery depend on the resolution of the image and the quality of the image Table show the resolution of testing image and Figure 4 shows the original image .Here four images are tested in which there are forgery and one image (Bearing) is (including both photos and video stills).
So that's why all tested imaged are forgery with latest version of Adobe Photoshop CS6.
(a) (b)
[image:3.595.60.280.68.295.2](c) (d)
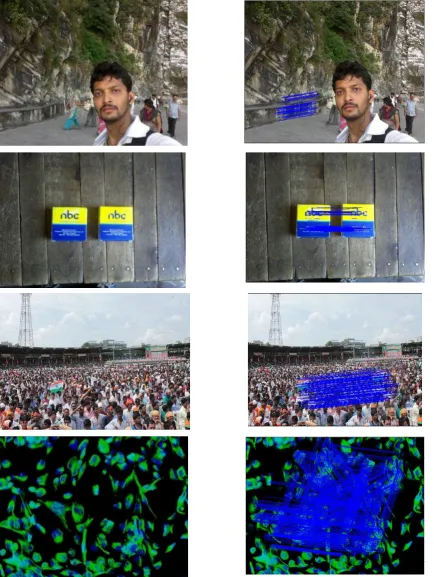
Figure 4: Original images (a) Road (b) Bearing (c) Crowd (d) Stem Cell
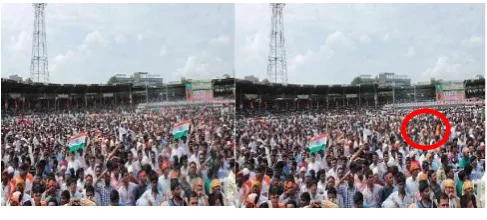
[image:3.595.308.543.100.308.2]Here, report some experimental results on images where a copy-move attack has been performed. In this case the forged region is selected according to the specific goal to be achieved and, above all, paying attention to perfectly conceal a modification, where the alteration are not recognizable at least at the first glance and forensic tool could help with investigations. For instance the images Bearing is not forged with any technique. Stem Cell image is forged with a many cell within the image. In road image one lady is removed with stamp clone in Photoshop. Crowd image is modified as a group of the crowd is copy and paste at other region, only one flag in crowd present in the original image. The image with its resolution is listed in Table 1.
Table I: Test images with their resolutions
IMAGE RESOLUTION
STEM CELL 1772
BEARING
ROAD
CROWD 580
[image:3.595.332.517.499.614.2]Figure 5: The forgery images are in the left column. The right column show the detect region. From top to bottom: Road (one small copied region), bearing (no copied region), crowd (large copied region), stem cell (four copied region).
Matched key points give the information about the tapered region in tested image. Higher the matched region means more region is tampered. As shown in figure 6 stem cells has four tampered regions which result in more matched region. A high number of matches are fundamental in order to identify the forged region. Note for image Road the number of matches is very less. This is mainly because a small
Table II: The number of keypoints extracted, the number of keypoints matched and the detection time for each image
Image No of keypoint
matches Detection time (Sec)
Stem cell 5129 1008 29.7813
Bearing 3728 155 14.9275
Road 6254 81 46.9765
Crowd 2098 193 5.9968
[image:5.595.306.544.316.676.2]Higher the resolution result in more extraction of keypoint feature which result an increase in detection time as shown in figure 7.Tested image, road result in more time for detection just because the resolution and quality of camera (8 MP) is higher.
Figure 6: Estimation among the numbers of keypoints extracted for high and low resolution images and the
[image:5.595.53.283.318.699.2]number of keypoints matched
Figure 7: Time taken (seconds) to detect the duplicated section
B. Analysis on original image.
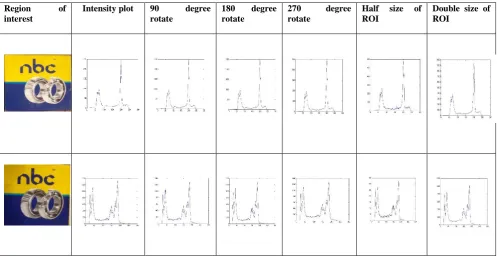
In this section, the performance of the system is analyzed for better false positive rate (FPR). When original image Bearing is check with SIFT detector, feature of the image is extracted and then cluster matching is done to detect all same regions in an image, here bearing detect as forgery as shown in figure 8. Just because SIFT algorithm are robust to change in intensity so two similar objects in image detect as a forgery .To overcome this drawback checks the intensity value of similar match regions and then plots their graph. If both graph match then the image is original. System. so for this check whether the intensity graph is robust to scale and rotate, then calculate the intensity value of the region of interest at different rotation angles in Table III, first rotate the image at 90Degrees and plot the intensity value of that region in the graph and then do similar for 180 Degree and 270 Degree .By doing so, the graph of all the rotates region value has almost same. So this is an intensity graph is rotation invariant. Now next is to find whether this is also scale invariant or not, for checking this just resize the region of interest to its half the resolution and double the resolution is almost same so this is invariant to scale also.
(a)
(b)
Figure 8: Original image recognize as forgery 0
1000 2000 3000 4000 5000 6000 7000
Stem Cells
Bearing Road Crowd
No of Keypoints Matches
0 10 20 30 40 50
Stem cell Bearing Road Crowd
Detection Time(sec)
[image:5.595.52.282.320.487.2]Table III. Shows the graph of the ROI of Bearing image and then check its robustness to rotation and scale.
Region of interest
Intensity plot 90 degree rotate
180 degree rotate
270 degree rotate
Half size of ROI
Double size of ROI
4.
CONCLUSION
An approach to guide image forensic investigation based on SIFT Interest Point and SIFT descriptors has been proposed. Given a suspected photo with high resolution and low-resolution, the system can reliably detect if certain area has been duplicated. Furthermore, false positive rate (FPR) is improved by check the intensity value of the region of interest. The system is robust in detecting images which have undergone attacks such as rotation and Gaussian noise .however, the process of ROI coordinates is manually .In future, the author would like to deal with automatic calculate coordinates of ROI forintensity graph.
5.
REFERENCES
[1] X. Shuai, C. Zhang and P. Hao, “Fingerprint indexing based on composite set of reduced SIFT features,” in ICPR, Tampa,Florida, USA., 2008
[2] H. Su, A. Bouridance and M. Gueham, “Local image features for shoeprint image retrieval,” in BMVC, Warwick, UK, 2007.
[3] S. Lyu and X. Pan, “Detecting image region duplication using SIFT features,” IEEE ICASSP, Dallas, USA, 2010. [4] S. Bayram, H. T. Sencar and N. Memon, “A Survey of
Copy-Move Forgery Detection Techniques,” in IEEE Western New York Image Processing Workshop, New York, September 2008.
[5] J. Fridrich, D. Soukal and J. Lukas, “Detection of copy-move forgery in digital images,” in DFRWS, Cleveland, OH.
[6] I. Amerini, L. Ballan, R. Caldelli and A. D. Bimbo, “A SIFT-based forensic method for copy-move attack detection and transformation recovery.,” IEEE transactions on information forensics and security, vol. 6, no. 1, Sep. 2011.
[7] D. Lowe, “Distinctive image features from scale-invariant keypoints,” International Journal of Computer Vision, vol. 60, no. 2, p. 91–110, 2004.
[8] K. Mikolajczyk and C. Schmid, “A performance evaluation of local descriptors,” IEEE Transactions on Pattern Analysis and Machine Intelligence, vol. 27, no. 10, p. 1615–1630, 2005.
[9] S. Bayram , I. Avcibas , B. Sankur and N. Memon, Image manipulation detection with binary similarity measures, Antalya, Turkey: EUSIPCO, 2005.
[10] D. Brugioni, Photo Fakery:The History and Techniques of Photographic Deception and Manipulation., Brassey’s Inc, 1999.
[11] H. Farid and S. Lyu, “Higher-order wavelet statistics and their application to digital forensics,” IEEE CVPR Workshop on Statistical Analysis in Computer Vision, USA, 2003.
[12] H. Farid, “Creating and detecting doctored and virtual images,” Implications to the child pornography prevention act, Hanover, New Hampshire., 2004.
[13] K. Mikolajczyk, T. Tuytelaars, C. Schmid, A. Zisserman, J. Matas, F. Schaffalitzky, T. Kadir and L. V. Gool , “A comparison of affine region detectors,” International Journal of Computer Vision, vol. 65, no. 1/2, p. 43–72, 2005.
[14] T. Hastie, R. Tibshirani and J. Friedman, The Elements of Statistical Learning., California: Springer, 2003.