PID and Sliding Mode Control-SMC for a Motor-pump
Voltage in a Photovoltaic- PV System based on MPPT
Controller
Salim. Abouda
Lab-STA University of Sfax National Engineering School of
Sfax (ENIS) B.P.: 1173, 3038 Sfax-Tunisia
Frédéric. Nollet
CReSTIC,Université de Reims IUT de Troyes, 9 rue de Quebec Troyes - France
Najib. Essounbouli
CReSTIC,Université de Reims IUT de Troyes, 9 rue de Quebec Troyes - France
Abdessattar. Chaari
Lab-STA University of Sfax National Engineering School of
Sfax (ENIS) B.P.: 1173, 3038 Sfax-Tunisia
Yassine. Koubaa
Lab-STA University of Sfax National Engineering School of Sfax (ENIS) B.P.: 1173,
3038 Sfax-Tunisia
ABSTRACT
In this paper, a simulation model of a solar cell is defined to allow estimation of the electrical behavior of the cell with respect changes on environmental parameter of temperature and irradiance. Maximum Power Point Trackers (MPPT) play an important role in photovoltaic (PV) power systems because they maximize the power output from a PV system for a given set of conditions, and therefore maximize the array efficiency. DC/DC converters together with maximum power point tracking systems (MPPT) are used to avoid the energy losses. Different algorithms have been proposed for maximum power point tracking, the Incremental Conductance (IncCond) method is studied in this work. We present in this paper the implementation of a photovoltaic model using Matlab/Simulink, which can be representative of PV cell module, for easy use on simulation platform. Next, a voltage control of a photovoltaic system is presented in order to have a constant voltage at the output, always keeping the system to work at maximum power. For this, two methods of control of the output voltage are presented. The first is to use a proportional, integral & derivative controller (PID), while in the second a sliding mode controller (SMC) is used. This system is tested for a resistive load and for a centrifugal pump driven by a permanent magnetic DC (PMDC) motor. The simulation results are carried out using Matlab/Simulink.
General Terms
Photovoltaic system; voltage control.
Keywords
Photovoltaic generators; Maximum power point tracking (MPPT); DC/DC converters; PWM generator; voltage control; PID; Sliding Mode Controller SMC.
1.
INTRODUCTION
Worldwide interest in sustainable energy is increasing due to the energy crisis and the aggravated environmental pollution. Solar energy is an important renewable energy source. As compared to other energy sources, solar energy is clean, inexhaustible and free. Photovoltaic (PV) arrays are used to convert solar energy into electrical energy. But the PV systems have a major problem, that the conversion
efficiencies of the PV arrays are low especially under low irradiation conditions.
The solar V-I characteristic is nonlinear and changes with irradiation and temperature. In general, there is a unique point on the V-I curve called the Maximum Power Point (MPP) at which the PV array operates at maximum efficiency. Maximum Power Point Trackers (MPPT) are used to maintain the PV array‟s operating point at the MPP to maximize its output. Therefore, various MPPT techniques are described in the literature. Among these methods, the perturb and observe (P&O) and the incremental conductance (IncCond) method are the most used [1].
In this paper, simulation and voltage control of a standalone Photovoltaic (PV) system based on MPPT technique are studied with an application to a pumping system. Indeed, two methods of control of the output voltage are presented: the proportional, integral & derivative controller (PID), and the sliding mode controller (SMC).
A photovoltaic module with a stage adaptation of DC-DC between the PV cell and the output load are presented. This stage adaptation has a command MPPT, which allows it to track the MPP that can provides a photovoltaic solar panel. In this case, the (IncCond) method is used [2, 3].
In this study, a PV system including the MPPT technique with a constant resistive load is designed and simulated. The P-V curves for a constant temperature and a different irradiance are shown [4].
Finally, a system for regulating the output voltage of the photovoltaic system is presented and tested for a resistive load and for a centrifugal pump driven by a permanent magnetic DC (PMDC) motor. For this, two methods of control of the output voltage are presented. The first is to use a PID controller, whereas in the second we use a SMC [5].
2.
PHOTOVLTAIC MODULES
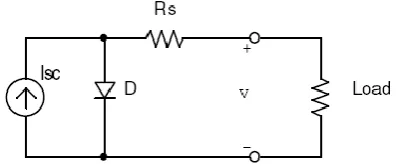
The model consists of a current source (Isc), a diode (D), and a serie resistance (Rs), shown in Figure 1.
current (Isc) and the reverse saturation current of diode (Io). It uses a single diode with the diode idealist factor (n) set to achieve the best I-V curve match [4,6].
Fig 1: Equivalent circuit used in the MATLAB simulations
The equation that describes the current-voltage relationship of the PV cell is [3]:
1
*
0
nkT R I V q
sc
s
e
I
I
I
(1)Where:
I is the cell current,
V is the cell voltage,
T is the cell temperature in Kelvin (K),
Io is the reverse saturation current of diode (A),
q is the electron charge (1.602×10⁻¹⁹ C),
k is the Boltzmann‟s constant (1.381×10⁻²³ J/K).
3.
SIMULATION OF THE
PHOTOVOLTAIC SYSTEM
The photovoltaic system studied is composed of the PV panel, the MPPT control (IncCond), a dc-dc buck-boost converter, a PWM generator to control the chopper and a resistive load as shown in Figure 2.
Fig 2:photovoltaic system
The basic idea of the incremental conductance algorithm is that the slope of P-V curve becomes zero at the MPP, as shown in Figure 3. It is also possible to find a relative location of the operating point to the MPP by looking at the slopes. The slope is the derivative of the PV module‟s power with respect to its voltage and has the following relationships with the MPP [4, 7].
0
dV
dP
at MPP (2)
dV
dI
V
I
dV
dI
V
dV
dV
I
dV
I
V
d
dV
dP
(
.
)
.
.
(3)At MPP:
V
I
dV
dI
dV
dI
V
I
0
(4)If the operating point is at the left side of the MPP, the equation (2) becomes:
dV
dI
V
I
>0dV
dI
>V
I
(5)If the operating point is at the right side of the MPP, the equation (2) becomes:
dV
dI
V
I
<0dV
dI
<V
I
[image:2.595.320.542.158.273.2]
(6) [image:2.595.57.288.548.680.2]Figure 4 shows the P-V curve, at different irradiance and the constant module temperature.
Fig 4: P-V curves (25oC)
For a given temperature and irradiance, the photovoltaic panel will deliver a voltage Va and current Ia depends on the load. The MPPT control will search the values of Va and Ia, which correspond to the value of the maximum power. This gives the value of duty cycle that must be applied to power converter in order to control the stage adaptation for operation at maximum power.
4.
LOAD VOLTAGE CONTROL
In this part, a control system of the output voltage of the converter is proposed; as in the case of photovoltaic pumping systems, the DC motor must be powered by a constant voltage. The system includes a PV panel, a buck-boost converter with the MPPT control, a storage battery, a boost converter equipped with the control of the output voltage shown in Figure 5.
[image:3.595.328.526.348.425.2]In order to make a comparative study, we used two methods to control the output voltage. The first consisting of a PID controller, while the second method is based on the sliding mode controller SMC, in case of a resistive load and then of a centrifugal pump driven by a permanent magnet DC motor.
Fig 5: Block diagram of the photovoltaic system
4.1
Voltage control for a resistive load
4.1.1
Proportional, Integral & Derivative
Controller (PID)
In this case, we took a resistive load, R=100Ω. The reference voltage is 50V.
[image:3.595.357.496.522.593.2]Figure 6 shows the simulation results of the output voltage.
Fig 6: output voltage Vo (PID)
4.1.2
Sliding mode control (SMC)
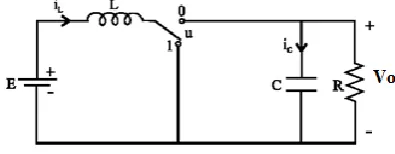
A basic DC-DC boost converter topology is shown in figure7.
Fig 7: Boost DC-DC converter
The mathematical model of boost converter can be deduced by applying Kirchhoff‟s laws. The model of boost converter in continuous conduction mode is [8, 9]:
L
V
u
L
E
dt
di
L o)
1
(
(7)
RC
V
C
i
u
dt
dV
o L o
(
1
)
(8)Where u is the switch state or the switch duty cycle in the case of average model, Vo and iL are respectively the output
voltage and the inductor current of the boost converter. In SMC, we usually determine u as following:
1 if S < 0 (9)
u =
0 if S > 0
0 5 10 15 20 25 30 35 40 45 50
0 20 40 60 80 100 120 140 160
incCond Method
Module Voltage (V)
M
o
d
u
le
O
u
tp
u
t
P
o
w
e
r
(W
)
1000W/m2
800W/m2
600W/m2
400W/m2
[image:3.595.57.295.550.626.2]Where S, designs the sliding surface.
Taking x1 = iL and x2 = Vo as the states of the systems and
using the state equations given in equations (7) and (8). The aim is to achieve a desired constant output voltage Voref. Thus,
x2 = Voref (10)
From the general sliding mode control theory, the state variable error, defined by the difference to the reference value, forms the sliding function:
S = x1 - x1ref = 0 (11)
This means that the control forces the system to evolve on the sliding surface.
In order to enforce sliding mode in the manifold S = 0, the corresponding control signal for the ideal switch in figure 7, is [12, 13]:
1
(
)
2
1
S
sign
[image:4.595.59.278.384.601.2]u
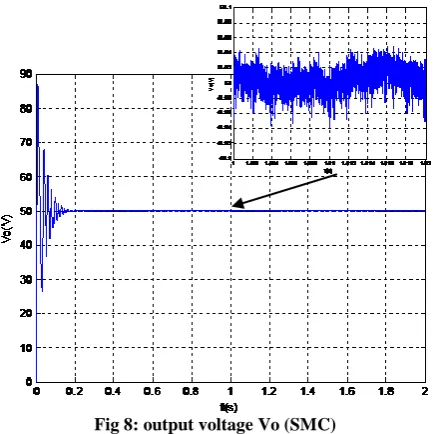
(12)Figure 8 shows the simulation results of the output voltage.
Fig 8: output voltage Vo (SMC)
According to the simulation results, the output voltage reaches the desired value after 0.2s for the regulation based on sliding mode control, and 0.03s using a PID controller. While for the oscillations peak to peak, the value reaches 0.1V for the sliding mode control and 0.5V for the method based on the PID controller.
4.2
Voltage control with a permanent
magnetic DC motor
In recent years, there has been rapid growth in the use of permanent magnet DC motor as a rotary machine for photovoltaic pump systems. Indeed, this type of motors has good performance and requires no maintenance. As well, the
centrifugal system has many advantages over other types of pumping: it guarantees a volume of reduced size, a relatively quiet service and easy implementation with all types of electric motors on the market. The pumping unit studied in our system will be composed of a permanent magnet DC motor and a centrifugal pump.
In this section, our goal is to replace the resistive load by a pump unit which consists on a PMDC motor and a centrifugal pump. This type of engine is not in the library of Simpower system of Matlab, for this we will precede with the modeling and simulation of the motor-pump.
Modeling of PMDC motor is performed with the basic equations of the current machine [10, 11].
.
.
.
a ea a a
a
K
dt
dI
L
I
R
V
(13)
a t
e
K
I
T
.
(14)
dt
d
J
T
T
e
l
(15)
Where:
ke: constant voltage. kt: constant of motor torque. Ia: the motor armature current.
Ra: resistance of armature circuit of the motor. Te: the electromagnetic torque of the engine. Tl: the load torque.
ω: the speed of motor shaft
J: the inertia moment.
Our goal is to build a model of a PMDC motor with two inputs (the load torque and the inertia moment), and three outputs (the electromagnetic torque, the speed and the current) as shown in the following figure.
Fig 9: Model of the PMDC motor
[image:4.595.365.490.620.717.2]The load torque of the centrifugal pump is expressed by:
Tl=Kr.ω2+Ts (16)
Where:
kr: coefficient of proportionality Ts: the static torque, very low.
In the following, we simulated the photovoltaic system in Figure 5 by replacing the resistive load by the pump unit studied previously.
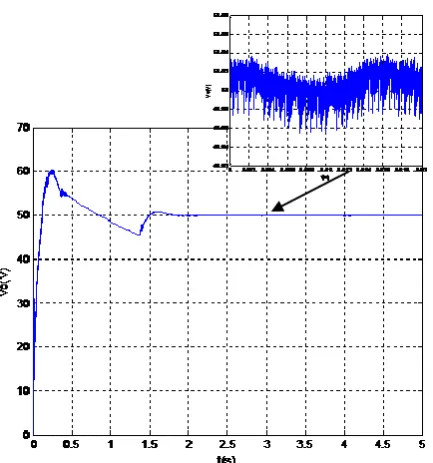
[image:5.595.58.278.278.744.2]The following figures represent the output voltage with the PID control (figure 10), and the SMC (figure 11). The reference voltage is always equal to 50V.
[image:5.595.56.277.286.469.2]Fig 10: output voltage Vo (PID)
Fig 11: output voltage Vo (SMC)
Simulations show that the output voltage reaches the value of the reference in 0.24s for the PID controller and 1.8s for the sliding mode controller. Concerning the peak to peak oscillations, the value is 0.16V for the PID controller and
0.5V for the sliding mode controller.
5.
CONCLUSION
In this work, voltage controls of a photovoltaic system with an application to a pumping system are proposed. In this study, the Photovoltaic PV module is described: in a first step, the modelling of the solar cell is presented. The non linear behaviour of the PV and its sensitivity to external conditions such as light and temperature induce energy losses. In the goal to reduce these losses, it is required to operate at the maximum power: this is the role of the MPPT technique. In the literature there are many kinds of algorithms to achieve the tracking of the MPP. In this paper we have presented IncCond algorithms. A study, in simulation in Matlab-simulink environment of the MPPT with resistive load has been made to illustrate the tracking of the MPP.
In the last part of this work, the controls of the output voltage of the PV system are studied. To make a comparative study, two methods of control of the output voltage are presented. The first is to use a PID controller, while in the second a Sliding Mode Controller-SMC is used. The study is done for a resistive load and then for a permanent magnet DC motor. The simulation results show that the second method is more effective on the oscillations of the voltage, but it presents a delay to reach the steady state compared to the first method. Using these two methods, we can clearly conclude that the value of the output voltage follows the reference value which is initially imposed.
6.
ACKNOWLEDGMENTS
We thank the ministry of high education and scientific research of Tunisia for funding this work.
7.
REFERENCES
[1] Jawad Ahmad, and Hee-Jun Kim “A Voltage Based Maximum Power Point Tracker for Low Power and Low Cost Photovoltaic Applications” World Academy of Science, Engineering and Technology 60 2009.
[2] Francisco M. Gonzalez-Longatt “Model of photovoltaic module in matlab” (II CIBELEC 2005)
[3] J.M. Enrique a, E. Duran, M. Sidrach-de-Cardona b, J.M. Andujar « Theoretical assessment of the maximum power point tracking efficiency of photovoltaic facilities with different converter topologies.» Solar Energy 81 (2007) 31–38
[4] Akihiro Oi, “Design and simulation of photovoltaic water pumping system” Master of Science in Electrical Engineering, Faculty of California Polytechnic State University.
[5] N. Chandrasekaran and K. Thyagarajah « Modeling, Analysis and Simulation of Pumping System Fed by PV Generator.» European Journal of Scientific Research ISSN 1450-216X Vol.53 No.2 (2011), pp.231-238. [6] Walker, Geoff R. “Evaluating MPPT converter
[image:5.595.62.279.505.737.2][7] Huan-Liang Tsai, Ci-Siang Tu, and Yi-Jie Su« Development of Generalized Photovoltaic Model Using MATLAB/SIMULINK.» WCECS 2008, October 22 - 24, 2008, San Francisco, USA.
[8] Hanifi Guldemir “ Sliding mode control of DC-DC boost converter”
Journal of applied sciences 5(3): 588-592, 2005 ISSN 1812-5654
[9] Sumita Dhali, P.Nageshwara Rao, Praveen Mande, K.Venkateswara Rao “PWM-Based Sliding Mode Controller for DC-DC Boost Converter” (IJERA) ISSN: 2248-9622 ; Vol. 2, Issue 1,Jan-Feb 2012, pp.618-623
[10]B.Chitti Babu, R. Sudharshan Kaarthik, Nayan Kumar Dalei, R.Vigneshwaran, Rabi Narayan Das « Photovoltaic Energy Conversion System for Water Pumping Applications – Modeling and Simulation.» International Symposium on Photovoltaic Science and Technology, Kanpur, 13 January 2010.