Improved Combination of LBP plus LFDA for Facial
Expression Recognition using SRC
Ritesh Bora
Research Scholar, CSE Department, Government College of Engineering, Aurangabad
Vrishali A. Chakkarwar
Assistant Professor, CSE Department, Government College of Engineering, Aurangabad
ABSTRACT
Human facial expression is one of the most powerful, natural and immediate means for communication between each other. Automatic human facial expression recognition is challenging, interesting problem in many areas such as human computer interaction and data driven animation etc. In this paper, Facial expression based on Local Binary Pattern (LBP) is evaluated, “curse of dimensionality” for real world scenarios problem solved by dimensionality reduction using Local Fisher Discriminant Analysis (LFDA) and Sparse representation classifier (SRC) used for efficient facial expression classification. The experiment is performed in both person-independent and person-dependent facial expression recognition cases, on Japanese Female Facial Expression (JAFFE) and observed that LBP features perform stably and robustly over useful range of low resolutions of face images (150 by 110 pixel and 64 by 64 pixel size) . Proposed method shows better result than traditional algorithms such as Principal Component Analysis (PCA), Linear Discriminant Analysis (LDA) and LBP+SRC solely.
General Terms
Pattern recognition, Image processing, Biometric
Keywords
Facial expression recognition, Local Binary Pattern, Local Fisher Discriminant Analysis, Sparse representation classifier
1.
INTRODUCTION
In person-person communication, articulation and perception of facial expressions form a communication channel in addition to voice, which carries important information about mental, emotional and even physical state of person. In recent years, numerous algorithms for facial expression analysis from static images have been proposed [3-5], which are quite different in facial features. Recognizing facial expression with a high accuracy remains to be difficult, due to the complexity and variety of facial expressions.
Basic facial expressions like Anger, Disgust, Fear, Happy, Neutral, Sad and Surpriseare accurately recognized by using proposed method. Automatic facial expression recognition involves two important aspects: facial feature representation and classifier design. A set of features from original face images with minimum between class variations is to derive in facial feature representation. In general, three types of information present in facial features: texture information [6, 7, 8] shape information and combination of texture and shape information [9]. There are two basic types of approaches to extract facial features: geometric feature-based methods and appearance–based methods [10]. Geometric feature-based methods extract features from several facial feature points, which should be located correctly, these are often manually marked points. Gabor-wavelet appearance features were
demonstrated to be more effective than geometric features [11] and work better in real world environments [12]. Although Gabor-wavelet representations have been widely adopted, it is computationally expensive to convolve face images with multi-bank of Gabor filters in order to extract multi scale and orientational coefficients.
Local Binary Patterns (LBP) as novel low-cost discriminative features is introduced for facial expression recognition in this paper. Originally LBP was proposed for texture analysis [13, 14]; recently Ahonen et al [15, 16] presented LBP based methods for face detection and recognition. Face images can be described as composition of micro patterns, which can be described by LBP. A facial image is divided into a set of small regions from which LBP histograms are extracted after face image preprocessing step and concatenated into a single, spatially enhanced feature histogram called high dimensional feature vector could describe face efficiently for expression recognition. The most important property of LBP features is their tolerance against illumination changes and their computational simplicity. LBP features represented by a set of high dimensional vector, curse of dimensionality emerges and need to be remove irreverent feature data, as a preprocessing step to a classifier, is needed. To solve curse of dimensionality problem one necessary way is to perform dimensionality reduction & generating few new features containing most of the valuable facial expression information. The two traditional dimensionality reduction methods are PCA and LDA. However, these two methods i.e. PCA and LDA, still have their respective inherent drawbacks, resulting in decreasing performance on facial expression recognition tasks to some extent. In detail, PCA as unsupervised learning method fails to extract the discriminative embedded information from high dimensional data. In contrast, LDA is a supervised learning method, but still has essential limitations i.e. the maximum of embedded features by LDA must be less than the number of data classes due to the rank deficiency of the between-class scatter matrix [17].
The rest of paper is organized as follows: Feature extraction method i.e. LBP is given in section 2.Dimensionality reduction methods such as PCA, LDA and LFDA described in section 3. Sparse representation based classification stated in section 4. The popular facial expression database (JAFFE) and experimental results, analysis shown in section 5. Finally, the conclusions are given in section 6.
2.
FEATURE EXTRACTION METHOD –
LOCAL BINARY PATTERN
[image:2.595.64.274.315.354.2]The original local binary patterns (LBP) [14] operator takes a local neighborhood around each pixel, thresholds the pixels of the neighborhood at the value of the central pixel and uses the resulting binary valued image patch as a local image descriptor. It was originally defined for 3×3 neighborhoods, giving 8 bit codes based on the 8 pixels around the central one. The operator labels the pixels of an image by thresholding a 3×3 neighborhood of each pixel with the center value and considering the results as a binary number and the 256-bin histogram of the LBP labels computed over a region is used as a texture descriptor. Fig 1 gives an example of the basic LBP operator.
Fig 1: An example of basic LBP operator.
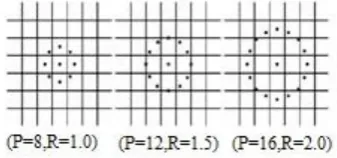
The limitation of the basic LBP operator is that its small 3×3 neighborhood cannot capture the dominant features with large-scale structures. As a result, to deal with the texture at different scales, the operator was later extended to use neighborhoods of different sizes [14]. Fig 2 gives an example of the extended LBP operator, where the notation (P, R) denotes a neighborhood of P equally spaced sampling points on a circle of radius of R that form a circularly symmetric neighbor set. The second defined so-called uniform patterns: an LBP is ‘uniform’ if it contains at most two 0-1 and one 1-0 transitions when viewed as a circular bit string. For instance, 00000000, 001110000 and 11100001 are uniform patterns. It is observed that uniform patterns account for nearly 90% of all patterns in the (8, 1) neighborhood and for about 70% in the (16, 2) neighborhood in texture images. Accumulating the patterns which have more than 2 transitions into a single bin yields an LBP operator, , with less than bins. Here, the superscript u2 in indicates using only uniform
[image:2.595.80.249.608.687.2]patterns and labeling all remaining patterns with a single label.
Fig 2: An extended LBP operator with different (P, R).
After labeling an image with the LBP operator, a histogram of the labeled image f1(x, y) can be defined as
H1 =
(1)
Where n is the number of different labels produced by the LBP operator and
(2) This LBP histogram contains information about the distribution of the local micro-patterns, such as edges, spots and flat areas over the whole image, so can be used to statistically describe image characteristics. For efficient face representation, face images were equally divided into m small regions R1, R2,…, Rm. Once the m small regions R1, R2,…, Rm
are determined, a histogram is computed independently within each of the m small regions. The resulting m histograms are concatenated into a single, spatially enhanced histogram, which encodes both the appearance and the spatial relations of facial regions. In this spatially enhanced histogram, Face image is described on three different levels of locality: the labels for the histogram contain information about the patterns on a pixel-level, the labels are summed over a small region to produce information on a regional level and the regional histograms are concatenated to build a global description of the face image called High dimensional feature vector shown in fig 3
.
Fig 3: High Dimensional LBP feature vector.
3.
DIMENSIONALITY REDUCTION
METHODS – PCA, LDA AND LFDA
The general dimensionality reduction problem is as follows. Given n data points {x1,x2,..,xn} with dimension D,
dimensionality reduction techniques transform data set X= {x1,x2,..,xn} into a new data set Y = {y1,y2,...,yn} with
dimension d (d <= D), while retaining the geometry of the data as much as possible. In the following sub section, we will review PCA, LDA and LFDA in brief.
3.1
PRINCIPAL COMPONENT
ANALYSIS (PCA)
Principal component analysis (PCA) [21] is a well-known and widely used linear dimensionality reduction technique. PCA aims to produce a low dimensional representation of high dimensional data that preserves the greatest sources of variation within the data set. This is achieved by performing a linear transformation of the data, projecting it onto the axes of greatest variance called the principal components. The resulting low dimensional features are uncorrelated and ordered such that the greatest variance by any projection of the data set is accounted for by the first dimension, the second greatest variance by the second dimension, and so on.
In order to find a linear mapping M, PCA maximizes the following objective function:
JF=trace (MT cov(X)M) (3)
Where cov(X) is the sample covariance matrix of the data X= {x1,x2,..,xn} Then, PCA solves the following Eigen problem :
Cov(X)=λM (4)
representations are computed by Y=XM. Here Xis assumed to be centered i.e. have zero mean. In face recognition, xi
represents a face image and the eigenvectors are called Eigen faces.
3.2
LINEAR DISCRIMINANT
ANALYSIS (LDA)
Linear discriminant analysis (LDA) [17] is to seek the discriminant vectors such that the ratio of the between-class
scatter to the within-class scatter is maximized. Let xi ε ℛD be
D-dimensional sample and li ε {1,2,…,c} be associated class
labels, where n is the number of samples and c is the number
of classes. Let yi ε ℛd (1≤d≤D) be the low dimensional data
representation of a sample xi, where d is the dimension of the
embedding space. Then between-class scatter matrix Sb and
the within-class scatter matrix Sw are constructed as follows:
Sb = Ii(mi-m0)(mi-m0)T (5)
Sw = (xi (j)
-mi)(xi (j)
-mi) T
(6)
Where xi (j)
is the jth sample of class I (i=1,2,…,c), mi is the
mean vector of the samples in class I and m0 is the mean
vector of all samples. The LDA method tries to find the projected matrix that maximizes the ratio of the between-class scatter matrix to the within-class scatter matrix in the projected space:
JF(V) = max
(7)
Where V can be obtained via the generalized Eigen value problem:
SbV= λSwV (8)
Where the Eigen vectors V corresponds to the d largest Eigen values λ. Then d-dimensional representation is Y=XV. Since the between-class scatter matrix Sb has at most rank c-1,LDA
can find at most c-1 meaningful features. This is an essential limitation of LDA for dimensionality reduction.
3.3
LOCAL FISHER DISCRIMINANT
ANALYSIS (LFDA)
Local Fisher Discriminant Analysis ( LFDA ) [18]. The local within-class scatter matrix
and the local between-class scatter matrix
as follows:
=
(xi-xj)(xi-xj)T (9)
=
(xi-xj)(xi-xj)T (10)
Where
Where Ai,j is a affinity matrix between xi and xj. Using the
local scaling heuristic, A is defined as
Ai,j = exp(-||xi-xj|| 2
/ σiσj) (11)
Where σi is the local scaling around xi and defined by σi =||xi -
xi(k)|| , and xi(k) is the kth nearest neighbor of xi. A heuristic
choice of k=7 has shown to be the best performance. The LFDA transformation matrix TLFDA is defines as
TLFDA
ε [tr((TT T)-1TT T)] (12)
That is LFDA seeks a transformation matrix T such that nearby data pairs in the same class are made close and the data pairs in different classes are separated from each other, far apart data parts in the same class not imposed to be close.
4.
SPARSE REPRESENTATION BASED
CLASSIFICATION
The original goal of Sparse Representation algorithm was not for classification itself, but rather for representation or compression of signals. Sparse representation of signals potentially uses much lower sampling rates than the Shannon-Nyquist bound. The Sparse representation theory has shown that sparse signals can be exactly reconstructed from a small number of linear measurements [22, 23]. Therefore, the algorithm performance was measured in terms of sparsity of the representation and fidelity to the original signals. In SRC the measurements are the training samples themselves. Given n training samples: v1,v2,….,vn .The matrix A= [v1,v2,….,vn] ε
ℝm*n
can be constructed, test sample y ε ℝm can be linearly represented by all training samples as
y=Ax ε ℝm
(13)
The equation y =Ax is usually over-determined. The minimum l0– norm solution is chosen to find sparest solution :
x0= argmin ||x||0 subject to Ax=y (14)
where ||x|| is l0 –norm of x. if m>n, however, the problem of finding the solution of (14) is NP-hard equation, Donoho [24] and some other scholars [25] proved that if the solution x0 is
sparse enough, the solution of the l0–minimization problem (14) is equivalent to the following l1–minimization problem.
= arg min ||x||I subject to Ax=y (15)
If the solution is sparse and has l nonzero entries , it can be efficiently solved by homotopy algorithms in O(t3 + n) time, linear in the size of the training set [27].In case of dealing data with noise , the sparse representation model (13) can be modified to account for small possibly dense noise by writing
y=Ax+z (16)
Where z ε ℝm is a noise factor with bounded energy ||z||2 .
The sparse x can still be approximately recovered by solving the following stable l1-minimization problem:
(l1s): = arg min ||x||I subject to ||Ax-y|| (17)
This convex optimization problem can be solved via second – order cone programming [26]. The solution of (l1s) is
guaranteed to approximately recovery sparse solutions in ensembles of random matrices A. Given a test sample y from one of the classes in the training set, sparse representation via (15) or (17) is calculated. The non zero entries in the estimate will all be associated with the columns of A from a single object class I and then test sample y to that class is assigned. However, noise and modeling error may lead to small nonzero entries associated with multiple object classes. In this case, we instead classify y based on how well the coefficients associated with all training samples of each object reproduce y.
For each class I , let ɗi : ℝn ℝn be the characteristics
class. For xi ε ℝ n , ɗ
i(x) ε ℝ n
is a new vector only whose non zero entries are the entries in x that are associated with class i.
Using only the coefficients associated with the ith class, one
can approximate given test sample y as = Aɗi( ) . then
classify y based on these approximations by assigning it to the object class that minimizes the residual between y and :
ri(y) = ||y - Aɗi(x1)||2 (18)
5.
EXPERIMENT AND RESULT
ANALYSIS
The experiment of the proposed algorithm on facial expression recognition is carried out on JAFFE database. The database contains 213 images in which ten persons expressing three times per expression (Anger, Disgust, Fear, Happy, Neutral, Sad and Surprise). We select total 70 images (one image per expression of person) for person independent facial expression recognition and 210 images (three images per expression) for person dependent facial expression recognition. Some of the samples of JAFFE images after preprocessing are shown in fig 4 below.
Fig 4: Samples of JAFFE images after preprocessing.
The cropped facial images of 110×150 pixels contain facial main components such as mouth, eyes, brows and noses. For simplicity, we applied LBP operator to the whole region of the cropped facial images. As done in [28,29], we selected the 59-bin operator and divided the 110×150 pixels face images into 18×21 pixels regions, giving a good trade-off between recognition performance and feature vector length. Thus face images were divided into 42 (6×7) regions, and represented by the LBP histograms with the length of 2478 (59×42). The reduced feature dimension is limited to the range [2-20].SRC is used for multi-class classification problem. All extracted LBP features were normalized by a mapping to [0, 1] before anything else.
To testify the performance of LFDA, JAFFE database is used to perform two types of facial expression recognition experiments: person dependent experiments and person-independent experiments. For person-dependent experiments, the training data and testing data have the same person with different images. A more challenging application is to create a person-independent facial expression recognition system since the facial expression recognition system in real-world sceneries should be work for recognizing new person’s expressions. Therefore, for person independent experiments, each person only lies in either training data or testing data so that the persons in training data are guaranteed to be independent to the persons in testing data.
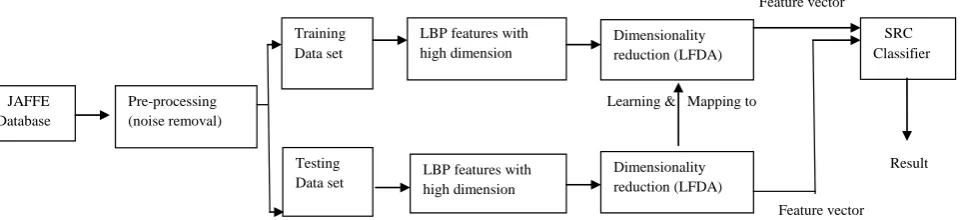
[image:4.595.68.270.304.345.2]In order to clarify the scheme of how to employ dimensionality reduction techniques like LFDA on facial expression recognition tasks, fig 5 shows the basic structure of a facial expression recognition system based on dimensionality reduction techniques. As shown in fig 5, system consists of three main components: feature extraction, feature dimensionality reduction and facial expression recognition. In the feature extraction stage, the original facial images from the JAFFE facial expression database are divided into two parts: training data and testing data. The corresponding LBP features for training data and testing data are extracted. The result of this stage is the extracted facial feature data represented by a set of high dimensional LBP features. The second stage aims at reducing the size of LBP features and generating the new low dimensional embedded features with dimensionality reduction techniques, such as LFDA. In order to map testing data, the low dimensional training data must be known and simply out-of sample extension of dimensionality reduction method by multiplying testing data by Eigen vector of training data is performed. The last stage in this system is in the low dimensional embedded feature space the trained SRC classifier is used to predict the accurate facial expression categories on testing data and the recognition results are given.
Fig 5: Proposed method uses above algorithm flow.
5.1
PERSON DEPENDENT
To evaluate the performance of algorithm for person-dependent facial expression recognition on the JAFFE database, a 10-fold stratified cross validation scheme was performed for facial expression recognition experiments and the average recognition results were reported. In 10-fold cross validation, the original samples are randomly partitioned into ten subsets. Out of ten subsets, one subset is retained as the
validation data for testing the model and the remaining nine subsets are used as training data. This process is then repeated ten times, with each of the ten subsets used exactly once as he validation data. Facial expression recognition using LFDA achieve accuracy of 90% with 20 reduced features as shown in fig 6.
Five expressions i.e. anger, disgust, happy, neutral and surprise are classified with >= 90% accuracy, while other two
JAFFE Database
Training Data set
Testing Data set
LBP features with high dimension
LBP features with high dimension Pre-processing
(noise removal)
Dimensionality reduction (LFDA)
Dimensionality reduction (LFDA)
SRC Classifier
Learning & Mapping to
Result Feature vector
[image:4.595.64.545.520.630.2]expressions sad and fear are discriminated with relatively low accuracy (< 90%) is observed from Table1
[image:5.595.184.402.82.267.2].
Fig 6: person-dependent recognition result
Table1: Confusion matrix of 7-class facial expression obtained by LFDA in person-dependent case.
Anger
(%)
Disgust
(%)
Fear
(%)
Happy
(%)
Neutral
(%)
Sad
(%)
Surprise
(%)
Anger 100 0 0 0 0 0 0
Disgust 0 100 0 0 0 0 0
Fear 0 0 70 0 10 0 20
Happy 0 0 0 90 0 0 10
Neutral 0 0 0 0 100 0 0
Sad 0 0 0 0 10 80 10
Surprise 0 0 0 0 10 0 90
5.2
PERSON INDEPENDENT
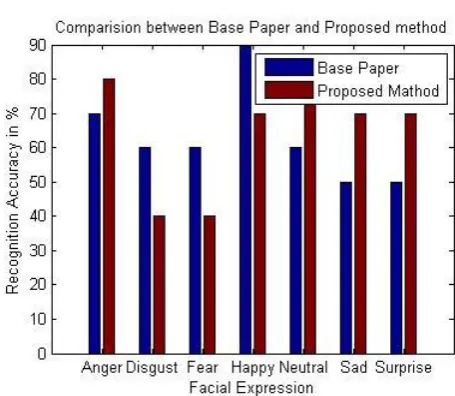
To evaluate the performance of algorithm for person-independent facial expression recognition on the JAFFE database, we firstly split the whole 213 facial images into ten groups according to the person in JAFFE database, with each group including all the seven expressions of one distinct person. Then the so-called leave-one-person out cross validation strategy is used in the experiments i.e. each time facial expression images of one person are used for testing and all the images of the remaining persons are used for training. Repeat the process for each person. The average is the final recognition rate. Fig 7 gives comparison between person independent recognition results of LBP+SRC and our proposed method.
From fig 7 and Table2, it is observed that our proposed method (LBP+LFDA+SRC) gives better than LBP+SRC method. LFDA gives better accuracy of 64.28% with 13 reduced features.
[image:5.595.320.548.456.654.2]Fig 8: person-independent recognition result.
Table2 presents the confusion matrix of 7-class expression recognition results in person-independent case using LFDA to obtain the best performance. As shown in Table2, neutral and anger are identified with an accuracy of 80%, whereas the other five expressions are classified with less than 80% accuracy.
Comparison between person-independent recognition results in fig 8 and person-dependent recognition results in fig 6, it is observed that the recognition accuracy in person independent case are much lower than the recognition accuracy in person-dependent case. More precisely, best accuracy of about 90% for person-dependent facial expression recognition, while about 65% for person-independent facial expression recognition can be achieved.
The results of about 65% accuracy in person-independent case are reasonable since human beings themselves normally can only recognize expressions with an accuracy of about 60% [30].
Table2: Confusion matrix of 7-class facial expression obtained by LFDA in person-independent case.
Anger
(%)
Disgust
(%)
Fear
(%)
Happy
(%)
Neutral
(%)
Sad
(%)
Surprise
(%)
Anger 80 0 0 0 10 10 0
Disgust 0 40 30 0 10 20 0
Fear 10 10 40 0 10 10 20
Happy 0 0 0 70 10 0 20
Neutral 0 0 0 0 80 0 20
Sad 0 0 0 0 30 70 0
Surprise 0 0 10 0 20 0 70
6.
CONCLUSION
Facial expression recognition has importance in many areas including medical science and psychology for identification of patient’s mental state. One of the crucial stage in this system is feature extraction which extracts low dimensional features before fed to sparse based classification.
In this paper a innovative method of facial expression recognition based on LBP and LFDA is presented. The experiment results on the popular JAFFE facial expression database indicate that LFDA performs better result than traditional methods (PCA, LDA), Local Binary Pattern and obtained 64.28 % accuracy in person independent case and 90% accuracy in person dependent case.
In the future, it’s an interesting task to employ proposed method to build a real time facial expression recognition system for natural human computer interaction.
7.
ACKNOWLEDGMENT
I thank to Asst. Prof. Vrishali. A. Chakkarwar, Assistant Professor, Computer Science & Engineering Department, Government College of Engineering, [Autonomous], Aurangabad, for her constant support and helping out with the preparation of this paper.
8.
REFERENCES
[1] Ming-wei Huang, Zhe-wei Wang and Zi-Lu Ying, “A New Method For Facial Expression Recognition Based On Sparse Representation Plus LBP”, 3rd International Congress on image and Signal Processing, 2010, pp.1750-1754.
[2]Shiqing Zhang, Xiaoming Zhao and Bicheng Lei, “Facial Expression Recognition based on Local Binary Patterns and Local Fisher Discriminant Analysis”, WSEAS Transactions on Signal Processing, 2012, issue 1, vol. 8, pp.21-30.
[3] M. Pantic and L. Rothkrantz, “Automatic Analysis of Facial Expressions: The State of the Art”, IEEE Trans. on Pattern Analysis and Machine Intelligence, Vol. 22, 2000, pp. 1424-1445.
[4] B. Fasel and J. Luettin, “Automatic Facial Expression Analysis: A Survey”, Pattern Recognition, Vol.36, 2003, pp. 259-275.
[6] M. Lyons, J. Budynek, and S. Akamastu, “Automatic Classification of Single Facial Images”, IEEE Trans. Pattern Analysis and Machine Intelligence, Vol.21, 1999, pp.1357-1362.
[7] Y. Shinohara and N. Otsu, “Facial Expression Recognition Using Fisher Weight Maps ”, IEEE Conf. on Automatic Face and Gesture Recognition, 2004, pp. 499-504.
[8] W. Zheng, X.Zhou, C. Zou and L. Zhao, “Facial expression recognition using kernel canonical correlation analysis (KCCA)”, IEEE Trans. on Neural Networks, Vol.17, 2006, pp. 233-238.
[9] Z. Zhang, M. Lyons, M. Schuster, and S. Akamatsu, “Comparison Between Geometry based and Gabor-Wavelet-based Facial Expression Recognition Using Multi-layer Perception”, Proc. 3rd Int. Conf. Automatic Face and Gesture Recognition, 1998, pp. 454-459.
[10] Y. Tian, T. Kanade and J Cohn, “Facial expression analysis, Handbook of face recognition”, Springer, October 2003.
[11] Z. Zhang, M. J. Lyons, M. Schuster, and S. Akamatsu. “Comparison between geometry-based and Gabor-wavelets-based facial expression recognition using multi-layer perception”, IEEE FG, April 1998.
[12] Y. Tian, “Evaluation of face resolution for expression analysis”,IEEE Workshop on Face Processing in Video, 2004.
[13] T. Ojala, M Pietikinen, and D. Harwood, “A comparative study of texture measures with classification based on featured distribution, Pattern Recognition”, vol.29,No.1, 1996.
[14] T Ojala, M Pietik inen, and T M Enp, “Multi resolution gray scale and rotation invariant texture analysis with local binary patterns, IEEE Transactions on Pattern Analysis and Machine Intelligence”, Vol. 24, No.7, 2002, pp.971-987
[15] T. Ahonen, A. Hadid, and M. Pietikinen, “Face recognition with local binary patterns”, ECCV, 2004, pp. 469-481.
[16] A. Hadid, M. Pietikinen, and T. Ahonen, . ”A discriminative feature space for detecting and recognizing faces”,IEEE CVPR, June 2004, pp. 797-804.
[17] P N Belhumeur, J P Hespanha, and D J Kriegman, “Eigen faces vs. fisher faces: Recognition using class specific linear projection”, IEEE Transactions on Pattern Analysis and Machine Intelligence, Vol. 19, No.7, 1997, pp.711-720.
[18] M Sugiyama, T Idé, S Nakajima and et al., “Semi-supervised local Fisher discriminant analysis for dimensionality reduction”, Machine learning, Vol.78, No.1, 2010, pp.35-61.
[19] X He, and P Niyogi, “Locality preserving projections, Advances in neural information processing systems (NIPS)”, MIT Press, 2003.
[20] Wright. J, Yang. A.Y, Ganesh. A, Sastry. S.S, and Ma.Y, “Robust Face Recognition via Sparse Representation” , IEEE Transactions on Pattern Analysis and Machine Intelligence, Vol.31, No.2, pp.210-227, Feb.2009.
[21] M A Turk, and A P Pentland, “Face recognition using Eigen faces”, Proc. IEEE Conference on Computer Vision and Pattern Recognition, 1991, pp.586-591.
[22] Candes. E.J, “Compressive sampling”, International Congress of Mathematicians, Aug. 2006.
[23] Candes. E.J, Romberg. J, and Tao.T, “Robust uncertainty principles: Exact signal reconstruction from highly incomplete frequency information”, IEEE Transactions on Information Theory, Vol.52, No. 2, pp.489-509, Feb. 2006.
[24] Donoho. D.L, “For Most Large Underdetermined Systems of Linear Equations the Minimal 11 -Norm Solution Is Also the Sparest Solution”, Communication on Pure and Applied math, Vol.59, No.6, pp.797-829, May.2006.
[25] Candes. E.J, and Tao. T, “Near-Optimal Signal Recovery from Random Projections: Universal Encoding Strategies”, IEEE Transaction on Information Theory, Vol.52, No.12, pp. 5406-5426,Dec. 2006.
[26] S. Chen, D. Donoho and M. Saunders, “Atomic Decomposition by Basis Pursuit,” SIAM Rev., Vol.43, No.1, pp.129-159, 2001.
[27] Donoho. D.L, and Tsaig. Y, “Fast Solution of l1 -Norm
Minimization Problems, When the Solution May Be Sparse”, http://www.stanford.edu/tsaig/research.html.
[28] C Shan, S Gong, and P McOwan, “Robust facial expression recognition using local binary patterns”, Proc. IEEE International Conference on Image Processing, 2005, pp.370-373.
[29] C Shan, S Gong, and P McOwan, “Facial expression recognition based on Local Binary Patterns: A comprehensive study, Image and Vision Computing”, Vol.27, No.6, 2009, pp.803-816.