Autonomous In-situ Raman Sensor, Suitable for Surface
Enhanced Raman Spectroscopy (SERS) for Detection of
Chemicals in the Sea
Anna Kolomijeca
1,*, Francois Roland
2, Pierre Leon
2, Heinz-Detlef Kronfeldt
11Intitut of Optics and Atomic Physics, Technical University, Berlin, 10623 Germany
2Electric and Electronic Systems, IFREMER, Centre Méditerranée - Zone Portuaire de Brégaillon, CS20 330 – 83507 La Seyne-sur-Mer
Cedex, France
*Corresponding Author: [email protected]
Copyright © 2013 Horizon Research Publishing All rights reserved.
Abstract
An autonomous in-situ Raman/SERS sensorfor the detection of chemicals in seawater has been constructed and successfully tested in the harbor and offshore under harsh field conditions, during October - January 2012-2013. Applying integration time of typically only 10 s, the sensor was able to detect various PAHs in situ, such as fuoranthene, biphenyl, phenanthrene and fluorine in the Mediterranean Sea.
Keywords
Sea Water Sensor, PAHs, AutonomousSensor, In Situ Raman, SERS
1. Introduction
Laser Raman spectroscopy is known as noninvasive, fast analysis optical technique, suitable for identification and quantification of substances. But due to extremely small cross section of the effect (around 10-30 cm2 to 10-25 cm2) [1], it has been applied mostly for measurements of pure or solid samples, e.g, meat - measured with specially designed laser pistol [2]; minerals [3] – laboratory measurements; or hydrothermal vents, measured with Raman spectrometer which is installed into ROV Tiburon [4].
In case of lower concentration of target molecules (in our case pollutants) in the sample, Surface Enhanced Raman Spectroscopy (SERS) must be applied, which enhance the Raman signal in the order of 107[5]. Such enhancements of the Raman signals allow measurements of chemicals, dissolved in the seawater.
The aim of the current work is to develop a Raman/SERS sensor for the detection of pollution in the sea. PAHs are chosen as target molecules, as priority substances in the field of water policy [6], due to toxic effect to the marine environment [7, 8]. Similar studies have been performed by Peron in South Brittany coastal waters [9], and Pfannkuche in the Golf of Gdansk [10]. Complex ROV systems with a
cable connection for data transmission and power supply from the ship have been created.
It was necessary to simplify the design of the Raman/SERS sensor, minimizing all components in order to avoid direct cable connections and make it work in a fully autonomous regime.
Prior to construction of the sensor, on-board pilot studies for testing Raman/SERS equipment has been performed in the Arctic area [11, 12].
2. Materials and Methods
A fully autonomous sea going instrument, which can be submersed in the water without any power and telemetry cables from a research vessel has been constructed in the Technical University Berlin. The final assembly of the sensor as well as tube leakage tests and in situ experiments were done in the IFREMER Center in La Seyne sur Mer, France.
2.1. Raman/SERS Sensor for Field Experiments
The scheme of sea going instrument is presented in figure 1. It contains four main parts: (1) Two1 laser drivers (Pilot PC500 OEM, Sacher Lasertechnik) are set to control temperature and injection current of the microsystem laser diode (2), with excitation wavelength of 671 nm [2], suitable for SERS measurements. The excitation beam passes through a bandpass filter (Semrock), Raman edge filter (Semrock) and is focused by a lens (focal length of 10 mm) through quartz window into the SERS substrate, which is in direct contact with the sea water. All optics, e.g. lenses, filters, mirrors are fixed in the self-developed optode (diameter of 25 mm, length of 180 mm) [2, 13].
The backscattered light from the SERS surfaces is
1 For the future implementation of SERDS (shifter excitation Raman difference spectroscopy)
collected by the same lens and filtered by the Raman edge filter (blocks the Rayleigh and anti-Stokes signals).
The collected Stokes signal is further focused by a lens (focal length of 16 mm) into 100 μm optical fiber which deliver signal to custom-designed miniature spectrometer (3) (Horiba Scientific, dimension of 200 x 190 x 70 mm3, resolution of 8 cm-1) and detected by a CCD camera (Hamamatsu, 1024 x 58 pixels, cooled thermoelectrically down to -8 °C). The spectra are recorded by a microcomputer (4) (Acer Aspire Revo R3700).
All electrical parts, connections and terminations have been wired to industry standard. Two small junction boxes (IP55 rated) (a) switch power On/Off to the laser drivers,
computer and spectrometer. The main electrical connection box (4 pole/10 A, Industrial Cam Switches) (b) controls the mains supply by a 3-position changeover switch. This is designed for 12 V DC (in situ) and 220 V AC (in laboratory). The power to all components is ensured by a 12 V DC 60 A Lithium Ion Battery (Lithionics, weight 13 kg) (c), which is fully secured inside the sensor housing by specially designed plastic holders to prevent movement of the battery inside the tube, which also serves as comfortable grip to remove the battery.
[image:2.595.107.509.243.453.2]During constant running conditions, the sensor requires 2.75 A total running current; this gives a total usage of 22 h from each charge.
Figure 1. Scheme of developed Raman/SERS sensor 1. Laser driver; 2. Microsystem Laser diode 671 nm and optode (BF bandpass filter; EF Raman Edge Filter, M mirror, L lens); 3.Spectrometer with CCD camera; 4. Computer; -a. Junction boxes; -b. Electric box; -c. Battery
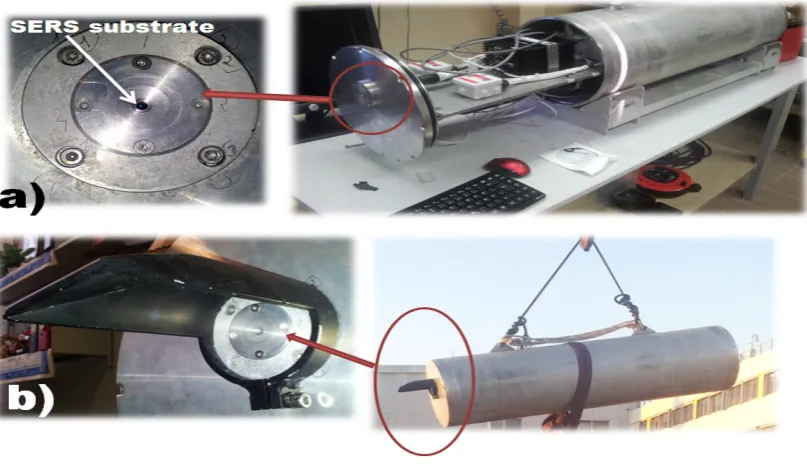
[image:2.595.105.509.493.725.2]Complete Raman/SERS sensor is presented in figure 2. As we can see, the plate with all components is fixed inside the tube, which is made from aluminum with a wall thickness of 1 cm. The calculated water depth for making the measurements is 100 m. But because oily pollutants that we are interested to measure can be expected in the surface area of the water, the experiments are performed up to 2 m depth. The front part of the tube is designed especially for SERS measurements (see figure 2 a), and a SERS substrate can be fixed between two plates in the outside part of the optode. In order to protect measurements from direct sunlight, an additional roof part was fixed on the top of laser optical path (figure 2 b).
The complete Raman/SERS sensor has a length of 107.4 cm, diameter of 32 cm, volume of 0.086 m3 and a weight of 70 kg, plus a minimum of 40 kg additional weight shall be added to give neutral buoyancy in water.
The computer screen is attached on land for setting the parameters of the program and must be removed prior to closing the tube.
2.2. Area of experiment
Experimental studies were carried out in France from 01.10.2012 until 07.01.2013, in the Mediterranean Sea, The area of measurements:
Harbor: Mediterranean Sea (La Seyne-sur-Mer, France: N 43.1054 and E 5.8856)
Off shore: Mediterranean Sea (Station I: N 43.0052; E 5.0571; Station II (Tamaris Le Lazaret muscle farm): N 43.0053; E 5.0544)
2.3. SERS substrates and sensor calibration
Gold island substrates were prepared by electrolyses plating method using a mixture of solution from HAuCl4 and H2O2. This method allows gold nano particles aggregate on the surface of the substrates, which leads to Raman signal amplification. Gold island substrates are proven to have LODs (limit of detection) in the nMol range for the selected PAHs. For a detailed preparation procedure and LOD calculation see [14].
For the calibration: before each experiment, polystyrene material was measured with conventional Raman for 5 s. Raman signals from the measurement were later transferred from a particular pixel number into a known wavenumber.
3. Results.
Previous studies (bio integrator network – RINBIO, applied by IFREMER [15]), which were done in the area of Mediterranean Sea in the summer of 2004 detected significant amounts of PAHs, mostly fluoranthene, (1 µg/kg – 10 µg/kg) near Toulon anchorage, Languedocian lagoons and Hyeres zone [15, 16]. This data was applied as cross a reference for further Raman/SERS measurements.
3.1 Harbor test
3.1.1. Raman measurement
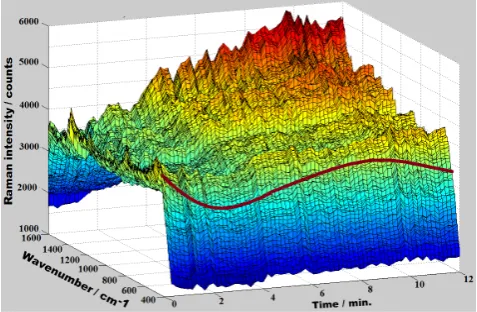
The first task of experiments in the harbor was to check the ability of newly developed sensor to measure signals in the seawater. This was achieved by measuring Raman scattering, e.g. no substrates applied, of the salt ions from the seawater. Figure 3 shows Raman measurements of the seawater from harbor applying different integration times, from 5 s to 60 s. Salt ions of SO42- in the position of 980 cm-1 can be detected within 10 s integration time.
Spikes, e.g. artifacts of CCD, which can be seen in higher integration times (fig.3) are not removed by the program due to single measurement of each spectrum (only one CCD readout). The single measurements for the in situ experiments are necessary due to contentious change of the water sample (with a flow), in difference to the laboratory conditions when the sample is uniform.
The measurement of conventional Raman spectra is an important step to verify the efficiency of the sensor and its ability to measure Raman signals in the sea water.
Figure 3. Raman signal of real sea water. Laser λ = 671 nm, laser power 30 mW, I = 275 mA, integration times of 5 s – 60 s.
2.4.2. SERS measurement
[image:3.595.326.537.337.673.2]substrates would behave in real field conditions.
Current work is focused towards PAHs detection; consequently the detected signals are referred to the certain PAHs. The reference data for PAHs measurements on gold island substrates are presented in [17].
[image:4.595.60.292.350.543.2]After exposing gold island substrates to the real seawater, various Raman/SERS signals appear in 10 s only. As we can observe from figure 4 (typical spectrum from one of the measurements), water from the harbor produces signals in the following locations: 1537 cm-1 – fluorine (lab. 21544 cm-1); 1346 cm-1 – phenanthrene (lab. 1349 cm-1 intense signal) and acetylene (lab. 1346 cm-1); 1278 cm-1 – biphenyl (lab. 1269 cm-1) or fluoranthene (lab. 1264 cm-1); 781 cm-1 – fluoranthene (lab. 793 cm-1); 674 cm-1 – fluoranthene (lab. 662 cm-1intense signal) and 490 cm-1, which is typical for quartz (quartz window in the optode), but since the intensity of the signal is significantly higher than the reference spectrum, (main supply water) it may overlap expected intense signal from biphenyl at 488 cm-1. The small Raman shifts in different measurements are expected and typically are ±5 wavenumbers [18], but in some cases up to ±15 wavenumbers [19].
Figure 4. Raman/SERS measurement of real sea water in the harbor (29.11.12) and reference spectrum of fresh tab water on gold island substrate (different), laser power 30 mW; λ = 671 nm. 10 s integreation time (for both measurmements).
Note that high amounts flouranthene (1 µg/kg – 10 µg/kg), representing the sum of PAHs, were detected in the area of Toulon in 2009. This means that the results of current experiments, which is done in 10 s (!) only, matches previous studies.
3.2. In situ experiments
Sea trials are be done on a Rigid Inflatable Boat (RIB) powered by an outboard engine. The Raman/SERS with a complete weight of over 100 kg3, was immersed in the water
2 laboratory measurements
3 Weight of SGI is 70 kg + additional minimum weight of 40 kg to prevent
by using an onboard davit crane.
3.2.1. Behavior or the Gold Island Substrate in Real Sea Water
3D measurement of the real seawater from offshore station I during 12 minutes is presented in figure 5. As we can observe from the figure, the Raman signal is very intense for the first 10-30 seconds since substrate is immersed in seawater - this is due to high sensitivity of the fresh substrate, after this time (of 30 s) the gold nano particles (which are not covered with the sol gel) from the top layer of the substrate degrade in contact with the sea water and Raman signals decrease (for ~2-3 minutes). Starting with the 3rd minute of the measurement, Raman signal increase again due to adsorption process of the chemicals from water into the surface of the substrate, which happens faster than desorption (both processes takes place during experiments, which is why we can observe constant variation of the signal).
Starting with the 10th minute, since the gold island substrate is immersed into seawater, Raman signal slowly contentiously decreases due to substrate sensitivity loss, which can be no longer compensated with chemical adsorption process.
Figure 5. 3D SERS spectra of real surface water in off shore station I: 07.01.13; continous measurement; gold island substrates Laser λ = 671 nm, laser power 30 mW; 10 s integration time
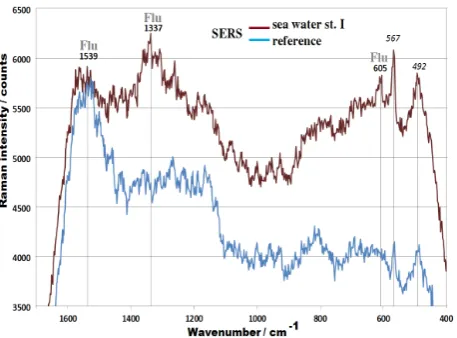
3.2.2. Measurements in Offshore Station I
Offshore station I is located in an area with waves, therefore experiments were done in harsh conditions. 2D spectrum of the measurement from station I, is presented in figure 6 (in red). The fresh tab water spectrum (in blue) do not contain pollution, therefore serves as a reference. In difference to the harbor measurement, three signals from fluorine were detected in positions 1539 cm-1 (lab. 1544 cm-1), 1337 (lab. 1336 cm-1) and 605 cm-1 (lab. 600 cm-1).
Raman signal in the location of 567 cm-1 is excluded from evaluations as repetitious (from the reference measurement). Location at 492 cm-1 is typical for quartz as already discussed.
floating
[image:4.595.313.552.360.516.2]
Figure 6. In situ SERS measurement of the sea water from off shore station I (7.01.13) and reference spectrum of fresh tub water (8.01.13); gold island substrates (different); Laser λ = 671 nm, laser power 30 mW; 10 s integration time
3.2.3. Measurements in Offshore Station II
Tamaris Le Lazaret muscle farm (or station II) is a food production area; therefore it is of a great interest to measure Raman signals there.
[image:5.595.60.294.494.678.2]In only 10 s integration time signals from various pollutants appear, which must be present in the mixture. In figure 7, 2 D spectrum of seawater (in red) is presented and compared with reference spectrum of fresh “tap” water (in blue). Three Raman signals from fluorine have been detected: 1537 cm-1 (lab. 1544 cm-1); 1309 cm-1 (lab. 1304 cm-1) and 612 cm-1 (lab. 600 cm-1). As well as two signals from phenanthere in the positions of 1032 cm-1 (1028); 703 cm-1 (lab. 701), and one signal from pyrene at 1392 (lab. 1392 cm-1).
Figure 7. In situ SERS measurement of the sea water from station II (7.01.13) and reference spectrum of fresh tub water ; gold island substrates (different); Laser λ = 671 nm, laser power 30 mW; 10 s integration time
4. Conclusion
For the first time an autonomous in situ Raman/SERS sensor has been constructed and successfully applied in situ. Experiment results show that with integration time of typically 10 s only, the developed sensor is able to detect various Raman signals, which also can be referred to pollution, in current experiment, mixture of PAHs, e.g., fluoranthene, fluorine, biphenyl and phenantherene have been detected in the harbor of La Seyne Sur Mer, as well as fluorene in the open Mediterranean sea and a mixture of fluorene, phenantherene and pyrene in the Tamaris Le Lazaret muscle farm.
Presented Raman/SERS sensor has various applications for measuring different chemicals (with the same sensor but applying different SERS substrates depending on individual measurement tasks). It can be further adapted as an alarm sensor in the AUV (autonomously underwater vehicle), moorings, boy stations, which is able to screen the area in very short times (in the range of seconds) for various chemicals dissolved in the sea water, fresh water or waste water (in the range of nMols).
Acknowledgements
The authors gratefully acknowledge the support by the European Community in the framework of the EU project “SENSEnet” under the contract number PITN-GA-2009-237868. Many thanks are expressed to Hossam Ahmad, Technical University Berlin, for preparation of gold island substrates, as well as Christophe Duchi, IFREMER La Seyne, and Alex Strange for technical support.
REFERENCES
[1] K. Kneipp, H. Kneipp, H. Bohr. Single-Molecule SERS Spectroscopy, Journal of Applied Physics, Vol.103, 261-278, 2006.
[2] K. Sowoidnich, H. Schmidt, H.-D. Kronfeldt, F. Schwagele. A portable 671 nm Raman sensor system for rapid meat spoilage identification. Journal of Vibrational Spectroscopy, Vol.62, 70-76, 2012.
[3] S.N. White. Laser Raman spectroscopy as a technique for identification of seafloor hydrothermal and cold seep minerals. Journal of Chemical Geology, 2008.
[4] MBARI: Hydrothermal vents and laser Raman spectrometer. Online available: http://www.mbari.org/news/feature-image/ doriss-vents.html
[5] T. Murphy, H. Schmidt. H.-D. Kronfeldt. Use of sol-gel techniques in the development of surface-enhanced Raman scattering (SERS) substrates suitable for in situ detection of chemicals in sea-water, Journal of Applied Physics B, Vol. 69, 147-150, 1999.
priority substances in the field of water policy and amending Directive 2000/60/EC. Official Journal of the European Community, L331/1-5, 2001.
[7] T. Wenzl, R. Simon, J. Kleiner, and E. Anklam. Analytical methods for polycyclic aromatic hydrocarbons (PAHs) in food and the environment needed for new legislation in the European Union. Trends in Analytical chemistry, Vol. 25, No. 7, 716-725, 2006.
[8] Polycyclic aromatic hydrocarbons (PAHs) in Australia. Technical report No. 2. Department of environmental protection, 1999. Online available:
http://155.187.3.82/atmosphere/airquality/publications/report 2/pubs/report2.pdf
[9] O. Peron, E. Rinnert, F. Colas, M. Lehaitre, C. Compere. First Steps of in Situ Surface-Enhanced Raman Scattering During Shipboard Experiments, Journal of Applied spectroscopy, Vo. 64, No.10, 1086-1093, 2010.
[10] J. Pfankuche, L. Lubecki, H. Schmidt, G. Kowalewska, H.-D. Kronfeldt. The use of surface-enhanced Raman scattering (SERS) for detection of PAHs in the Gulf of Gdansk (Baltic Sea), Marine Pollution Bulletin, Vo. 64, No. 3, 614 – 626, 2012.
[11] A. Kolomijeca, Y.-H. Kwon, H.-D. Kronfeldt. A Portable Surface Enhanced Raman (SERS) Sensor System Applied for Seawater and Sediment Investigations on an Arctic Sea-trial, Proceedings of the Twenty-second International Offshore and polar Engineering Conference, 1398-1402, 2012.
[12] A. Kolomijeca, Y.-H. Kwon, H.-D. Kronfeldt. Surface-enhanced in-situ Raman-sensor applied in the arctic for analyses of water and sediment. Advanced Environmental, Chemical, and Biological Technologies IX, proceeding SPIE, 8366, 2012.
[13] H. Schmidt, K. Sowoidnich, H.-D. Kronfeldt. A prototype hand-held Raman sensor for the in-situ characterization of meat quality. Journal of Applied Spectroscopy, Vol.64, No.8, 888-894, 2010.
[14] H. Ahmad, H.-D. Kronfeldt. High Sensitive Seawater Resistant SERS Substrates Based on Gold Island Film Produced by Electroless Plating. Marine Science. Vol. 3, No. 1, 1-8, 2013.
[15] B. Andral. Reseau Integrateurs Biologiques RINBIO 2009. Evaluation de la qualite des eaux base sur l’utilisation de stations artificielles de mousles en Mediterranee: results de la champagne, 2009.
[16] B. Andral, J.Y. Stanisiere, D. Sauzade, E. Damier, H. Thebault, F. Galgani , P. Boissery. Monitoring chemical contamination levels in the Mediterranean based on the use of mussel caging. Marine Pollution Bulletin, Vol. 49, No. 9-10, 704-712, 2004.
[17] A. Kolomijeca. An autonomous sea going Raman/SERS instrument for in situ detection of chemicals in sea water. PhD thesis. Berlin, Germany: Technical University Berlin. In print, 2013.
[18] Y.-H. Kwon: Surface-Enhanced Raman Scatering (SERS) Suraces for in-situ trace analysis of PAHs in water by Shifted Excitation Raman Difference Spectroscopy (SERDS). PhD thesis. Berlin, Germany: Technical University Berlin, 2012, Online available:
opus.kobv.de/tuberlin/volltexte/2012/3479/