Journal of Chemical and Pharmaceutical Research, 2012, 4(4):2173-2179
Research Article
ISSN : 0975-7384
CODEN(USA) : JCPRC5
2173
RP-HPLC method development and validation of Dronedarone HCl in its Pure form and
tablet dosage form
Arpan Patel* and Jawed Akhtar
School of Pharmaceutical Sciences, Jaipur National University, Jaipur, Rajasthan, India
_____________________________________________________________________________________________
ABSTRACT
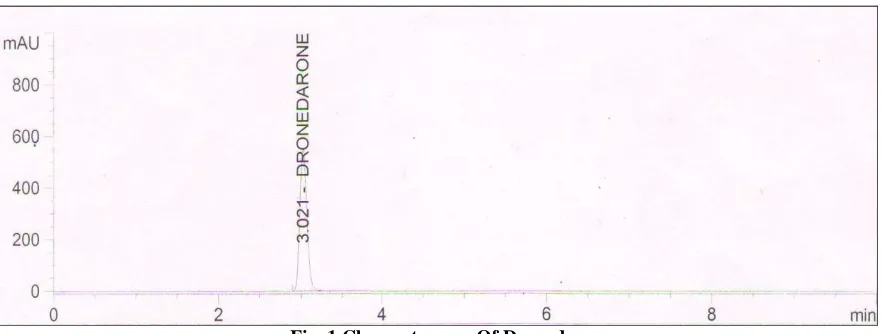
A simple, rapid, sensitive, reverse phase isocratic RP-HPLC method was developed for determination of Dronedarone in pure form and tablet dosage form. The method was carried out using Hypersil ODS 3V column (250 mm × 4.5 mm i.d., 5 µm particle size) with mobile phase comprised of Buffer: acetonitrile(42:58%v/v). Buffer use is Potassium dihydrogen phosphate buffer with pH 3.0 . The flow rate was set at 1.1 ml/min and effluent was detected at 220nm. The retention time of Dronedarone was found to be 4. minute. The method was validated for specificity, accuracy, precision, linearity, and limit of detection, limit of quantification, robustness and solubility stability. LOD and LOQ were found to be 0.87 µg/ml and 2.66 µg/ml respectively. The calibration curve was linear in the concentration range of 10-150 µg/ml with coefficient of correlation 0.9999. The percentage recovery for the Dronedarone was found to be 99.3 and the % RSD was found to be less than 2 %. The proposed method was successfully applied for quantitative determination of Dronedarone in tablet dosage form.
Key words: Dronedarone HCL, HPLC, Validation.
_____________________________________________________________________________________________
INTRODUCTION
Dronedarone N-(2-Butyl-3-(p-(3-(dibutylamino)propoxy)benzoyl)-5-benzofuranyl)methane-sulfonamide is a
antiarrhythmic agent. Chemically, dronedarone is a benzofuran derivative related to amiodarone, a
popular antiarrhythmic the use of which is limited by toxicity due its high iodine content (pulmonary fibrosis, thyroid disease) as well as by liver disease.
In dronedarone, the iodine moieties were removed, to reduce toxic effects on the thyroid and other organs; and a methylsulfonamide group was added, to reduce solubility in fats (lipophilicity) and thus reduce neurotoxic effects. Yet it displays amiodarone-like class III antiarrhythmic activity in vitro and in clinical trials. The drug also appears to exhibit activity in each of the 4 Vaughn-Williams antiarrhythmic classes.
EXPERIMENTAL SECTION
Chemicals & Reagent
Figure 1: Chemical structure of Dronedarone
Instruments
Analysis was performed on a chromatographic system injector, Diode array detector and a single
column used was Hypersil ODS 3V (250 mm × 4.5 mm i.d., particle size 5 µm) UV Shimadzu Limited with 10mm matched pair of quartz cell and spectral band width of ±2nm.
Chromatographic Conditions
For HPLC, mobile phase, Phosphate Buffer(pH 3.0) : Acetonitrile(42:58%v/v) was filtered and degassed. The injection volume was injected 10µl with a flow rate of 1.1ml/min. Detection was carried out at 220 nm at column temperature 30°C and run time set at 7 minutes.
Assay Procedure: Standard preparation
Accurately 20 mg of Dronedarone HCl
dissolved in few ml of diluent. The volume was then made up to 2 solution of 100 µg/ml of dronedarone.
Sample Preparation
Calculate average wt. of 10 tabs. Take wt. equivalent to 100mg. transfer to 100 ml volumetric flask. Then add 50 ml of diluents and sonicate for 30mins. Then makeup with diluents upto mark. Then tr
50ml of volumetric flask and makeup with diluent to obtain final concentration of 100 µg/ml with 0.45 Millipore filter and fill in HPLC vials.
(40:60%v/v)
Assay of valsartan
Standard and sample solution of dronedarone was injected. Assay was performed as per given chromatographic conditions. The amount of valsartan present in the sample was computed from the linearity curve.
Method Validation:
The method was validated for the parameters like system suitability,
ruggedness, specificity, limit of detection (LOD), limit of quantification (LOQ), solution stability, and robustness.
System suitability
System suitability of the method was evaluated by analyzing the repeatability, peaks symmetry (Symmetry factor), theoretical plates of the column, peak area and retention time.
1.
Range and Linearity
To evaluate the linearity, serial dilution of analyte were pre desired concentrations (10, 25, 50,
prepared solutions were filtered through 0.45 µm membrane filter and each of the dilutions was injected five times
2174
Figure 1: Chemical structure of Dronedarone
Analysis was performed on a chromatographic system Shimadzu and Agilent 1200 series equipped with an injector, Diode array detector and a single‐beam Agilent UV‐Visible spectrophotometer, Model
column used was Hypersil ODS 3V (250 mm × 4.5 mm i.d., particle size 5 µm) UV-Visible spectrophotometer 1700 Shimadzu Limited with 10mm matched pair of quartz cell and spectral band width of ±2nm.
le phase, Phosphate Buffer(pH 3.0) : Acetonitrile(42:58%v/v) was filtered and degassed. The injection volume was injected 10µl with a flow rate of 1.1ml/min. Detection was carried out at 220 nm at column temperature 30°C and run time set at 7 minutes.
Dronedarone HCl was weighed into 200 ml of volumetric flask. The compound was first dissolved in few ml of diluent. The volume was then made up to 200 ml with diluents to obtained final standard solution of 100 µg/ml of dronedarone.
Calculate average wt. of 10 tabs. Take wt. equivalent to 100mg. transfer to 100 ml volumetric flask. Then add 50 ml of diluents and sonicate for 30mins. Then makeup with diluents upto mark. Then transfer 5ml of this preparation to
and makeup with diluent to obtain final concentration of 100 µg/ml
with 0.45 Millipore filter and fill in HPLC vials. Note: Diluent use is ACN: Phosphate Buffer pH 3.0
Standard and sample solution of dronedarone was injected. Assay was performed as per given chromatographic conditions. The amount of valsartan present in the sample was computed from the linearity curve.
The method was validated for the parameters like system suitability, range, linearity, accuracy, precision, ruggedness, specificity, limit of detection (LOD), limit of quantification (LOQ), solution stability, and robustness.
itability of the method was evaluated by analyzing the repeatability, peaks symmetry (Symmetry factor), theoretical plates of the column, peak area and retention time. Result of System Suitability data presented in
evaluate the linearity, serial dilution of analyte were prepared from the stock solution of 1000 µg/ml 0, 100, 120 and 150 µg/ml) for linearity in the range of 10
through 0.45 µm membrane filter and each of the dilutions was injected five times Agilent 1200 series equipped with an auto Visible spectrophotometer, Model 8453. The analytical Visible spectrophotometer 1700 Shimadzu Limited with 10mm matched pair of quartz cell and spectral band width of ±2nm.
le phase, Phosphate Buffer(pH 3.0) : Acetonitrile(42:58%v/v) was filtered and degassed. The injection volume was injected 10µl with a flow rate of 1.1ml/min. Detection was carried out at 220 nm at column
was weighed into 200 ml of volumetric flask. The compound was first 00 ml with diluents to obtained final standard
Calculate average wt. of 10 tabs. Take wt. equivalent to 100mg. transfer to 100 ml volumetric flask. Then add 50 ml ansfer 5ml of this preparation to and makeup with diluent to obtain final concentration of 100 µg/ml. Filter this preparation
Note: Diluent use is ACN: Phosphate Buffer pH 3.0
Standard and sample solution of dronedarone was injected. Assay was performed as per given chromatographic conditions. The amount of valsartan present in the sample was computed from the linearity curve.
linearity, accuracy, precision, ruggedness, specificity, limit of detection (LOD), limit of quantification (LOQ), solution stability, and robustness.
itability of the method was evaluated by analyzing the repeatability, peaks symmetry (Symmetry factor), Result of System Suitability data presented in Table
2175
into the column. Absorbance at 220nm was measured and calibration curve for dronedarone was constructed by plotting the mean peak area (Y-axis) against the concentration (X-axis) As shown in Figure 3 and Table 2 &3
Accuracy (% Recovery)
The difference between theoretical added amount and practically achieved amount is called accuracy of analytical method. Accuracy was determined at 3 different level 50%, 100% and 150% of the target concentration in duplicate. Result of accuracy data presented in Table 4.
Precision
The method precision was done by preparing six different sample preparations by one analyst under the same condition. The results were presented in Table 5. The results obtained were within 2% RSD in Table 5.
Ruggedness
Ruggedness test was determined between two different analysts, instruments and Columns. The value of percentage RSD was below 2.0%, showed ruggedness of developed analytical method. The results were presented in Table 6.
Limit of Detection and Limit of Quantification
The limit of detection (LOD) and the limit of quantification (LOQ) of the drug were calculated using the following equations as per International Conference on Harmonization (ICH) guidelines (41). The LOD and LOQ for Dronedarone are 0.87 & 2.66.
LOD = 3.3 × σ/S
LOQ = 10 × σ/S
Where σ = standard deviation of the response, S= slope of the regression line
The results were presented in Table 7
Robustness
Robustness of the method was carried out by deliberately made small change in the flow rate, and organic phase ratio, column oven temperature. Results were presented in Table 8.
Solution stability
The standard and sample solutions were found stable up to 24 hours at room temperature. After 4, 8, 12, 16, 20, 24 hours the solutions were analysed. No significant changes (<2%) were observed for the chromatographic responses for the solution analysed, relative to freshly prepared standard. Results related to solution stability are summarized in Table 9
[image:3.595.72.513.562.729.2]RESULTS AND DISCUSSION
The system suitability results fulfil the acceptance criteria and prove that the result
Linearity level Stock soln. in µg/ml Stock soln. to be taken in mL
10% 1000
25% 1000
50% 1000
100% 1000
120% 1000
150% 1000
Sr. No.
2176
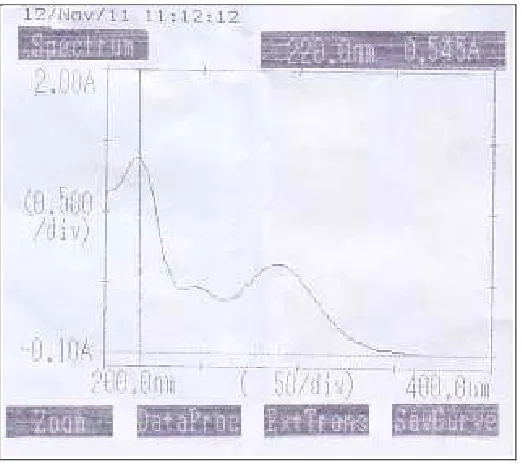
[image:4.595.169.430.115.347.2]Fig. 2 U.V. spectra of Dronedarone
Table-1 : System Suitability Data
a : Mean of six determinations
The system suitability results fulfil the acceptance criteria and prove that the results of method are
Table-2: Preparation of linearity solutions
Stock soln. to be taken in mL Dilute to volume (mL) with methanol
2 200
5 200
5 100
5 50
6 50
7.5 50
Sr. No. Parameters Dronedarone HCl a
1 Peak area 4420401
2 No. of theoretical plates 3480.89
3 Retention time (min) 4.2
4 Asymmetry 1.1
5 % RSD 0.4
of method are reproducible.
Dilute to volume (mL) with methanol Final concentration in µg/ml
[image:4.595.200.397.394.485.2]2177
Fig.3: Calibration curve of Dronedarone HCl showing linearity
Table-3: Regression Analysis Data for Calibration Curves
Table-4: Results of Accuracy Data of Dronedarone HCl
a : Accuracy was checked at three levels viz. 50%, 100% and 150
The accuracy results show that the method is accurate to practically achieve added amount at three different levels within 98%-102% with RSD less than 2%. The average % recovery was found to be 99.3%.
Table-5: Results for Method Precision
a: Mean of six determinations
y = 44887x - 11128 R² = 0.999
0 1000000 2000000 3000000 4000000 5000000 6000000 7000000 8000000
0 50 100 150 200
A
re
a
concentration µg/ml
Linerity curve of Dronedarone HCL
Standard curve
Linear (Standard curve)
Parameters(Units) Dronedarone HCl
Linearity range µg/ml 10-150µg/ml Regression Coefficient r2 0.9999
Slope 44887.19
Intercept -11128.79
Level of
Recovery a Area Added Amount (mg) Recovered Amount (mg)
% Recovery
Mean % Recovery
% RSD
50%
1598.889 50.30 49.04 98.8
99.0 0.3
1591.447 50.00 48.81 98.9
1609.350 50.30 49.36 99.4
100%
3204.018 100.10 98.26 99.5
99.4 0.4
3194.400 100.30 97.97 99.0
3216.822 100.20 98.65 99.7
150%
4777.469 150.10 146.52 98.9
99.1 0.2
4791.576 150.39 146.95 99.0
4802.626 150.30 147.29 99.3
Set No. Dronedarone HCl
%Assay Mean %Assay a % RSD
1. 98.8
98.5 0.5
2. 98.5
3. 98.5
4. 97.9
5. 98.2
2178
The method precision gave results obtained within 2% RSD suggesting the method is precise.
Table-6: Results for Ruggedness
Set No.
Dronedarone HCl (%Assay)
Analyst 1 (Instrument 1) Analyst 2 (Instrument 2)
Column 1 Column 2 Column 1 Column 2
1. 98.5 98.9 98.5 98.3
2. 98.9 98.6 98.6 98.1
3. 98.2 98.2 98.2 98.8
4. 98.6 98.1 98.1 98.6
5. 98.5 98.8 98.6 98.3
6. 98.4 98.4 98.3 98.5
Mean %Assay a 98.5 98.4 98.2 98.4
% RSD 0.23 0.38 0.38 0.25
a: Mean of six determinationss
b: Ruggedness studies were carried out using different analysts, instruments and columns
The results for ruggedness evaluation give RSD below 2% suggest the method is rugged to changes.
Table-7: LOD & LOQ
S. No. Conc. µµµµ
g/ml Peak Area S. D. Slope
LOD
µµµµg/ml LOQ
µµµµg/ml
1
Dronedarone HCl 100 µg/ml
4420101
11902.7 44887.19 0.87 2.65
2 4453781
3 4428694
4 4427364
5 4424281
6 4426891
The LOD for Dronedarone HCl was found to be 0.6 µg /ml while LOQ was 1.83 µg /ml.
Table-8: Results of Robustness Study
Concentration level used for robustness evaluation was 100 µg /ml. Three factors were slightly changed at three levels (-1, 0, 1). The results show area obtained.
Sr. No. System Suitability Temp. -5°C
Temp. +5°C
Flow -10%
Flow +10% 1 427578.5 427347.9 427156.3 518314.2 364188.7
2 426461.5 425755.8 427181.1 517152.3 364375.3
3 426073.6 426106.0 427359.7 517872.9 364375.3
4 425727.1 427456.0 427726.7 519110.7 364441.7
5 426087.8 426774.7 427156.3 518354.6 364072.3
6 430062.1 427347.9 427156.3 517825.6 364859.5
% RSD 0.4 0.2 0.1 0.1 0.1
Sr. No. System Suitability Org. Ph +2%
Org. Ph -2%
pH 3.2
pH 2.8 1 427578.5 427521.7 434170.4 427595.5 426635.8
2 426461.5 428645.2 438458.2 427773.4 426676.5
3 426073.6 428896.1 440732.9 426453.3 426144.7
4 425727.1 429748.3 438955.8 427487.2 427357.9
5 426087.8 430009.5 437276.3 427387.6 426635.8
6 430062.1 429856.4 737276.3 427595.5 427589.2
2179
Results for robustness evaluation for drug are presented in Table-8. Insignificant differences in peak areas and less variability in retention times were observed. The results mentioned are of area obtained.
Table-9: Results for Solution Stability for Sample Preparation
The standard and sample solutions were found to be stable up to 24 hrs.
CONCLUSION
A simple, specific, linear, precise and accurate RP‐HPLC method has been developed and validated for quantitative determination Dronedarone in tablet formulation. The method is very simple and specific with runtime of 7 min, makes the developed method it’s suitable for routine quality control analysis work.
Acknowledgment
Sincere thanks to Jaipur National University for providing the research facilities and Cadila Healthcare Ltd., India for providing the Dronedarone drug samples.
REFERENCES
[1] Swarbrick, J. and Boylan, J.C., In; Encyclopedia of Pharmaceutical Technology, New York, Marcel Dekker Inc., Vol. 15, 1997, 329-331.
[2] Connors, K.A., In; A Textbook of Pharmaceutical Analysis, India, Jhon Wiley and Sons, 3th Edn. 1999, 196-198 [3] Harris, D.C., In; Quantitative Chemical Analysis, New York, W. H. Freeman and Company, 6th Edn. 2003, 7-3. [4] Ghazala Khan, Dinesh Sahu, Asian Journal of Biochemical and Pharmaceutical Research, 2011, 1(2), 352 [5] Gunjan Modi, Journal of Chemical and Pharmaceutical Research, 2011, 3(3), 670-675.
[6] Jawad Akthar, Parth Bhatt, Research Journal of Pharmacy and Technology, 2012, 5(1), 60. [7] Patel Nirav M, Asian Journal of Biochemical and Pharmaceutical Research, 2011, 1(2), 379
[8] ICH, Q2A, Text on Validation of Analytical Procedures, International Conference on Harmonization, Geneva, October 1994, 1-5.
[9] ICH, Q2B, Validation of Analytical Procedures: Methodology, International Conference on Harmonization, Geneva, November 1996, 1-8.
[10]http://www.docstoc.com/docs/81444469/RP-HPLC-method-for-amiodarone-in-tablets.
Time (hrs) Dronedarone HCl
Area % Difference
Initial 4442292 -
4 4438694 -0.1
8 4475163 0.7
12 4487724 1.0
16 4460564 0.4
20 4452964 0.2