Comparison of Artificial Intelligence Methods
on the Example of Tea Classification
Based on Signals from E-nose Sensors
Pawe l P lawiak
1,2,∗,
Wojciech Maziarz
31Department of Electrical Engineering, Automatics, Computer Science and Biomedical Engineering
AGH University of Science and Technology 30 Mickiewicza Av., 30-059 Krakow, Poland
2Faculty of Physics, Mathematics and Computer Science, Cracow University of Technology,
24 Warszawska st., F-5, 31-155 Krakow, Poland
3Department of Computer Science, Electronics and Telecommunications
AGH University of Science and Technology 30 Mickiewicza Av., 30-059 Krakow, Poland ∗Corresponding Author: [email protected]
Copyright c⃝2013 Horizon Research Publishing All rights reserved.
Abstract
The data collected from electronic nose systems are multidimensional and usually contain a lot of redundant information. In order to extract only the relevant data, different computational techniques are developed. The article presents and compares selected pattern recognition algorithms in application to qualitative determination of different brands of tea. The measured responses of an array of 18 semi-conductor gas sensors formed input vectors used for further analysis. The initial data processing consisted on standardization, principal component analysis, data normalization and reduction. Soft computing one can divide into single method systems using neural networks, fuzzy systems, and hybrid systems like evolutionary-neural, neuro-fuzzy, evolutionary-fuzzy. All the presented systems were evaluated based on accuracy (generated error) and complexity (number of parameters and training time) criteria. A novel method of forming input data vector by aggregation of the first three principal components is also presented.Keywords
Artificial intelligence methods, Soft computing, Computational intelligence, Neural net-works, Genetic algorithms, Fuzzy systems, Pattern Recognition, Signal processing, PCA, Tea, E-nose, Chemometrics1
Introduction
A semiconductor gas sensors based on metal oxides are very popular due to their advantages: high sensitiv-ity, low cost, small dimensions, low power consumption and easy integration with measurement circuit. Their main drawbacks are small selectivity, drift, lack of long term stability and sensitivity to other parameters, i.e.
temperature changes, water vapour presence in gas at-mosphere, etc. [8]. The reactions between the sensitive layer and gas atmosphere are thermally activated and sensitivity to specific gas depends on the temperature. In the simplest case the only signal obtained from the resistive type sensor is usually its resistance measured at constant temperature. Due to this fact and because of sensors cross-sensitivity and small selectivity a strict determination of gas type and its concentration in un-known mixture is usually impossible.
In order to solve this problem one can use different approaches. One of them is based on the gathering and processing of signals obtained from arrays of partially selective sensors [4, 11]. The sensitivity and selectivity of a sensor array can be highly enhanced by developing various pattern recognition algorithms [3, 14].
A promising and quite novel approach is the analy-sis of the dynamic response of a single sensor working at modulated temperature. In such a case, one sensor is equivalent to an array of sensors working at differ-ent temperatures. For sensors powered with a pulse voltage the average power consumption decreases and also the long-term stability of the sensor is improved [9, 13, 20]. The intentional temperature change accord-ing to a programmed profile can provide additional in-formation consisted in time dependent non-linear sensor response. Such response is related to the adsorption and desorption processes at the semiconductor surface and is influenced by the concentration of the gas species and their chemical structure. These properties are used in gas sensor arrays working in electronic noses, where a multidimensional and non-linear responses are measured and analysed.
performed by the standard pattern recognition meth-ods used in chemometrics (i.e. PCA - Principal Com-ponent Analysis, CLA - Cluster Analysis, TM - Tem-plate Matching, DFA - Discriminant Function Analysis, TMLR - Transformed Multiple Linear Regression) [12] or signal processing (i.e. Fourier or wavelet analyses, ANN - Artificial Neural Networks, GA - Genetic Algo-rithms, FL - Fuzzy Logic, etc.) [6, 27].
As electronic nose (e-nose) is the technical system con-sisting of both the hardware and software [7]. A hard-ware part is an array of sensors responsible for detecting odours present in the measured gas atmosphere. The software is created by advanced algorithms that process information about volatile organic compounds (VOCs) and make the final analysis. Just as a biological analog, the e-nose is used for identification and classification of gas mixtures and rarely their concentrations [16]. The e-nose systems based on sensor arrays are frequently used in qualitative analyses of different species, i.e. of milk [2, 29], alcohols [1, 30] and tea [5, 10, 21, 28].
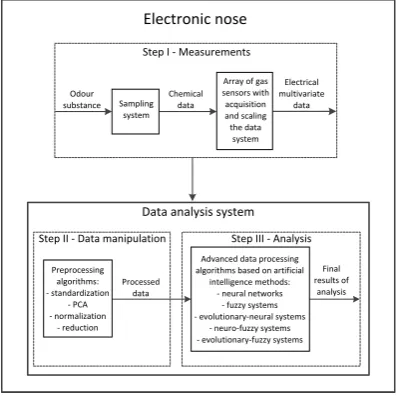
Figure 1 shows three stages of signal processing from measurements of odours to the final analysis using AI methods.
Step I - Measurements
Step II - Data manipulation Step III - Analysis Odour
substance Sampling system
Chemical data
Array of gas sensors with acquisition and scaling the data
system Electrical multivariate
data
Electronic nose
Data analysis system
Preprocessing algorithms: - standardization
- PCA - normalization
- reduction Processed
data
Advanced data processing algorithms based on artificial
intelligence methods: - neural networks
- fuzzy systems - evolutionary-neural systems
- neuro-fuzzy systems - evolutionary-fuzzy systems
Final results of
[image:2.595.64.263.352.550.2]analysis
Figure 1. An example of electronic nose structure.
An essential part of the commercial e-nose devices is data processing unit data analysis system that performs data preprocessing, reduction and analysis. Algorithms employed should be relatively simple and not compu-tationally demanding. In order to extract the relevant data only, minimize the computation time and prepare algorithms the best suited to be embedded in a hard-ware, a lot of different approaches are developed.
In this paper, the authors focused on a comparison of selected intelligent systems [26] based on computational intelligence, used to analyse the signals from the sensors array in order to classify brands of tea. The authors have developed several data analysis systems. To collect the data a commercial e-nose was used. The software was written in MATLAB1, as it contains very extensive libraries of functions using AI methods.
1MATLAB version R2010a
2
Measurements
The measurements were performed on commercially available e-nose from Alpha MOS company - model FOX 4000 [15]. It consists of an array of 18 semiconductor gas sensors.
E-nose array consists of three types of metal oxide semi-conductor sensors [17–19]:
• type T – SnO2 active layer;
• type P – also based on SnO2; higher sensitivity and faster response time than T-type,
• type LY – based on Cr2−xTixO3+y (p-type) and
WO3(n-type); LY are low power sensors.
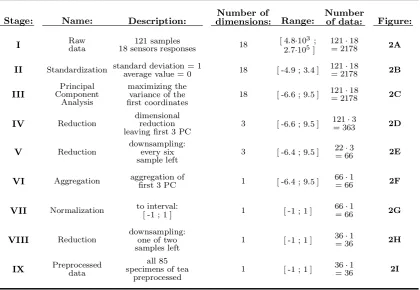
Tea specimen means the vial broadcast with tea directly from the package. All tea specimens were heated before measurement for 5 min at 60◦C. The volume injected into the measuring chamber of the gas mixture was 0.5 ml. Measurement of each specimen of tea lasted 121 sec-onds. Sampling was performed every second, and single sample contains information about a resistance value of 18 sensors. A set of 121 samples was performed. In effect, for a single specimen of tea we obtain a matrix, consisting of 121 rows corresponding to subsequent sam-ples, and 18 columns corresponding to the responses of the sensors. Table 1 shows the matrices in which the data was collected.
The object of this study were data obtained for different brands of tea. For every kind of tea a number of data sets (from 5 to 25, see Table 3) was recorded and as a result we obtained 85 input data sets. After data selection process, described in next paragraphs, 10 brands of tea were taken into consideration: 1 - melissa; 2 - melon-apple; 3,4,5,6 - mint of 4 kinds; 7 - chamomile; 8 - vanilla; 9,10 - ginger of 2 kinds. As a result of the selection, some data was rejected and two brands of tea (mint and ginger) were divided into subtypes because they formed groups with tea specimens that have similar responses.
3
Data manipulation
The first stage of data manipulation was preprocessing of measurement data: standardization, principal compo-nent analysis (PCA), normalization and data reduction.
3.1
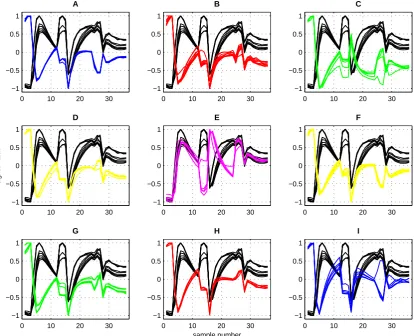
PreprocessingAll of the preprocessing stages performed on a single specimen of tea are described in Table 2 and shown in Figure 2. As a result 85 vectors build of 36-elements were obtained. A part of them – after data selection - were used as input data for all the developed and evaluated AI systems.
3.2
Data selection0 50 100 0
0.5 1 1.5 2 2.5
3x 10 5
resistance [
Ω
]
sample number A
0 50 100
−4 −2 0 2 4
signal value
sample number B
0 50 100
−5 0 5 10
signal value
sample number C
0 50 100
−5 0 5 10
signal value
sample number D
0 5 10 15 20
−5 0 5 10
signal value
sample number E
0 20 40 60
−5 0 5 10
I PC II PC III PC
signal value
sample number F
0 20 40 60
−1 −0.5 0 0.5 1
I PC II PC III PC
signal value
sample number G
0 10 20 30
−1 −0.5 0 0.5 1
I PC II PC III PC
signal value
sample number H
0 10 20 30
−1 −0.5 0 0.5 1
signal value
[image:3.595.100.517.233.575.2]sample number I
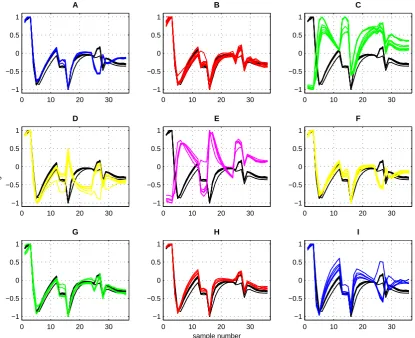
Figure 2. The visualization of preprocessing stages for single specimen of tea. A– measured sensors response vectors, each color
represents separate response; B– signals after the standardization; C– after PCA, each PC is presented with a different color; D– first three PCs; E– first three PCs - every six sample left; F– after aggregation of PC1 to PC3; G– signal after normalization; H
Table 1. Data matrices.
Table 2. Successive preprocessing stages of measured data, for single specimen of tea. PC is principal component.
are shown in Figure 3, where visual grouping of different kinds of tea is observed.
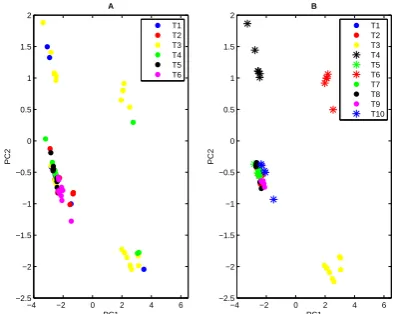
Figure 3 presents the separation of preprocessed data, but as it can be seen, it is rather difficult to interpret. Therefore, other methods showing the grouping of data were used. One of them is PCA that converts a set of observations of possibly correlated variables into a set of values of linearly uncorrelated variables called principal components (PC). On the graph of PC1 vs. PC2 one can observe grouping of similar variables. Figure 4 which is equivalent to Figure 3 shows the grouping for all kinds of tea before and after selection.
Table 3 provides a detailed description of the data, covering raw data, preprocessed data, reference matrices
(matrices with model answers) and data selection. For the reference matrices the expected response should be understood as the correct brand of tea.
3.3
Training and test data setsIntelligent systems learn on examples how to analyse input signals. Due to this fact one has to divide all of the elements into training data set used for learning and test data set used for evaluation of the system. In or-der to make properly this assignment, we draw the data and judge visually whether the elements are grouped or separated into classes (tea brands).
0 10 20 30 −1
−0.5 0 0.5 1
A
0 10 20 30
−1 −0.5 0 0.5 1
B
0 10 20 30
−1 −0.5 0 0.5 1
C
0 10 20 30
−1 −0.5 0 0.5 1
signal value
D
0 10 20 30
−1 −0.5 0 0.5 1
E
0 10 20 30
−1 −0.5 0 0.5 1
F
0 10 20 30
−1 −0.5 0 0.5 1
G
0 10 20 30
−1 −0.5 0 0.5 1
sample number
H
0 10 20 30
−1 −0.5 0 0.5 1
[image:5.595.101.516.245.581.2]I
Figure 5. The comparison of signals obtained for T3 mint tea on background of others species of tea. Mint tea T3 is in black, other
brands of tea have different colors. Figure 5 was made from Figure 2H. Legend: T3 vs. A– T1; B– T2; C– T4; D– T5; E– T6;
Table 3. Description of data.
0 5 10 15 20 25 30 35 −1
−0.5 0 0.5 1
sample number
signal value
A
T1 T2 T3 T4 T5 T6
0 5 10 15 20 25 30 35 −1
−0.5 0 0.5 1
sample number
signal value
B
[image:6.595.65.263.521.689.2]T1 T2 T3 T4 T5 T6 T7 T8 T9 T10
Figure 3. The visual grouping of data before and after selection.
The solid lines show the basic teas, while the dashed line subtypes of teas obtained as a result of selection. Different brands of tea are marked with symbols T1 to T10. Legend: A– before selection - 6 species; B– after selection - 10 species;
−4 −2 0 2 4 6 −2.5
−2 −1.5 −1 −0.5 0 0.5 1 1.5 2
PC1
PC2
A
T1 T2 T3 T4 T5 T6
−4 −2 0 2 4 6 −2.5
−2 −1.5 −1 −0.5 0 0.5 1 1.5 2
PC1
PC2
B
[image:6.595.318.517.530.687.2]T1 T2 T3 T4 T5 T6 T7 T8 T9 T10
Figure 4. The result of PCA: the visual grouping of data before
tea in comparison to one chosen kind of tea - mint (T3). As we can see there is an example of good separation of T3 tea from others. Data of this kind are relatively easy to classify for data analysis systems.
Similarly, figure 6 show signals obtained for specific brands of tea in comparison to mint tea (T5). As we can see there is an example of almost no separation of T5 tea from others. The signal for T5 tea is very similar to signals form T2, T8 and T9. Data of this kind are very difficult for classification systems.
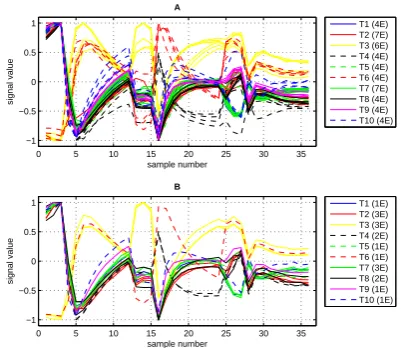
After selection, the data have been carefully divided for the training set and test set. Figure 7 shows the data for the a.m. sets. Note that the elements (data vectors related to specimens of tea) of the same kind of tea are grouped close together and are marked with the same color. Some groups of elements are clearly separated, while others overlap. The elements used to test the systems are within a set of elements used for learning systems. Shapes of signals in training and test data sets (for a given species of tea) are similar.
0 5 10 15 20 25 30 35 −1
−0.5 0 0.5 1
sample number
signal value
A
T1 (4E) T2 (7E) T3 (6E) T4 (4E) T5 (4E) T6 (4E) T7 (7E) T8 (4E) T9 (4E) T10 (4E)
0 5 10 15 20 25 30 35 −1
−0.5 0 0.5 1
sample number
signal value
B
[image:7.595.77.278.310.484.2]T1 (1E) T2 (3E) T3 (3E) T4 (2E) T5 (1E) T6 (1E) T7 (3E) T8 (2E) T9 (1E) T10 (1E)
Figure 7. Separation of data (related to specimens of tea) into
training and test sets. Numbers in brackets (i.e. 4E) mean the number of elements (i.e. 4) of a given set assigned to specific brand of tea. Legend: A– training set; B– test set.
4
Data analysis systems
The data contained in the preprocessed response vec-tors are fed into the next stage of recognition of odour – data analysis. It involves the assignment of the input data to appropriate classes. Such classification is per-formed using data analysis systems based on the meth-ods of AI.
The advantage of techniques based on artificial intelli-gence (AI) methods lies in the properties inherited from their biological equivalent, such as learning and gener-alization of knowledge (ANN [23]), a global optimiza-tion (evoluoptimiza-tionary algorithms) and the use of imprecise concepts (FL) [26]. Very high popularity of ANN in recent years has contributed to a number of different types of structures, data flow, type of transfer function of neurons and the method of training. When applying ANN to obtain maximum efficiency, the designer must demonstrate relevant experience realized in the selection of relevant parameters.
The authors designed the data analysis systems that use both the single methods of AI and/or their combina-tions [22, 24]. Below are briefly characterized. A several types of ANN were evaluated and the results of their calculations were compared.
• Single AI methods
– Artificial neural networks (ANN)
∗ Feed-forward neural network (FF)
∗ Probabilistic neural network (PNN)
∗ Learning vector quantization network (LVQ)
∗ Recurrent neural network (RNN)
∗ Radial basis function neural network (RBF)
– Sugeno fuzzy system (FUZZY)
• Hybrid systems
– Evolutionary-neural systems (ANN + GA) - artificial neural networks, where the weights and biases are determined as a result of training by genetic algorithm
∗ Feed-forward neural network trained by genetic algorithm (FF + GA)
∗ Recurrent neural network trained by ge-netic algorithm (RNN + GA)
– Neuro-fuzzy system (ANFIS) - Sugeno-type fuzzy system transformed into an equiva-lent neural network, whose parameters are op-timized using the method of backpropagation
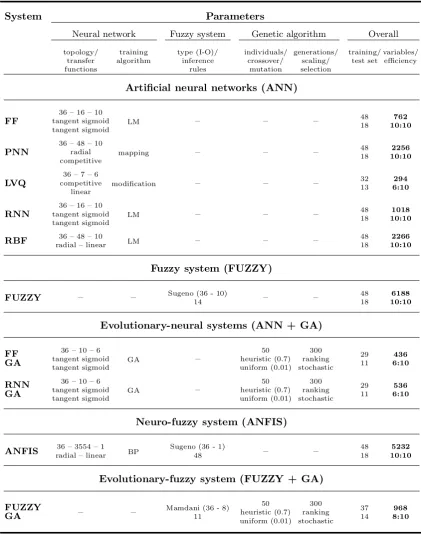
– Evolutionary-fuzzy system (FUZZY + GA) - Mamdani-type fuzzy system with pa-rameters optimized using a genetic algorithm The most important parameters of these systems are presented in Table 4. For the ANN are: topology, the transfer function of neurons in successive layers and training algorithm. For the fuzzy system are: the type with the number of inputs - outputs in brackets and the number of inference rules. For the GA are: the number of individuals, the probability of crossover and mutation, the number of generation and the method of scaling and selection. For overall parameters are: the number of elements of the training and test sets, the number of variables (parameters determined during the training - such as weights and biases or parameters of membership functions in the premises and conclusions), and the number of correctly classified brands of tea.
4.1
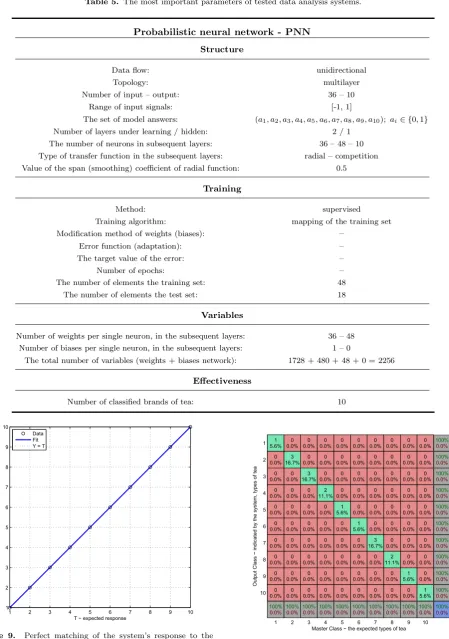
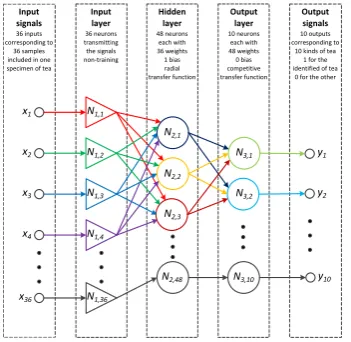
Probabilistic neural networkAmong all the tested systems the probabilistic neural network (PNN), received the best score in the evalua-tion. Its structure is shown in Figure 8. The results of calculations of the PNN system are presented in Figures 9 and 10. Table 5 presents its parameters.
0 10 20 30 −1
−0.5 0 0.5 1
A
0 10 20 30
−1 −0.5 0 0.5 1
B
0 10 20 30
−1 −0.5 0 0.5 1
C
0 10 20 30
−1 −0.5 0 0.5 1
signal value
D
0 10 20 30
−1 −0.5 0 0.5 1
E
0 10 20 30
−1 −0.5 0 0.5 1
F
0 10 20 30
−1 −0.5 0 0.5 1
G
0 10 20 30
−1 −0.5 0 0.5 1
sample number
H
0 10 20 30
−1 −0.5 0 0.5 1
[image:8.595.87.503.244.582.2]I
Figure 6. The comparison of signals obtained for T5 mint tea on background of others species of tea. Mint tea T5 is in black, other
brands of tea have different colors. Figure 5 was made from Figure 2H. Legend: T5 vs. A– T1; B– T2; C– T3; D– T4; E– T6;
Table 4. The parameters of the probabilistic neural network (PNN).
In the output layer each recognized class corresponds to one neuron (with competition transfer function). The only parameter influencing the learning process of PNN is smoothing coefficient. It represents the radial devi-ation of appropriate Gaussian functions. Its modifica-tion affects the range of influence (scope of impact) of “knowledge” contained in the training set on space of input signals. The PNN system learns quickly, its dis-advantage is the size. This is due to the fact that this type of network consists of neurons corresponding to all the elements of the training set. This results in mapping of the entire training set in PNN structure.
The example of matching the PNN response to the model response obtained for a test set are presented in Figure 9. The accuracy of the system is related to the
Table 5. The most important parameters of tested data analysis systems.
1 2 3 4 5 6 7 8 9 10
1 2 3 4 5 6 7 8 9 10
T expected response
[image:10.595.67.517.56.696.2]Y t h e re sp o n se o f th e syst e m Data Fit Y = T
Figure 9. Perfect matching of the system’s response to the
response model for a test set.
1 2 3 4 5 6 7 8 9 10
1 2 3 4 5 6 7 8 9 10 1 5.6% 0 0.0% 0 0.0% 0 0.0% 0 0.0% 0 0.0% 0 0.0% 0 0.0% 0 0.0% 0 0.0% 100% 0.0% 0 0.0% 3 16.7% 0 0.0% 0 0.0% 0 0.0% 0 0.0% 0 0.0% 0 0.0% 0 0.0% 0 0.0% 100% 0.0% 0 0.0% 0 0.0% 3 16.7% 0 0.0% 0 0.0% 0 0.0% 0 0.0% 0 0.0% 0 0.0% 0 0.0% 100% 0.0% 0 0.0% 0 0.0% 0 0.0% 2 11.1% 0 0.0% 0 0.0% 0 0.0% 0 0.0% 0 0.0% 0 0.0% 100% 0.0% 0 0.0% 0 0.0% 0 0.0% 0 0.0% 1 5.6% 0 0.0% 0 0.0% 0 0.0% 0 0.0% 0 0.0% 100% 0.0% 0 0.0% 0 0.0% 0 0.0% 0 0.0% 0 0.0% 1 5.6% 0 0.0% 0 0.0% 0 0.0% 0 0.0% 100% 0.0% 0 0.0% 0 0.0% 0 0.0% 0 0.0% 0 0.0% 0 0.0% 3 16.7% 0 0.0% 0 0.0% 0 0.0% 100% 0.0% 0 0.0% 0 0.0% 0 0.0% 0 0.0% 0 0.0% 0 0.0% 0 0.0% 2 11.1% 0 0.0% 0 0.0% 100% 0.0% 0 0.0% 0 0.0% 0 0.0% 0 0.0% 0 0.0% 0 0.0% 0 0.0% 0 0.0% 1 5.6% 0 0.0% 100% 0.0% 0 0.0% 0 0.0% 0 0.0% 0 0.0% 0 0.0% 0 0.0% 0 0.0% 0 0.0% 0 0.0% 1 5.6% 100% 0.0% 100% 0.0% 100% 0.0% 100% 0.0% 100% 0.0% 100% 0.0% 100% 0.0% 100% 0.0% 100% 0.0% 100% 0.0% 100% 0.0% 100% 0.0%
Master Class the expected types of tea
O u tp u t C la ss i n d ica te d b y th e syst e m, t yp e s o f te a
Figure 10. PNN: the results of classification of T1–T10 tea
brands for test set. The classifications are marked with the ap-propriate colors – green (proper, on diagonal) or red (improper).
all tea specimens are in green boxes on diagonal).
5
Evaluation criteria
Input signals
36 inputs corresponding to
36 samples included in one specimen of tea
Input layer 36 neurons transmitting the signals non-training Hidden layer 48 neurons each with 36 weights 1 bias radial transfer function Output layer 10 neurons each with 48 weights 0 bias competitive transfer function Output signals 10 outputs corresponding to
10 kinds of tea 1 for the identified of tea 0 for the other
N1,1
x1
x2
x3
x4
x36 N1,36
[image:11.595.91.267.52.223.2]N1,4 N1,2 N1,3 N2,1 N2,2 N2,3 N2,48 N3,1 N3,2 N3,10 y1 y2 y10
Figure 8. The structure of the best system - PNN.
CC covers 40%.
The results were collected from 30 completed analyses of each of the systems, except from systems trained with GA, which require long calculation time or ANFIS system for which the subsequent results were identical. All results were normalized in such a way that the worst score in a group of systems is assigned to 0% of the grade, and the best 100%. Assessment values were normalized by the formulas 1 and 2:
y+= (
x−xmin xmax−xmin
)
·100% (1)
y−=
(
xmax−x xmax−xmin
)
·100% (2)
where: y+ – normalized rating of the system for a given parameterx; used if the rating increases with the parameter x,
y− – normalized rating of the system for a given parameterx, used if the rating decreases with the parameter x,
x– a value of a parameter obtained by the current system evaluated,
xmax – a maximum value of a parameter, obtained from all the analyses,
xmin – a minimum value of a parameter,
obtained from all the analyses During the process of designing the systems the em-phasis was placed on the criterion of accuracy, so the main goal was to achieve the lowest error. When the minimal error was reached, the overall number of sys-tem parameters was decreased.
The analyses concerned 10 systems evaluated on the basis of three parameters for accuracy criterion, and three parameters for complexity criterion. The evaluation was made on the basis of systems efficiency (it tells how well different brands of tea were classified). It was calculated in Matlab as a number of correct classifications of the pattern in relation to all classifica-tions calculated for the entire test set, according to the formula 3: δ= ( 1 N · N ∑ i=1
X(i) =
{
1 for correct classification 0 for incorrect classification
)
·
·100% (3)
where: δ– percentage of correctly classified patterns for the entire test data set,
N – number of tea specimens in the test data set,
X(i) – i-th tea specimen
The winning pattern (kind of tea) was based on the in-termediate results indicated in accordance with the sim-ple rule “winner takes all” (i.e. out of: 0,7; 0,2 and 0,1 it is 0,7 that wins and is transformed to 1,0). After normalization, the values of all a.m. parameters were multiplied by their respective weights. The individual components of evaluational criteria, together with their corresponding weights are described below.
• Accuracy criterion (60%) - evaluated system error
– Maximum number of correctly classified pat-terns. Calculations included three groups of systems: the best - capable to identify all brands of tea (T1–T10), the worst - six brands, and intermediate - eight. Weight – 35% of the assessment. (AC1)
– Average of results for analyses resulted in cor-rectly classified patterns (δ) for the maximum number of classified teas, given in percent-ages, for a given system; weight equals to 20%. (AC2)
– Reliability - the number of error-free classifi-cations for all performed calculations, given in percentages, calculated usually for 30 analyses; weight – 5%. (AC3)
• Complexity criterion (40%) - number of sys-tem parameters (variables)
– Number of variables (parameters) in an anal-ysed system, weight 25% of the assessment. (CC1)
– Average computation time (in seconds) needed to train the system, weight 10%. (CC2)
– Average number of epochs needed to train the system, weight 5%. (CC3)
6
Discussion
Criterion accuracy−complexity (WA3) Accuracy criterion (WA1) Complexity criterion (WA2) 0%
10% 20% 30% 40% 50% 60% 70% 80% 90%
100% PNN
[image:12.595.89.502.60.199.2]RBF ANFIS FUZZY FF RNN FUZZY+GA LVQ RNN+GA FF+GA
[image:12.595.82.502.432.785.2]Figure 11. Results of qualitative analysis of systems from Table 6.
Table 6. The comparison of results obtained for the developed systems. Normalized values (y+ andy−) are given in parentheses.
Table 6 and Figure 11 show the results of the evalua-tion of developed systems.
As one can see from table 6 systems based on ra-dial neural networks exhibit the best classification of tea specimen patterns: PNN (WA3 parameter value -91.68%) and RBF (WA3 - 91.64%). Although both sys-tems have WA3 of similar value, the system based on PNN is marginally better than that based on RBF due to the smaller number of variables - biases, occurring in the last layer of the network (parameter CC1: 2256 vs. 2266). The winning systems have high efficiency in classifying the kinds of tea (over 90% of score).
The systems based on radial neural networks (PNN and RBF) and fuzzy logic (ANFIS and FUZZY) obtained the best results in accuracy criteria, as they always classified all kinds of tea perfectly. The corresponding parameters AC1, AC2, AC3 and WA1 are equal to 100%. All a.m. systems have also the shortest training time (CC2 and CC3 values). The systems based on FL yielded worse marks resulting from the imposed priority on the accu-racy criterion - they have an enormous complexity (CC1: 5232 and 6188). The best system according to complex-ity criteria was LVQ based on neural networks. The high value of parameter WA2 = 98.54% is connected with small number of variables (CC1 - 294). LVQ classified properly only 6 of 10 kinds of tea. FF network exhibits greater stability during learning and greater accuracy than RNN (AC2: 72.22% vs. 67.21% and AC3: 33.33% vs. 23.33%), with lower complexity due to a decreased number of variables and lower computation time (CC1: 762 vs. 1018 and CC2: 20.93 vs. 59.73).
The worst results exhibit systems based on ANN, both FF (WA3 - 46.69%) and RNN (WA3 - 48.97%), trained only with GA, probably because of too small training set. Both systems (FF and RNN + GA) characterize also the longest training time (CC2: 508.5 and 587, CC3: 292 and 300). The system using RNN + GA exhibits greater stability during learning and greater accuracy than FF + GA (AC2: 100% vs. 96.36% and AC3: 100% vs. 70%), at the expense of increased complexity due to increased number of variables and longer computation time (CC1: 536 vs. 436 and CC2: 587 vs. 508.5). Sys-tem FUZZY based on fuzzy logic trained with GA was some better and it classified properly only 8 kinds of tea (AC1 - 8). It has the highest number of training epochs (CC3 - 300) and long training time (CC2 - 380).
As we can see, the systems based on the radial neural networks worked the best at solving problems requiring high accuracy, even if we have a small training set. Fuzzy systems are best suited to problems where the complex-ity does not play a significant role, but we require high accuracy and have access to collected knowledge.
7
Conclusions
The authors proposed the stages of data pre-processing needed to prepare relevant information for the developed AI systems. A novel method of form-ing input data vector by aggregation of the first three principal components was proposed. A dozen of data analysis systems based on ANN, fuzzy system and hybrid systems (evolutionary-neural, neuro-fuzzy and
evolutionary-fuzzy) were developed and evaluated. The systems were used to classify ten kinds of tea. All the methods were optimized according to assumed criteria. The best results in complexity criterion was obtained for systems based on radial neural networks (both PNN and RBF) and fuzzy logic (FUZZY and ANFIS). These systems accurately classified all kinds of tea.
In future the authors plan to study systems based on ANN (FF and RNN) trained GA and then optimized by the LM algorithm. This solution should eliminate the main disadvantage of ANN, i.e a random choose of initial values of network weights and biases, what fre-quently reaching of local minimum, not global. Such combined system should have improved efficiency.
Acknowledgements
The authors thank Professor Zakrzewska for valuable advice and guidance on the preparation of this paper. We are grateful also Dr. Lubecka and Dr. Czapla, who performed the measurements and supplied us with the data from the e-nose. This work has been funded in part by project “Micro- and nano- systems for chemistry and biomedical diagnostics - MNS-DIAG” co-financed by the European Union via the European Regional Develop-ment Fund and the Polish state budget in the frame-work of the Operational Programme Innovative Econ-omy 2007-2013, contract No. UDA-POIG.01.03.01-00-014/08 and in part by Polish Ministry of Higher Educa-tion, Grant no. 11.11.120.614.
REFERENCES
[1] M. Aleixandre, J. Lozano, J. Gutierrez, I. Sayago, M.J. Fernandez, and M.C. Horrillo. Portable e-nose to
clas-sify different kinds of wine. Sensors and Actuators B:
Chemical, 131:71–76, 2008.
[2] K. Brudzewski, S. Osowski, and T. Markiewicz. Classi-fication of milk by means of an electronic nose and svm
neural network. Sensors and Actuators B: Chemical,
98:291–298, 2004.
[3] S. Capone, M. Epifani, F. Quaranta, P. Siciliano, and L. Vasanelli. Application of semiconductor solgel sensor
array to the discrimination of pollutants in air. Thin
Solid Films, 391:314–319, 2001.
[4] S. Capone, P. Siciliano, N. Barsan, U. Weimar, and
L. Vasanelli. Analysis of CO and CH4 gas mixtures
by using a micromachined sensor array. Sensors and
Actuators B: Chemical, 78:40–48, 2001.
[5] C. Cimpoiu, V.-M. Cristea, A. Hosu, M. Sandru, and L. Seserman. Antioxidant activity prediction and clas-sification of some teas using artificial neural networks.
Food Chemistry, 127:1323–1328, 2011.
[6] P. Corcoran and H. Shurmer. An intelligent gas sen-sor. Sensors and Actuators A: Physical, 41-42:192–197, 1994.
[7] J.W. Gardner and P.N. Bartlett. A brief history of
elec-tronic noses. Sensors and Actuators B: Chemical,
18-19:211–220, 1994.
[8] T. Grandke and W.H. Ko. Sensors: A Comprehensive
Survey, Vol. 1, Fundamentals and General Aspects,
Up-date. John Wiley & Sons, 1996.
thermally modulated tin oxide-based microhotplate gas
sensors. Sensors and Actuators B: Chemical, 95:203–
211, 2003.
[10] R. Kaur, R. Kumar, A. Gulati, C. Ghanshyam, P. Ka-pur, and A.P. Bhondekar. Enhancing electronic nose performance: A novel feature selection approach using dynamic social impact theory and moving window time slicing for classification of Kangra orthodox black tea
(Camellia sinensis (L.) O. Kuntze). Sensors and
Actu-ators B: Chemical, 166-167:309–319, 2012.
[11] D.S. Lee, J.S. Huh, and D.D.Lee. Classifying
com-pustible gases using micro-gas sensor array.Sensors and
Actuators B: Chemical, 93:1–6, 2003.
[12] D. Massart, B. Vandeginste, S. Deming, Y. Michotte,
and L. Kaufman. Chemometrics: a textbook. Elsevier,
1990.
[13] W. Maziarz and T. Pisarkiewicz. Gas sensors in a
dy-namic operation mode.Measurament Science and
Tech-nology, 19(055205), 2008.
[14] W. Maziarz, P. Potempa, A. Sutor, and T. Pisarkiewicz. Dynamic response of a semiconductor gas sensor
anal-ysed with the help of fuzzy logic. Thin Solid Films,
436:127–131, 2003.
[15] Alpha M.O.S. Technical note. Av Didier Daurat - Le
St Exupery - 31400 Toulouse - France, October 2002.
www.alpha-mos.com.
[16] Alpha M.O.S.Technical note N-P-01. Av Didier Daurat
- Le St Exupery - 31400 Toulouse - France, October
2002. www.alpha-mos.com.
[17] Alpha M.O.S.Technical note N-SAS-02. Av Didier
Dau-rat - Le St Exupery - 31400 Toulouse - France, October
2002. www.alpha-mos.com.
[18] Alpha M.O.S.Technical note N-SAS-03. Av Didier
Dau-rat - Le St Exupery - 31400 Toulouse - France, October
2002. www.alpha-mos.com.
[19] Alpha M.O.S.Technical note N-SAS-05. Av Didier
Dau-rat - Le St Exupery - 31400 Toulouse - France, October
2002. www.alpha-mos.com.
[20] S. Nakata, K. Neya, and K.K. Takemura. Non-linear dy-namic responses of a semiconductor gas sensor - Compe-tition effect on the sensor responses to gaseous mixtures.
Thin Solid Films, 391:293–298, 2001.
[21] M. Palit, B. Tudu, N. Bhattacharyya, A. Dutta, P.K. Dutta, A. Jana, R. Bandyopadhyay, and A. Chatterjee. Comparison of multivariate preprocessing techniques as applied to electronic tongue based pattern classification
for black tea. Analytica Chimica Acta, 675:8–15, 2010.
[22] L. Rutkowski. Computational intelligence: methods and
techniques. Springer, 2008.
[23] R. Tadeusiewicz. New Trends in Neurocybernetics.
Computer Methods in Materials Science, 10:1–7, 2010. [24] R. Tadeusiewicz. Place and Role of Intelligent Systems
in Computer Science. Computer Methods in Materials
Science, 10:193–206, 2010.
[25] R. Tadeusiewicz. How Intelligent Should Be System for
Image Analysis?, volume 339. Springer Verlag, Berlin, Heidelberg, New York, 2011. Preface to book: H. Kwas-nicka, L.C. Jain (Eds.): Innovations in Intelligent Image Analysis. Studies in Computational Intelligence.
[26] R. Tadeusiewicz. Introduction to Intelligent Systems.
CRC Press, Boca Raton, 2011. In book: B.M.
Wil-amowski, J.D. Irvin (Eds.): The Industrial Electronics Handbook Intelligent Systems.
[27] R. Tadeusiewicz and J. Morajda. Artificial
Intelli-gence Methods. Cracov University of Economics Pub-lishing House, Krakow, 2012. Chapter in book: Lula P., Paliwoda-Pekosz G. (eds.): Analysis and Data Process-ing Computer Methods.
[28] B. Tudu, A. Jana, A. Metla, D. Ghosh, N. Bhat-tacharyya, and R. Bandyopadhyay. Electronic nose for black tea quality evaluation by an incremental RBF
net-work. Sensors and Actuators B: Chemical, 138:90–95,
2009.
[29] B. Wang, S. Xu, and D.-W. Sun. Application of the electronic nose to the identification of different milk
fla-vorings.Food Research International, 43:255–262, 2010.
[30] C. Wongchoosuk, A. Wisitsoraat, A. Tuantranont, and T. Kerdcharoen. Portable electronic nose based on
car-bon nanotube-SnO2 gas sensors and its application for
detection of methanol contamination in whiskeys.