Voltage-MPPT Controller Design of Photovolatic Array
System Using Fuzzy Logic Controller
Faridoon Shabaninia
*, Milad Molazemhosseini, Seyed Hamidreza Abbasi
School of Electrical and Computer Engineering, Shiraz University, Iran *Corresponding Author: [email protected]
Copyright © 2014 Horizon Research Publishing. All rights reserved
Abstract
In this article a fuzzy logic controller is proposed to control the output voltage of a photovoltaic (PV) system while tracking the maximum power point (MPP) of the system. The PV system usually consists of: a PV array that converts solar energy to electrical energy, a DC/DC converter that converters low dc voltages produced by the PV array to a high dc voltage. General design of the buck-boost converter-load system is presented with Matlab/Simulink. In the FLC, different fuzzy membership functions are used and the results are compared with each other. The effects of the different fuzzy membership functions and the PV module parameters on the controller are also compared. Results are compared with typical hill-climbing methods.Keywords
Component, Photovolatic System, MPPT, Fuzzy Controller, Hill-Climbing Algorithm, MOSFET1. Introduction
Because of the demand for electric energy and environmental issues such as pollution and the effects of global warming, renewable energy sources such as sun, wind, water, oceans and etc. are considered as an option for generating clean energy technologies. Among them, sun power is the most important one due to its wide and easy reachability and relatively easy way to handle. Photovoltaic (PV) cells are one way to control this unlimited source of energy and convert them to electricity.
PV modules still have relatively low conversion efficiency; Due to the variations in commanding parameters of a PV cell such as irradiation, temperature and etc. the output voltage and power may vary with time. Therefore, controlling maximum power point tracking (MPPT) For the solar array is essential in a PV system. In addition to MPPT control of PV arrays, PV systems should have the ability to maintain specific voltage.
The PV array has a particular operating point that can supply the maximum power to the load which is generally called maximum power point (MPP). The maximum power
point has a non-linear locus where it varies according to the solar irradiance and the cell temperature [1].
To boost the efficiency of PV system, the MPP has to be tracked followed by regulating the PV panel to operate at MPP operating voltage point, thus optimizing the production of electricity. This process can draw as much power as possible that the PV panel can produce. There are several methods that have been widely implemented to track the MPP. The most widely used methods are Perturb and Observe (P&O), incremental conductance and three-point weight comparison. The drawback of this technique is mainly two. The first and main one is that they can easily lose track of the MPP if the irradiation changes rapidly [2], In case of step changes they track the MPP very well, because the change is instantaneous and the curve does not keep on changing. The other handicap of this method is the oscillations of the voltage and current around the MPP in the steady state [2], [3]. This is due to the fact that the control is discrete and the voltage and current are not constantly at the MPP but oscillating around it.
In this paper, fuzzy controller is used to track the MPP point and maintain the output voltage at desired level bu changing the pulse width modulator (PWM) duty cycle until the criteria for the MMP satisfied.
2. Modeling of PV Array
The building block of PV arrays is the solar cell, which is basically a p-n junction that directly converts light energy into electricity: it has an equivalent circuit as shown below in Fig 1.
The current source 𝐼𝐼𝑝𝑝ℎ represents the cell photo current;
𝑅𝑅𝑗𝑗is used to represent the non-linear impedance of the p-n
junction; 𝑅𝑅𝑠𝑠ℎand 𝑅𝑅𝑠𝑠are used to represent the intrinsic series
and shunt resistance of the cell respectively. The PV mathematical model used to simplify our PV array is represented by the equation:
𝐼𝐼 = 𝑛𝑛𝑝𝑝𝐼𝐼𝑝𝑝ℎ− 𝑛𝑛𝑝𝑝𝐼𝐼𝑟𝑟𝑠𝑠�exp �𝐾𝐾𝐾𝐾𝐾𝐾 ∗𝑞𝑞 𝑛𝑛𝑉𝑉
𝑠𝑠� − 1� (1)
the number of cells in parallel; q is the charge of an electron; 𝑘𝑘 is the Boltzmann’s constant; A is the p-n junction ideality factor; T is the cell temperature (K);𝐼𝐼𝑟𝑟𝑠𝑠 is the cell reverse
[image:2.595.79.283.135.270.2]saturation current.
Figure 1. Equivalent circuit of PV
The cell reverse saturation current 𝐼𝐼𝑟𝑟𝑠𝑠 varies with
temperature according to the following equation: 𝐼𝐼𝑟𝑟𝑠𝑠 = 𝐼𝐼𝑟𝑟𝑟𝑟[𝐾𝐾𝐾𝐾
𝑟𝑟]
3exp �𝑞𝑞𝐸𝐸𝐺𝐺
𝐾𝐾𝐾𝐾 � 1 𝐾𝐾𝑟𝑟−
1
𝐾𝐾�� (2) Where 𝐾𝐾𝑟𝑟is the cell reference temperature, 𝐼𝐼𝑟𝑟𝑟𝑟 is the cell
reverse saturation temperature at 𝐾𝐾𝑟𝑟and 𝐸𝐸𝐺𝐺is the band gap
of the semiconductor used in the cell.
The temperature dependence of the energy gap of the
semiconductor is given by [4]:
𝐸𝐸𝐺𝐺= 𝐸𝐸𝐺𝐺0− 𝛼𝛼𝐾𝐾 2
𝐾𝐾 + 𝛽𝛽 (3) The photo current 𝐼𝐼𝑝𝑝ℎ depends on the solar radiation and cell temperature as eq.4:
𝐼𝐼𝑝𝑝ℎ = [𝐼𝐼𝑠𝑠𝑠𝑠𝑟𝑟 + 𝐾𝐾𝑖𝑖(𝐾𝐾 − 𝐾𝐾𝑟𝑟)]100 (4)𝑠𝑠
where𝐼𝐼𝑠𝑠𝑠𝑠𝑟𝑟 is the cell short-circuit current at reference
temperature and radiation,𝐾𝐾𝑖𝑖 is the short circuit current
temperature coefficient, and S is the solar radiation in mW/cm2. The PV power can be calculated using eq.5 :
𝑃𝑃 = 𝑉𝑉𝐼𝐼 = 𝑛𝑛𝑝𝑝𝐼𝐼𝑝𝑝ℎ𝑉𝑉 �𝐾𝐾𝐾𝐾𝐾𝐾 ∗𝑞𝑞 𝑛𝑛𝑉𝑉
𝑠𝑠− 1� (5)
[image:2.595.109.508.401.549.2]There is a unique point on the curves of a PV array, called the maximum power point (MPP), at which the array operates with maximum efficiency and produces maximum output power. However, the location of the MPP in the I–V plane is not known a priori. It must be located, either through model calculations or by a search algorithm. The situation is further complicated by the fact that the MPP depends in a nonlinear way on irradiance and temperature, as illustrated in Fig 2 and Fig 3.
[image:2.595.106.507.519.725.2]Figure 2. P-V characteristic of PV cell for different irradiance
The peak point of P-V diagram is the MPP. As it’s shown in Fig. 2, MPP changes as irradiance varies during the day. The same is correct for temperature as shown in fig.3. as it is shown, MPP changes during the day and controlling the output power of the cell so that the it remains at its maximum point.
3. Buck-Boost Converter
DC-DC converters can be used as switching mode regulators to convert an unregulated dc voltage to a regulated dc output voltage.
[image:3.595.328.541.75.144.2]The regulation is normally achieved by PWM at a fixed frequency and the switching device is generally BJT, MOSFET or IGBT. The minimum oscillator frequency should be about 100 times longer than the transistor switching time to maximize efficiency. This limitation is due to the switching loss in the transistor. Circuit of a buck-boost converter is shown in fig.4.
Figure 4. Equivalent circuit of a PV cell
Duty cycle of the buck-boost converter, i.e. 𝐷𝐷, is presented in eq.6:
𝑉𝑉𝑜𝑜𝑜𝑜𝑜𝑜
𝑉𝑉𝑖𝑖𝑛𝑛 =
𝐷𝐷
1 − 𝐷𝐷 (6) The input source flows through the inductor L. When IGBT is turned off during “off” state, the energy stored in the inductor L will be transferred to the load until the next “on” state. By varying the duty cycle D, the output voltage is changed accordingly. The duty cycle D, however can be delivered by fuzzy controller.
4. Fuzzy Controller
Most of the methods for MPPT tracking will not respond quickly to rapid changes in temperature or irradiance. Therefore the fuzzy control algorithm is capable of improving the tracking performance [5-6]. The block diagram of fuzzy logic controller (FLC) is shown in Fig.5. The fuzzy logic consists of three stages: fuzzification, inference system and defuzzification. Fuzzification comprises the process of transforming numerical crisp inputs into linguistic variables based on the degree of membership to certain sets.
The two FLC input variables are usually the error “e” and change of error i.e.” de”. The behavior of a FLC depends on the shape of membership functions of the rule base.
Figure 5. diagram of fuzzy logic controller
The error “e” is chosen as ∆𝑉𝑉∆𝑃𝑃 because it is zero at the MPP, also ∆𝑉𝑉 is zero when out voltage meets the desired voltage. Then “e” and “de” are defined as follows:
𝑒𝑒 =𝑉𝑉(𝑘𝑘) − 𝑉𝑉(𝑘𝑘 − 1)𝑃𝑃(𝑘𝑘) − 𝑃𝑃(𝑘𝑘 − 1) (7) 𝑑𝑑𝑒𝑒 = 𝑒𝑒(𝑘𝑘) − 𝑒𝑒(𝑘𝑘 − 1) (8) The output of the fuzzy logic converter is change in the duty ratio of the power converter.
4.1. Fuzzification
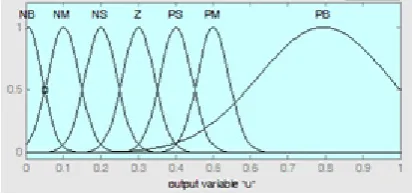
[image:3.595.327.540.393.498.2]The membership function values are assigned to the linguistic variables using seven fuzzy membership function called negative big (NB), negative medium (NM), negative small (NS), zero (ZE), positive small (PS), positive medium (PM),positive big (PB). Fig.6 and fig.7 show the membership function assigned to inputs and output.
Figure 6. membership functions for input “e” and “de”
Figure 7. membership functions for output.
4.2. Inference Engine
Mamdani’s method, is used with Max-Min operation fuzzy combination. Fuzzy inference is based on fuzzy rule base system.
Table-1 shows the rule table of fuzzy logic controller.
[image:3.595.330.537.525.622.2]The last stage of the fuzzy logic control is the defuzzification. In this stage the output is converted from a linguistic variable to a numerical crisp one again using membership functions. The defuzzification method used is center of area method (COA).
Table 1. rule base of fuzzy controller
E/dE NB NM NS ZE PS PM PB
NB NB NB NB NB NM NS ZE
NM NB NB NB NM NS ZE PS
NS NB NB NM NS ZE PS PM
ZE NB NM NS ZE PS PM PB
PS NM NS ZE PS PM PB PB
PM NS ZE PS PM PB PB PB
PB ZE PS PM PB PB PB PB
5. Simulation
PV model together with fuzzy controller is simulated in MATLAB/Simulink is shown in fig.8. changes of voltage and power are calculated and fed into FLC in order to obtain the duty cycle for IGBT.
[image:4.595.69.550.157.578.2]Some of the simulation parameters are shown in table 2.
Table 2. some parameters of simulation
Filter inductance 0.2mHO
Filter capacitance 0.002f
Output resistance 600 ohm
temperature 25 C
Irradiance 400
[image:4.595.78.526.338.715.2]Vref 320
Figure 8. simulated model of PV added FLC.
[image:4.595.92.520.514.737.2]6. Simulation Results
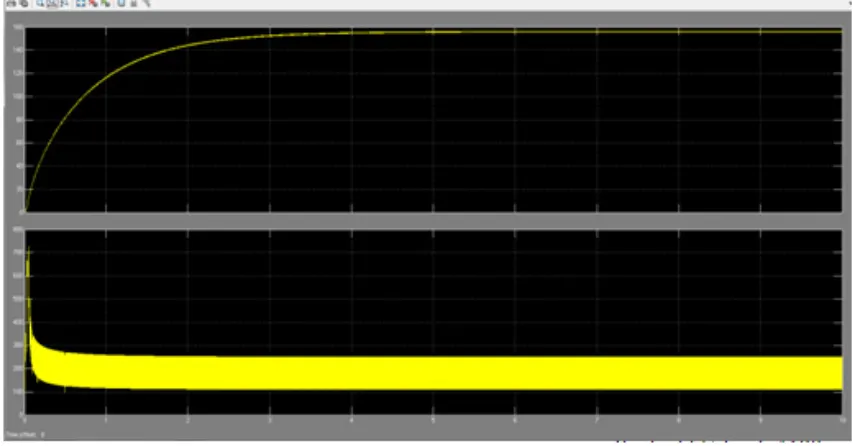
[image:5.595.95.519.298.653.2]Fig. 9 shows the regulated output power and unregulated power. It is clear that FLC successfully track the MPP, and maintain it at its peak, while uncontrolled output power changes around its peak and varies so much. This condition is not suited for any use, while MPPT algorithm maintains output power fixed at its maximum.
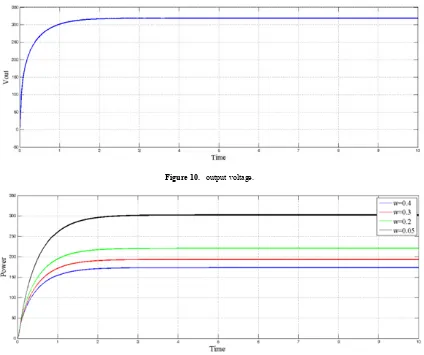
Fig.10 shows the output voltage. As it is clear, output voltage is nearly at the desired voltage level.
6.1. Effect of Membership Functions
Because the output of FLC is the duty ratio of IGBT, any changes in Duty ratio will affect the MPP of PV. Specially those membership functions that deal with “PB” and “NB”. In this section, membership function has changed from Gaussian to triangular and trapezoid to observe the effect of
membership function. Also parameter “w” of Gaussian membership functions has been changed and results are plotted in fig. 11.
As it is shown, with “w” increased, i.e. width of the Gaussian membership function increase in the region of “PB” and “NB”, MPP increased and reaches near its actual values. Because the duty ration increases and causes the controller to increase the power.
7. Conclusions
As simulations shows, FLC could use to determine required PWM to feed to MOSFET in order to regulate output voltage of PV systems so that system could operates at its maximum output power. In comparison to other MPPT methods, FLC track MPP more stable, while it could also regulates output voltage by calculating duty cycle.
Figure 10. output voltage.
[image:5.595.99.517.305.459.2]REFERENCES
[1] S.Lalouni, D. Rekioua, T. Rekioua, and E. Matagne, ―Fuzzy
logic control of stand photovoltaic system with battery storage‖, Journal of Power Sources, Volume 193, Issue2, 5
September 2009, pp. 899
[2] N. Femia, G. Petrone, G. Spagnuolo, M. Vitelli, "Optimizing sampling rate of P&O MPPT technique," in Proc. IEEE PESC, 2004, pp. 1945- 1949.
[3] N. Femia, G. Petrone, G. Spagnuolo, M. Vitelli,
"Optimization of perturb and observe maximum power point tracking method," IEEE Transactions on Power Electronics, vol. 20, no. 4, pp. 963-973, July 2005.
[4] http://ecee.colorado.edu/~bart/book/eband5.htm.
[5] M.S. Ait Cheikh, C. Larbes, G. F. Tchoket Kebir, and A. Zerguerras, Maximum power point tracking using a fuzzy logic control scheme‖, Revue des energies Renouvelables,
Vol. 10, 2007, pp. 387-395.