Journal of Chemical and Pharmaceutical Research, 2013, 5(4):160-170
Research Article
CODEN(USA) : JCPRC5
ISSN : 0975-7384
Synthesis and characterization of polydentate ligand and its metal complexes
Faliah Hassan Ali Al-Jeboori
a, Mohamad Jaber Al-Jeboori
b, Kafa Khalaf Hammud
a*, Haki
Ismail Ashour
aand Jassim. Mahdi Mohammad
aa
Ministry of Science and Technology, Baghdad, Iraq
b
College of Education–Ibn–AL–Haitham, Baghdad University, Baghdad, Iraq
_____________________________________________________________________________________________
ABSTRACT
The reaction of 2,6- diformyl- 4- methyl phenol with [cystamine] (2- mercapto ethyl ammonium chloride) in (1: 2) mole ratio gave 2,6- di- [2- mercapto- ethyl- imino)- methyl] 4- methyl phenol pentadent ligand with NOS donor atoms is formed [H3L1]. Also neutral complexes of this ligand with Cu (II), Co (II), Zr (II) and La (III) were prepared. The ligands and complexes were characterized by elemental microanalysis (C.H.N), FT-IR, U.V- Vis, ( 1H, 13 C, 1H–1H, 1H–13C ) NMR and mass spectroscopies a long with molar conductivity measurements from the above data. The proposed molecular structure for Cu (II) or Zr (II) with the ligand is square planar while La (III) and Co (II) adopted octahedral structure.
Keywords: NOS donor, ligand, Cu (II), Zr (II), La (III), Co (II), polydentate, synthesis.
_____________________________________________________________________________________________
INTRODUCTION
Schiff bases have a chelating structure and are in demand because they are straight forward to prepare and are moderate electron donors with easily-tunable electronic and steric effects thus being versatile. [1] There is a considerable interest in the design and synthesis of ligands consisting of both soft and hard donors to accommodate metal ions for fine- tuning their properties. According, unsymmetrical polydentate ligands with a nitrogen, oxygen and sulfur donor atoms [referred to as NSO ligands] have received much attention recently, due to the distinct trans- effect of these donors. [2] Furthermore, hetero-tridentate NSO ligands resulted from the combination of NOS displaying unique feature in manipulating the catalytic activity on polymerization. [3]
The great interest in synthetic macrocycles and their corresponding metal complexes is related to the fact they can mimic naturally- occurring macrocyclic molecules in their structural features. The formation of macrocyclic complexes depends significantly on the dimension of the internal cavity, on the rigidity of macrocycle, on the nature of its donor atoms and on the complexing properties of the counterion. The syntheses of the macrocyclic ligands are generally carried out in the presence of a suitable salt. [4]
EXPERIMENTAL SECTION
Chemicals: all common laboratory chemicals and reagents were from Aldrich and Fluka and have been used
without further purifications.
Measurements:
Mass spectra for ligands and some complexes were obtained by (+) Laser adsorption technique using BRUKER DALTONICS. All isotopes distribution was compared to a computer generated distribution pattern. The spectra were recorded at Queen Mary, London University / United Kingdom.
1 H-, 13 C-, 1 H - 1 H, and 1 H- 13 C correlated NMR spectra for the ligands and some complexes were recorded in
DMSO-d6 , D2O using a Brucker 400 MHZ , Ex 400 MHZ and a Jeol 270 MHZ instruments with a
tetramethylsilane (TMS) as an internal standard . The samples were recorded at Queen Mary/ University of London/United Kingdom. Elemental microanalyses were performed on a (C.H.N) analyzer, from Herause (Vario EI) at Free Berlin University/ Germany.
Synthesis of ligands and precursor:
- Synthesis of the precursor [2, 6- diformyl – 4- methyl phenol]:[5]
To a solution of p-cresol (10 mmole) in (50 ml) acetic acid, hexamethylene tetraamine (20 mmole) and (100 mmole) of paraformaldehyde were added. The mixture was allowed to stirred continuously until the light brown viscous solution was obtained then heated to (70- 90ºC) for 2 hrs. The solution was cooled to room temperature and concentration H2SO4 (10 ml) carefully added. The resulting solution was refluxed for 30 min. and then on treatment
with distilled water (400 ml) a light yellow precipitate was formed which was stored overnight at (40ºC). The yellow product was isolated by filtration and washed in small a mount of cold methanol more pure product was obtained by means a recrystallization from toluene, yielded (35%), m. p(132- 134ºC). Elemental microanalysis for this precursor was C% 65.85 (65.66), H% 4.91 (4.87).
- Synthesis of ligand (2,6 –di-(2-mercapto-ethyl Azomethine) - 4 – methyl Phenol) [H3L1]:
A solution of (2, 6- diformyl -4 methyl phenol] (0.01 mole) in methanol (15 ml) was added gradually to a solution of 2- mercapto ethyl ammonium chloride (0.02 mmole) dissolved in (15 ml) methanol. The reaction mixture was allowed to reflux for 3 hrs. A yellow precipitate was observed after refluxing for one hour. The reaction mixture was cooled to room temperature, then solvent was removed light orange solid was obtained (259ºC, 90%).
Scheme-1-: Synthesis of 2, 6- diformyl – 4- methyl phenol and 2,6 –di-(2-mercapto-ethyl Azomethine) - 4 – methyl Phenol
- Synthesis of the Ligand – Metal complexes:
(1.4 mmole) of metal ion Cu (II), Co (II), Zr (II), or La (III)] salt dissolved in (10 ml) of ethanol was added dropwise to a solution of the ligand [H3L1] (0.7 mmole) dissolved in (15 ml) methanol. The reaction mixture was stirred, and
pH was adjusted to ca. 9 by adding methanolic potassium hydroxide. The reaction mixture was allowed to reflux for
CH3
OH
AcOH, CH2O, Hexamethylenetetraamine
stirring 2hrs, (70-90)oC
CH3
OH
CHO OHC
CH3
OH
CH HC
HS NH
2
. HCl
SH
N N
______________________________________________________________________________
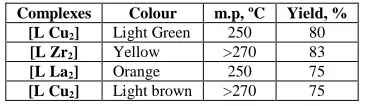
2 hrs. A precipitate was formed, which was filtered off, washed several times with absolute ethanol and dried. Some physical properties of the prepared complexes showed in table (1).
RESULTS AND DISCUSSION
In general the ligand contained three labile protons [H3L1] by removing these protons an anionic polydentate system
is formed. Acyclic ligand was prepared to change the properties of the ligands from hydrophilic to lipophilic, to change reduction-oxidation behavior of the prepared complexes by imposing different substituents on the backbone.
Synthesis and Characterization of [2,6-diformyl- 4-methyl phenol]:
This compound was obtained in a moderate yield (35 %) as a yellow crystalline solid with m.p (132 – 134) ºC, and was soluble in ethanol, methanol, and water. Also, this compound was characterized by using 1H-NMR and 13 C-NMR spectra (Figure -1- and Figure -2-).
Synthesis and Characterization of the ligand [H3L1]
The ligand which was synthesized from the reaction of [2,6-diformyl-4-methyl phenol ] with cystamine [ 2,mercaptoethyl ammonium chloride] in (1:2) mole ratio showed a good solubility in H2O, DMSO, DMF, EtOH,
and MeOH but not CH2Cl2 or CHCl3. The elemental microanalysis of the product [H3L1] (C13H18N2OS2) (m.p 259 o
C) showed a good agreement with theoretical calculation [C% 55.08 (55.28), H% 6.42 (6.43), N% 9.70 (9.90)] (Table -2-). The electronic spectrum of the ligand [H3L1] exhibits two high intense absorption bands of (285, 365)
nm attributed to π→π* and n→π* transitions respectively (table-3-).
The I.R spectrum for the ligand [H3L1] (Table 4-) showed double bands are appeared at (1718, 1570) cm-1
corresponding to asymmetric and symmetric stretching of the (C=N) imine group. The two imine groups are non- equivalents due to intramolecular hydrogen bonding. (N … H-O). The medium band at (1012) cm-1 is assigned to υ (C-S) stretching. These results are in agreement with that reported in literature. [6] While the band appeared at (1263) cm-1 is assigned to υ (C –O) stretching band. Also the IR spectrum of the ligand showed characteristic band at (2374) cm-1 attributed to the υ (S- H) stretching. The band at (2939) cm-1 assigned to υ (C –H) stretching (Table -4-).
The NMR spectra of [H3L1] (Figure -3- , Figure -4- , Figure -5- , Figure -6- , and Figure -7-) as all indicated the
presence of several species in the solution. It's well establish that in solution the sulfur of thiol or thiolate group is nucleophilic in the free ligand and to be isolated where cyclic products from intramolecular sulfur attack on the imine are obtained. [7-9] As a result of that the (I, II, III) form can be exist in the solution.
I II III
The spectrum shows chemical shift at (δ11.02 ppm, 1H,br) attributed to the proton of (O-H) group adjacent to (C1),
(δ10.08 ppm, 1H,S) assigned to the azomethine (C=N-H), and (δ 8.32ppm, 5H, S) can be attributed to the iminic groups in forms I, II, the protons of iminic group involved in hydrogen bonding (I, II) (Figure -3-). The resonance at (δ8.32 ppm, 5H) has been decreased and appeared with two protons ratio upon addition of D2O to the solution
(Figure -4-). This experiment proved the assignments of the chemical shift, and the presence of many species in solution. The chemical shift at (δ 7.80 ppm, 2H), which is due to aromatic protons of (C3, C5-H), appeared as
expected as singlet. The signal at chemical shift (δ 2.40 ppm, 3H) is assigned to methyl group protons (C7-H), while
the signal at (δ 5.67ppm) assigned to the (C13-H) of cyclic form. [10,11]
The 13 C- NMR spectrum of 2, 6 -diformyl-4-methyl phenol in DMSO-d6 solvent (Figure -2-) shows chemical shift
carbon atom (C1) (C-O), while (δ 137.89, 129.81, 121.11, ppm) are assigned for carbon aromatic ring atoms (C3,5,
C4, C2,6) respectively, and (δ 20.10 ppm) assigned to methyl group carbon atom (C7).
The laser adsorption (+) mass spectrum of the ligand [ H3L1] (Figure -8-) shows the parent ion peak at ( M/Z ) =
(282.59), which corresponds to [M+], other fragments and their relative abundance and fragmentation sequence is shown in the scheme below.
C1 3H1 8N2O S2
M / Z = 2 8 2 .5 9 ( 8 5 % ) - 3 4
S H2
- 2 6 C2H2
C1 1H1 4N2O S
M / Z = 2 2 2 . 5 8 ( 1 5 % )
- 1 5 N H
C1 1H1 3N O S
M / Z = 2 0 7 .5 5 ( 1 0 0 % )
- 3 4 S H2
C1 1H1 1N O
M / Z = 1 7 3 .5 5 ( 1 2 % )
- 1 3 C H
C9H9N O
M / Z = 1 4 7 .5 3 ( 1 8 % )
- 1 5 N H
C9H8O
M / Z = 1 3 2 . 5 0 ( 1 0 % )
- 4 5 C2H5O
C7H3
M / Z = 7 8 .4 4 ( 6 % )
- 2 7 C2H3
C5
M / Z = 6 0 .4 4 ( 4 % ) C1 3H1 6N2O S
M / Z = 2 4 8 .6 0 ( 6 0 % )
Scheme-3-:The Fragmentation Sequence of The Ligand [H3L1]
Synthesis and Characterization of [H3L1] Complexes
The complexes (Table -1-) that prepared in a good yield (75-83) % showed the no solubility in H2O but not DMSO
______________________________________________________________________________
The infrared spectra of the ligand and its metal ion complexes (Table -4-) had indicated presence a weak bands at the ranges (2920- 2960) cm-1 which are attributed to the stretching vibration of υ (C-H) aromatic. The double bands at (1570, 1718) cm-1 corresponding to asymmetric and symmetric stretching υ (C=N) in free ligand [H3L1] are
shifted to lower frequency and appeared at (1653, 1554), (1618, 1674), (1627, 1554) and (1637) for compounds [L Cu2], [L Co2], [L Zr2] and [L La2] respectively indicating the deportonation of the (O-H) of the phenol group. [12]
The disappearances of intramolecular bonding and the appearance of two bands in I.R spectra of the complexes [L Cu2], [L Co2] and [L Zr2] indicated that two iminic groups are non- equivalents but [L La2] complex showed the two
iminic group equivalent as a single band at (1637) cm-1. The shift of (C=N) to lower wave number can be attributed to delocalization of metal electron density into π- bonding namely (C=C) of the free ligand at (1554) cm-1 and lowering the wave number about (16-40) cm-1 for complexes. These observations are agreement with that reported in literature.[13]
The medium band at (1263) cm-1 assigned to the υ (C-O) stretching for the free ligand is shifted to higher frequency and appeared at (1296) and (1388) cm-1 for complexes [L La2] and [L Co2] respectively and shifted to lower
frequency and appeared at (1238 and 1232) cm-1 for [L Cu2] and [L Zr2] complexes confirming the coordination of
the ligand through oxygen atom to the metal ion. Such results are supported by several reports [8-10]. The medium
υ(C-S) stretching band in the free ligand at (1012) cm-1 was shifted to higher frequency and appeared at (1043, 1070, 1047 and 1151) cm-1 for complexes [L Cu2] [L Zr2] [L La2] and [L Co2] respectively.
This is presumably due to the complex formation with metal ions through sulfur atoms. [12] These results are in agreement with that reported by Mandal and Co- workers. [14] The I.R spectra for complexes showed bands due to υ (OH) and (O-H) at (3446, 3427, 3552, and 3527) cm-1 (broad) and at (825, 869, 848, and 871) cm-1 weak respectively, suggesting the presences of coordinated water.
The I.R spectra of [L M2] complexes exhibited weak absorption band in the ranges (450- 550) cm-1 which are
attributed to υ (M-N), υ (M-O) and υ (M-S) bands (M= metal ion). These bands supported the coordination of the ligand to the metal center through nitrogen, oxygen and sulfur atoms. The bands attributed to the metal- halide are not detected attributed to the metal- halide because these bands are below 370 cm-1. Hence the literature that (Cu-Cl) band at 289 cm-1[11], (Co-Cl) at 306 cm-1 (Zr-Cl) at 298 cm-1 and (La-Cl) at 270 cm-1.
By comparison of the electronic spectrum (Table -3-) of the ligand with copper (II) complex electronic spectrum, it was observed that the spectrum of copper II complex showed three absorption bands, the more intense bands at (273,393) nm are assigned to ligand filed (charge transfer) and the weak band centered at (647) nm is interpreted in terms of square planar structure around the copper II ion.
Scheme -2-: The Synthesis Route of the [H3L1] Complexes
CH3
OH N N
HS SH
[H
3
L]
+ 2 M
n+KOH/MeOH
Reflux
N
2atmospher
CH3
O N
N
S S
M
M
y
y
X
y
y
M = Cu (II), Zr (II) Y=0
M = Co (II), La (III)
Y=H
2O
X=Cl n= +3, +2 : m=+1,-1
m
Table (1): Some physical properties of the prepared complexes
Complexes Colour m.p, ºC Yield, % [L Cu2] Light Green 250 80
[L Zr2] Yellow >270 83
[L La2] Orange 250 75
[L Cu2] Light brown >270 75
Table (2): Elemental Analysis Results of [H3L1] and Its Metal Complexes
Empirical Formula M.Wt Microanalysis found, (Calc.) %
C H N
C13H18N2OS2 282.09
55.08 6.22 9.70 (55.26) (6.43) (9.90)
K[Co2C13H15N2OS2 (H2O)4]Cl 582.89
27.10 4.01 4.95 (26.76) (3.94) (4.80) [Cu2C13H15N2OS2(H2O)2]Cl 519.58
30.52 3.75 5.78 (30.02) (3.65) (5.38)
[Zn2C13H15N2OS2(H2O)2]Cl 486.5
22.45 3.31 5.45 (22.82) (3.18) (5.88)
Calc.: Calculated
Table (3): Electronic spectral data and molar conductance
Compound Wave number Assignments AM (Scm2Mol-1)
nm (cm-1) H3L1
285 265
35085 27397
π→π* n →π*
L' Cu 273 393 647 36630 25445 15455 Charge transfer 2
T1g →2Eg
3.8 L' Co 266 408 541 37591 24509 18484 Charge transfer (c)T
1g(f)→4T1g(p) 4T
1g(f)→4A2g(f)
13.9 L' Zr 381 408 541 26246 24510 18484 Charge transfer Charge transfer 2T 2g →2E1g
11.2 L' La 264 341 301 541 597 647 37878 29325 33222 18484 18281 15455 Charge transfer Charge transfer Charge transfer A2g(f)→ T1g(p)
A2g(f)→ T1g(f)
A2g(f)→ T2g(f)
8.7
Table (4): Infrared spectral data of the ligands and their complexes
Compound (C-S) (C-O) (C=C) (C=N) (S-H) (C-H) (OH) (O-H)
H3L1 1012 1263 1570 1718 2374 2939 3466
[L Cu2]
1043
1085 1238 1554 1654
1554 2922 3446 825 [L Zr2] 1070 1232 1544
1627
1554 2370 2918 3427 869 [L La2] 1047 1388 (1481) 1637 2362 2920 3552 848
[L Co2] (1151) 1296 (1508)
1618
1647 2362 2960 (3527) 871
Table (5): Magnetic moment data (µµµµeff.=B.M.) of solid at 298K and the suggested stereochemical structure of complex.
Complexes
Xg××××10–6
Gram Susceptibility
XM××××10–6
Molar Susceptibility
XA××××10–6
Atom Susceptibility
µµµµeff. B.M.
expt. µµµµeff. B.M calc. Suggested Structure
K[Co2II(L1)
[image:6.595.215.401.89.142.2] [image:6.595.77.546.627.677.2]______________________________________________________________________________
Figure-1-: 1H NMR spectrum for [ 2,6-diformyl-4-methyl phenol ] in DMSO-d 6
[image:7.595.75.538.90.386.2] [image:7.595.78.541.416.728.2]Figure -3-: 1H NMR Spectrum of [H
3L1] in DMSO-d6
Figure -4-: 1H NMR Spectrum of [H
[image:8.595.78.536.393.652.2]______________________________________________________________________________
[image:9.595.77.539.87.339.2]Figure -5-: 1H–1H, 2D Correlated NMR Spectrum of [H 3L1]
Figure -6-: 13C NMR Spectrum of [H
[image:9.595.78.538.369.634.2]Figure -7-: 1H– 13 C, 2D Correlated NMR Spectrum of [H
[image:10.595.78.540.89.303.2]3L1] in DMSO-d6
[image:10.595.76.535.335.665.2]______________________________________________________________________________
Thompson and Bautista reported that the electronic spectra of the complexes of complexes of copper II chloride with (BBTE) ligand are characterized by presence of a broad absorption band in the range (630- 660) nm reverting a distorted square planar structure. [15] According to infrared spectral data, electronic spectrum and molar conductance (Table-4-) in DMSO, which suggested non- electrolyte structure [16, 17], it is suggested that the geometrical structure of copper II ion is square planar structure as depicted.
Electronic spectrum of [L'Co2] complex (Table -3-) showed a band at 266nm is due to charge transfer, while (408,
541)nm are assigned to 4T1g(f)→4T1g (p) and 4T1g(f)→4A2g (f) transitions respectively. These transitions suggest at
octahedral structure of the complex. The brown colour is reported for octahedral Co (II) complexes. On the bases of infrared and electronic spectral data and molar conductance (13.9 Ms/cm) which suggested non- electrolyte complex, it is concluded that the structure of [L Co3] complex is represented as an octahedral structure around the
cobalt ion is depicted.
Magnetic moment (Table -5-) has been determined in the solid state by faraday's method. The magnetic properties of these complexes should provide a testing ground for the oxidation state of the complexes, therefore provides a way of counting the number of unpaired electrons. This should help in predicting the bonding model and electronic structure.
Electronic spectrum of [L La2] complex exhibits six absorption bands at (264, 341, 403, 541, 547, 647) nm. The first
three bands are attributed to charge transfer and the latter three bands are assigned to A2g(f)→T1g (p), A2g(f)→4T1g (f)
and A2g(f)→T2g (f) transitions respectively indicate octahedral structure. On the bases of infrared and electronic
spectral data and molar conductance (8.7 Ms/cm) which suggested non- electrolyte complex it is concluded that the structure of [L La2] complex is represented as an octahedral structure a round the central ion (Table -3-).
The electronic spectrum [L Zr2] complex exhibits three absorption band (Table -3-) at (381, 408, and 541) nm. The
first two bands are attributed to charge transfer and the latter band at 541 nm is assigned to 2B2g→2T1g transition.
This result is in an agreement with previous study for zirconium II complex. [14] The structure of [L Zr2] complex is
suggested to be square planar structure around the zirconium II ion according to the facts that abstracted from data of infrared, electronic spectral data and molar conductance. The proposed square planar structure of the complex is depicted.
Acknowledgement
Our deep grateful thanks are due to Prof. Dr. D. V. Griffith and staff members of the department of Chemistry of Queen Mary, University of London/ United Kingdom for their help.
REFERENCES
[1] Cozzi P, Chem. Soc. Rev. 2004, 33, 410-421.
[2] Garnovskii A; Nivorozhkin, A.; Minkin V, Coord. Chem. Rev. 1993, 126, 1-69. [3] Gomez M; Muller G; Rocamora M, Coord. Chem. Rev. 1999, 769, 193-195. [4] Shi P; Liu Y; Peng S, Organomet. Chem. 2002, 21, 3203-3209.
[5] Ghaudhuri V; Claudio, P; Thoma E, J. Chem. Soc., Dalton Trans. 2000, 569- 575. [6] Golcu A; Tumer M; Demirelli H; Wheatly A, Inorg. Chim. Acta 2005, 358, 1785-1789. [7] Huang W; Gou S; Meing Q, Inorg. Chem. 2001, 40, 1712-1715.
[8] Tyler L; Olmstead M; Masschark P, Inorg. Chim. Acta 2002, 338, 196 –200. [9] Noverom J; Olmstead M, Inorg. Chim. Acta. 1999, 285, 269- 276.
[10]Atkins A; Blake A; Scheoder M, J. Chem. Soc. Chem. Commun, 1993, 353-355. [11] Atkins A; Black D; Ruiz-Ramirez L, J. Chem. Soc. , Chem. Commun, 1996, 457-460. [12]Santokh S; Thompson L; Bridson J, Inorg. Chem. 1993, 32, 32- 39.
[13]Koksal H; Tumer M; Serin S, Synth. React. Inorg. Met. Org. Chem. 1996, 26, 1577-1581. [14]Mandal S; Thompson L; Lee F, Inorg. Chem. 1988, 27, 855-858.
[15]Thompson L ; Bautista D, Inorg. Chim. Acta 1983, 75, 271-275.
![Figure-1-: 1H NMR spectrum for [ 2,6-diformyl-4-methyl phenol ] in DMSO-d6](https://thumb-us.123doks.com/thumbv2/123dok_us/8777543.902307/7.595.78.541.416.728/figure-h-nmr-spectrum-diformyl-methyl-phenol-dmso.webp)
![Figure -3-: 1H NMR Spectrum of [H3L1] in DMSO-d6](https://thumb-us.123doks.com/thumbv2/123dok_us/8777543.902307/8.595.78.536.393.652/figure-h-nmr-spectrum-h-l-dmso-d.webp)
![Figure -5-: 1H–1H, 2D Correlated NMR Spectrum of [H3L1]](https://thumb-us.123doks.com/thumbv2/123dok_us/8777543.902307/9.595.78.538.369.634/figure-h-h-d-correlated-nmr-spectrum-h.webp)
![Figure -7-: 1H– 13 C, 2D Correlated NMR Spectrum of [H3L1] in DMSO-d6](https://thumb-us.123doks.com/thumbv2/123dok_us/8777543.902307/10.595.76.535.335.665/figure-h-c-d-correlated-nmr-spectrum-dmso.webp)
