FPGA BASED MAXIMUM POWER POINT TRACKING CONTROLLER FOR
PHOTOVOLTAIC SYSTEM
MUKARRAM ABDULJALIL MAHMOOD ALMUHAYA
A Project report submitted in partialfull fillment of the requirement for the award of the Degree of Master of Electrical Engineering
Faculty of Electrical and Electronic Engineering University Tun Hussein Onn Malaysia
ABSTRACT
TABLE OF CONTENTS
TITLE PAGE i
DECLARATION ii
DEDICATION iii
ACKNOWLEGDEMENT v
ABSTRACT vi
TABLE OF CONTENTS vii
LIST OF TABLES xi
LIST OF FIGURES xii
LIST OF ABBREVIATIONS xiv
LIST OF APPENDICES xv
CHAPTER 1 INTRODUCTION
1.1 Project Background 1
1.2 Problem statement 2
1.2.1 Project Objectives 3
1.3 Introduction of the Photovoltaic system 3
1.4 Maximum Power Point Tracking (MPPT) 5
1.5 VHDL Programming 6
1.6 Finite State Machine Design Using VHDL 7
CHAPTER 2 LITERATURE REVIEW
2.1 Introduction 10
2.2 Photovoltaic performance 10
2.2.1 PV characteristics 11
2.2.1.1 Maximum Power (PMAX), Current at PMAX (IMP), Voltage at PMAX (VMP)
2.2.1.1.1 Nomenclature 12
2.2.1.2 Fill Factor (FF) 13
2.3 PV materials 13
2.3.1 Crystalline materials 15
2.3.1.1 Single-crystal silicon 12
2.3.1.2 Poly-crystalline silicon 12
2.4 MPPT Algorithms 16
2.4.1 Perturb and Observe 16
2.4.2 Constant Conductance 19
2.5 Field Programmable Gate Array (FPGA) 22
2.5.1 FPGA Architectures 23
2.5.2 ALTERA Technology 23
2.5.2.1 ALTERA DE2 board 24
2.5.2.2 Block Diagram of the DE2 Board 26 2.5.2.3 Clock circuitry of Altera DE2-Cyclone II
EP2C35F672C6
30
2.6 Case Studies 31
2.6.1 Hopfield Neural Network Optimized Fuzzy Logic Controller for Maximum Power Point Tracking in a Photovoltaic System
31
2.6.2 Artificial Intelligence Based P&O MPPT Method for Photovoltaic Systems
32
2.6.3 FPGA Based Maximum Power Point Tracker Of Partially Shaded Solar Photovoltaic Arrays Using Modified Adaptive Perceptive Particle Swarm Optimization
32
2.6.4 Improvement of A MPPT Algorithm for PV Systems and Its Experimental Validation
32
2.6.5 Maximum Power Point Genetic Identification Function for Photovoltaic System
33
2.6.6 Implementation of FPGA based PID Controller for DC Motor Speed Control System (2010)
2.6.7 Design and Simulation of Stand Alone Photovoltaic Systems (2011)
34
2.6.8 FPGA Based Maximum Power Point Tracker Of Partially Shaded Solar Photovoltaic Arrays Using Modified Adaptive Perceptive Particle Swarm Optimization (2009)
34
2.6.9 Summaries of the previous Research 35 CHAPTER 3 METHODOLOGY
3.1 Introduction 36
3.2 Flow Chart 36
3.3 Project Development 39
3.3.1 Photovoltaic Cell Model 39
3.3.2 Photovoltaic module modeling 41
3.3.3 MPPT Algorithms 44
3.3.3.1 Perturbation and Observation (P&O) Method 44
3.3.3.2 Fuzzy Logic Controller 46
3.3.4 Programming of MPPT using VHDL 51
3.3.5 FSM OF MPPT Controller using Quartus II 52 3.3.6 Developing MPPT using Quartus II 54
3.3.7 Downloading ALTERA DE2 board 54
3.3.7.1 Configuring the FPGA in JTAG Mode 54 3.3.7.2 Configuring the EPCS16 in Active Serial (AS) Mode
55
CHAPTER 4 SIMULATION RESULTS
4.1 Introduction 58
4.2 The output graph for Typical PV module by Matlab Simulink in the optimal condition with constant input
59
4.3 The Input graph for PV module by Matlab Simulink in the Normal Condition with variable input
62
4.2.1 Input PV module 62
Quartus II
4.5.1 Comparison results of MPPT between Matlab Simulink and QuartusII current input
64
4.5.2 Comparison between Matlab Simulink Power and Quartus Simulink Power output
65
4.5.3 Comparison results between MatlabSimulink and QuartusII Simultion voltage output
66
4.6 Discussion 67
CHAPTER 5 CONCLUSION AND RECOMMEDATIONS
5.1 Conclusion 69
5.2 Recommendations 70
REFERENCES 72
LIST OF TABLES
LIST OF FIGURES
1.1. Classification of PV systems 4 1.2. Stand alone PV systems with load
5 1.3. Block diagram for a Moore-type FSM
7 1.4. Model for VHDL implementations of FSMs
9 2.1. Maximum Power for an I-V curve
11 2.2. Photovoltaic module characteristics showing the Fill Factor
13 2.3. BP SX 150 I-V Curves
14 2.4. Current, power, and power derivative of the PV panels vs. voltage
16 2.5. P&O MPPT operation Flow Chart
18 2.6. Constant conductance MPPT operation Flow Chart
20
2.7. ALTERA DE2-Cyclone II EP2C35F672C6 board 25
2.8. Block diagram of Altera DE2-Cyclone II EP2C35F672C6 board 26
2.9. Block diagram of the clock distribution 30
3.1. Flow Chart for PART 1 37 3.2. Flow Chart for Part 2 38 3.3. Equivalent Circuit Modules of Photovoltaic System 40 3.4. Masked block diagram of the modeled solar SX -150 PV module 43 3.5. Subsystem implementation of the modeled solar BSX-150 PV module
44 3.6. P&O MPPT operation Flow Chart 45 3.7. P & O implementation block diagram circuit using Matlab Simulink 46
3.8. Four basic elements for Fuzzy Logic 47
3.9. The relationship between the input and output 47
3.10. Membership function for differential power (deltaP) 48 3.11. Membership function for differential current (deltaI) 48 3.12. Membership function for voltage reference (delta )
3.14. Surface viewer 49 3.15. Rules editor
50 3.16. P & O implementation block diagram with Fuzzy Logic Controller
50 3.17. Basic VHDL code structure
51 3.18. Black Box diagram for the FSM of MPPT
52 3.19. FSM of MPPT
53 3.20. Vector waveform file
54 3.21. The JTAG configuration scheme
55 3.22. The AS configuration scheme
56 3.23. Pin planner assign in Quartus II software
56
3.24. Downloading process of MPPT development on Quartus II software 57
4.1. PV module output Power With Constant input T=25 &Ir=1 59
4.2. PV module output Power With Constant input T=25 &Ir=0.8 60
4.3. PV module output Current With Constant input T=25 & Ir=1 60
4.4. PV module output Current With Constant input T=25 & Ir=0.8 61
4.5. MPPT controller Output Voltage reference With Constant input T=25 & Ir=1 61 4.6. PV Module Output Voltage reference With Constant input T=25 & Ir=0.8 61
4.7. Input irradiance for PV module 62 4.8. Input cell temperature for PV module 62 4.9. Simulation results of MPPT controller by Quartus II 63 4.10. MPPT input Current from Matlab simulink 64 4.11. MPPT input Current from Quartus II 64 4.12. MPPT Output power from Matlab Simulink 65 4.13. MPPT Output power from S Quartus II 65
LIST OF ABBREVIATIONS
AS - Active Serial
ASIC - Application Specific Integrated Circuit
CPLD - Complex Programmable Logic Device
DC - Direct Current
DSP - Digital Signal Processing
EEPROM - Electrically Erasable Programmable Read-Only Memory
FPGA - Field Programmable Gate Array
HDL - Hardware Description Language
JTAG - Joint Test Action Group
LCD - Liquid Crystal Display
LED - Light Emitting Diode
PLD - Programmable Logic Device
RAM - Random Access memory
SDRAM - Compressor-Decompressor
SOC - System On Chip
SRAM - Static Random Access memory
USB - Universal Serial Bus
VHDL - VHSIC Hardware Description Language
LIST OF APPENDICES
A. Gantt Chart
B. The MPPT VHDL code.
CHAPTER 1
INTRODUCTION
1.1 Project Background
Photovoltaic technology is projected to supply seventy percent of the world’s energy hunger by 2030 and create a new industry far exceeding today’s global automotive industry. Yes, the future for photovoltaic looks bright, global leading banks forecast a yearly growth of 25 to 35 per cent a year until 2020 and new jobs created exceeding five million globally. It is perfect time for local stakeholders to enter the burgeoning industry and establish along the PV value chain. For the industry, the race for grid when conventional electricity cost is at par with photovoltaic produced electricity cost is on. With the strong commitment from the Government of Malaysia to pursue green technologies, Malaysia is poised to play an increasingly important role in the global manufacturing of PV products benefitting the local industry.
Conventionally, the output from a PV solar cell alone is not good enough to input into an electricity bank or in to the main grid because its output is not constant in terms of voltage. This raises a need to design a controller which can calculate and extract the maximum power point at any instant from the solar cells.
constant voltage, and artificial intelligence techniques. Conventional methods, as PID, guarantee acceptable performances, A MPPT controller is a controller that includes elements with those three functions. Whereas fuzzy logic controller (FLC) based on fuzzy logic (FL) provides a mean of converting a linguistic control strategy based on expert knowledge into an automatic strategy [1].
Field Programmable Gate Array (FPGA) based systems provide a number of run-time advantages over the sequential machines such as a microcontroller. Moreover, concurrent operations may be executed continuously and simultaneously faster than Digital Signal Processing (DSP) device. Since the functions of various components can be integrated onto the same chip, FPGAs offer lower implementation cost than DSPs that can perform only DSP-related computations. In addition, FPGAs can provide equivalent or higher performance with the customization potential of an ASIC [2]. As FPGAs can also be reprogrammed at any time, repairs can be performed in-situ while the system is running providing a high degree of robustness. Beside robustness, this re-programmability can also provide a high level of flexibility: the MPPT control system can be easily updated or modified even when it is running [2].
1.2 Problem statement
Photovoltaic (PV) is an attractive source of energy. Abundant and ubiquitous, this source is one of the most important renewable-energy sources that has been increasing worldwide year-by year. Unfortunately, PV generation systems have two major problems: -
• The conversion efficiency of electric power generation is very low (from 12% in practical generators up to a maximum of 29%) especially under low irradiation conditions.
Photovoltaic technology is used to produce electricity especially in distributed renewable-energy systems. As the maximum power point (MPP) of a PV power generator depends on array temperature and irradiance, in order to maximize the energy delivered by the PV array it is necessary to track the MPP continuously. In the last decade, several researches have focused on various MPP control algorithms to draw the maximum power of the photovoltaic array. The proposed MPPT is based on the perturbation and observation (P&O) strategy and the variable step method that control the load voltage to ensure optimal operating points of a PV system. The algorithm has been code in VHDL and realized on a generic reconfigurable architecture like FPGA. The implementation of the diagnostic algorithm on a reconfigurable architecture will make it suitable for further modification of functional logic of the processor with minimum programming effort.
1.2.1 Project Objectives
The primary objective of this project is to develop the FPGA based MPPT controller of photovoltaic system.
In addition, this project has various objectives, which comprise of:
1. To design the optimum controller by simulation for the maximum power point tracking.
2. To analyze simulations result of the maximum power point controller tracking.
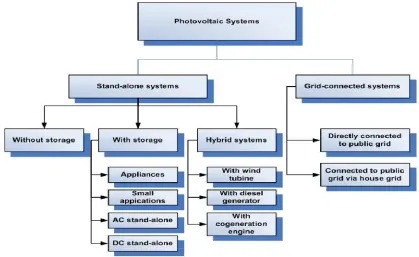
1.3 Introduction of the Photovoltaic system
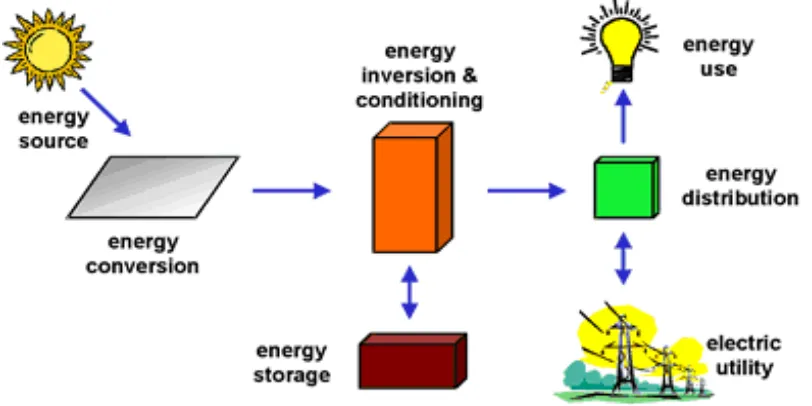
[image:15.595.112.531.473.730.2]Photovoltaic systems are composed of interconnected components designed according to complies specific goals ranging from powering a small device to feeding electricity into the main distribution grid. Photovoltaic systems are classified according to the diagram as Figure 1.1. There are consists of two main general classifications as depicted in the Figure 1.1 which are the stand-alone and the grid-connected systems [3]. The main distinguishing factor between these two systems is that in stand-alone systems the solar energy output is matched with the load demand. The principles of operation for stand-alone is through a PV array produces power when exposed to sunlight, a number of other components are required to properly conduct, control, convert, distribute, and store the energy produced by the array. Meanwhile, it also depending on the functional and operational requirements of the system, in which the specific components required major components such as a DC-AC power inverter, battery bank, system and battery controller, auxiliary energy sources and sometimes the specified electrical load (appliances). Figure 1.2 shows a basic diagram of a photovoltaic system and the relationship of individual components.
Figure 1.2: Stand alone PV systems with load
1.4 Maximum Power Point Tracking (MPPT)
irradiance, panel temperature, short circuit current, open circuit voltage of the PV array, Which the use of prior training data to set the reference signal corresponding to operation at the maximum power point (MPP). This methods present reduced implementation costs, but sub-optimum performance [7-9]. Fuzzy logic is being increasingly used in present times as a convenient tool to model and control systems, which are nonlinear in nature, the solar PV array being no exception. In this project we use a P&O and Fuzzy logic based controller along with instantaneous values of PV voltage and current and peak current control for determining not only the direction of the next perturbation (variation of reference current) but also its magnitude, by which one can enhance both transient and steady-state operation simultaneously.
1.5 VHDL Programming
1.6 Finite State Machine
Finite state machines (FSMs) are generally used as controllers in digital designs. Until now, probably some people have
but there was no real
still don’t have much point but it is possible to using actual hardware
using VHDL. As illustrated the sequential circuits
VHDL. The techniques discussed
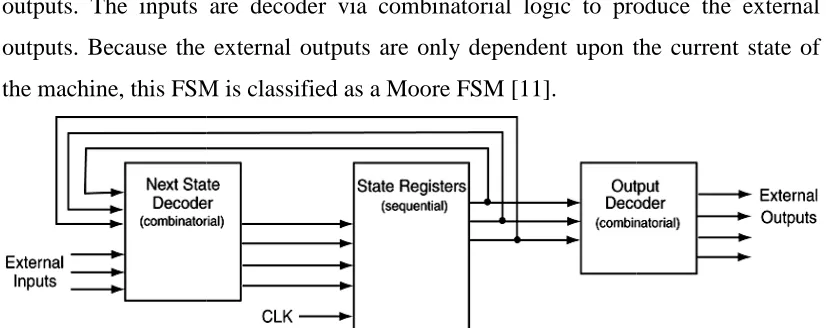
designing relatively complex FSMs which can be used as controllers in circuits. A block diagram for a standard Moore
This diagram looks fairly typical the blocks in the design. The
that uses the current external inputs and the current state of the FSM to decide the next state of the FSM. In other words, the inputs to the Next State Decoder block are decoded and to produce an output that represents the next state of the FSM. The circuitry in Next State Decoder is
elements (flip-flops) in the State Register block. The next state of the FSM when the clock input to the
The state registers block is storage elements that store the present state of the machine. The inputs to the
outputs. The inputs are decoder via combinatorial outputs. Because the exte
[image:18.595.112.525.552.716.2]the machine, this FSM is classified as a Moore FSM
Figure
State Machine Design Using VHDL
Finite state machines (FSMs) are generally used as controllers in digital designs. some people have designed quite a few state machines on paper, but there was no real point for the design. But up to the point where
don’t have much point but it is possible to be able to implement and test them using actual hardware. The first step in this process is to learn how to model FSMs
As illustrated in Figure 1.3, simple FSM designs are just a the sequential circuits described in the section dealing with memory elem
VHDL. The techniques discussed in this section will allow to quickly and easily designing relatively complex FSMs which can be used as controllers in
A block diagram for a standard Moore-type FSM is shown in Figure This diagram looks fairly typical but some different names are used for the some of the blocks in the design. The Next State Decoder is a block of combinatorial logic
current external inputs and the current state of the FSM to decide the next state of the FSM. In other words, the inputs to the Next State Decoder block
to produce an output that represents the next state of the FSM. The ext State Decoder is generally the excitation equations for the storage flops) in the State Register block. The next state becomes the present state of the FSM when the clock input to the state registers block becomes active.
ters block is storage elements that store the present state of the machine. The inputs to the Output Decoder are used to generate the desired external outputs. The inputs are decoder via combinatorial logic to produce the external outputs. Because the external outputs are only dependent upon the current
the machine, this FSM is classified as a Moore FSM [11].
Figure 1.3: Block diagram for a Moore-type FSM.
Finite state machines (FSMs) are generally used as controllers in digital designs. designed quite a few state machines on paper, to the point where these designs able to implement and test them learn how to model FSMs , simple FSM designs are just a step beyond described in the section dealing with memory elements in will allow to quickly and easily designing relatively complex FSMs which can be used as controllers in digital type FSM is shown in Figure 1.3. but some different names are used for the some of block of combinatorial logic current external inputs and the current state of the FSM to decide upon the next state of the FSM. In other words, the inputs to the Next State Decoder block to produce an output that represents the next state of the FSM. The generally the excitation equations for the storage state becomes the present block becomes active. ters block is storage elements that store the present state of the are used to generate the desired external logic to produce the external rnal outputs are only dependent upon the current state of
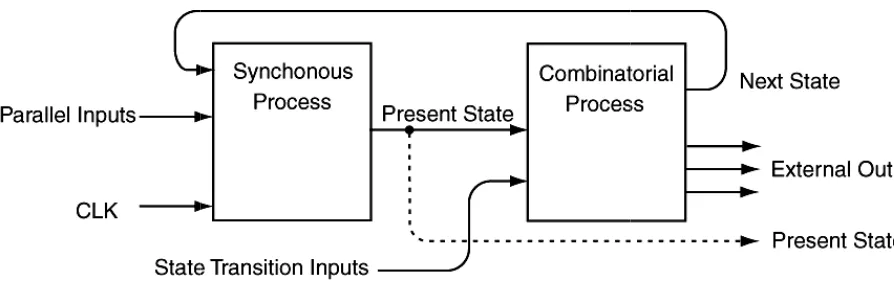
The FSM model shown in Figure 1.3 is probably the model of a Moore-type FSM. Most commonly FSM are required to generate the combinatorial logic required to implement the next state decoder and the output decoder. But here FSMs discussed in the context of VHDL. The true power of VHDL starts to emerge in its dealings with FSMs. the versatility of VHDL behavioral modeling removes the need for large paper designs of endless K-maps and endless combinatorial logic. There are several different approaches used to model FSMs using VHDL. The many different possible approaches are the result of the general versatility of VHDL as a programming language. This section discuses the probability of the clearest approach for FSM implementation. A block diagram of the approach used in the implementation of FSMs is shown in Figure 1.4. The approach used here divides the FSM into two VHDL processes. One process, referred to as the Synchronous Process, handles all the matters regarding clocking and other controls associated with the storage element. The other process, the Combinatorial handles all the matters associated with the Next State Decoder and the Output Decoder of Figure 1.3. Note that the two blocks in Figure 1.3 are both comprised of solely of combinatorial logic. There is some new lingo used in the description of signals used in Figure 1.4 this description is outlined and described below:
• The inputs labeled Parallel Inputs are used to signify inputs that act in
parallel to each of the storage elements. These inputs would include enables, presets, clears, etc.
• The inputs labeled State Transition Inputs include external inputs that control
state transitions. These inputs also include external inputs used to decode Mealy-type external outputs.
• The Present State signals are used by the Combinatorial Process box for both
Figure 1.4
Although there are many different methods that can be used using VHDL, two of the more common approaches are the independent PS/NS styles.
it is clearer than the independent PS/NS style actually a model of the dependent
1.4: Model for VHDL implementations of FSMs.
Although there are many different methods that can be used to using VHDL, two of the more common approaches are the
styles. Only the dependent style is covered in this
than the independent PS/NS style [11]. The model shown in Figure actually a model of the dependent PS/NS style of FSMs.
Model for VHDL implementations of FSMs.
CHAPTER 2
LITERATURE REVIEW
2.1 Introduction
This chapter is about the discussion of all the summarized information of the relevant studies to implement FPGA on designing the MPPT method for PV system, including VHDL programming, Field Programmable Gate Array (FPGA) and the features of Altera DE2 board. Furthermore, this chapter are also discussing about a study on the previous research based on journals and conferences. The sources of the literatures review are from journals, conferences and books.
2.2 Photovoltaic performance
2.2.1 PV characteristics
There are three classic parameters that are very important on the PV characteristics namely short
maximum power point ( maximum value at the points (
shorting the output terminals and measuring the terminal current [
2.2.1.1 Maximum Power (P
The power produced by the cell in Watts can be easily calculated along the I V sweep by the equation
power will occur between the two. point are denoted as
Maximum Power for an I
[image:22.595.161.477.420.554.2]
Figure
By taking the absolute air mass (
combining the beam and diffuse component into single component of irradiance, the short circuit can be obtained as below:
1
The open circuit voltage ( maximum power point voltage (
PV characteristics
There are three classic parameters that are very important on the PV characteristics namely short-circuit current ( ), open-circuit voltage (
oint ( ; ). The power delivered by a PV cell attains a maximum value at the points ( ; ). The short circuit current is measured by shorting the output terminals and measuring the terminal current [3
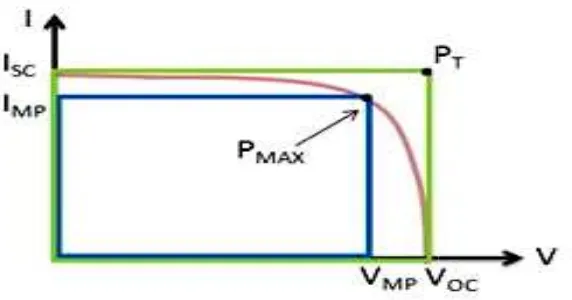
Maximum Power (PMAX), Current at PMAX (IMP), Voltage at P
The power produced by the cell in Watts can be easily calculated along the I V sweep by the equation P=IV. At the ISC and VOC points, the maximum value for
power will occur between the two. The voltage and current at this maximum power point are denoted as VMP and IMP respectively. The Figure 2.1
Maximum Power for an I-V curve.
Figure 2.1: Maximum Power for an I-V curve
By taking the absolute air mass ( ) function is equal to 1.0 and combining the beam and diffuse component into single component of irradiance, the short circuit can be obtained as below:
The open circuit voltage ( ), the maximum power point current ( maximum power point voltage ( ) can be defined as below:
There are three classic parameters that are very important on the PV circuit voltage ( ) and the ). The power delivered by a PV cell attains a ). The short circuit current is measured by
3].
), Voltage at PMAX (VMP)
The power produced by the cell in Watts can be easily calculated along the I-the maximum value for The voltage and current at this maximum power 1 is interpreted the
V curve
) function is equal to 1.0 and combining the beam and diffuse component into single component of irradiance, the
(2.1)
), the maximum power point current ( ) and
! !" 1 # (2.3)
" $ $ In " (2.4)
2.2.1.1.1 Nomenclature
E Irradiance level on module surface, '/)" Ee Effective irradiance or “Suns”
AMa Absolute air mass (dimensionless)
AOI Angle of incident (degree)
, Cell and reference temperature (degree Celsius)
, Short circuit current and current at MPP at STC
, Open circuit voltage and voltage at MPP at STC
, , , Normalized temperature coefficients
C0-C3 Empirically determined coefficients
Ns Number of cells in series
STC E 1000 W/m2, Tc 25C0,AM0 1.5, AOI 0
2.2.1.2 Fill Factor (FF)
Figure 2.2: Photovoltaic module characteristics showing the Fill Factor
Another important parameter of the PV characteristics is called the Fill Factor (FF) is shown in Figure
rectangle that is defined by (Voc) and (Isc). It gives an indication of the quality of a cell's semiconductor junction and measures of how well a solar cell is able to collect the carriers generated by light [
? @AA @AA BC BC
After a simple manipulation the following equation results:
D ??
Those parameters are strongly depending the effect of cell temperatures and the irradiance that produced by sunlight.
2.3 PV materials
PV cells are made of semiconductor materials with crystalline and thin films being the dominant materials. The majority
future other thin film materials are likely going to surpass silicon PV cells in terms of cost and performance [
following classes: crystalline, thin film, amo Fill Factor (FF)
: Photovoltaic module characteristics showing the Fill Factor
Another important parameter of the PV characteristics is called the Fill Factor (FF) is shown in Figure 2.2. It is a term that describes how the curve fills the rectangle that is defined by (Voc) and (Isc). It gives an indication of the quality of a s semiconductor junction and measures of how well a solar cell is able to collect the carriers generated by light [3]. It is defined as:
@AA
After a simple manipulation the following equation results:
=E F
Those parameters are strongly depending the effect of cell temperatures and the irradiance that produced by sunlight.
PV materials
PV cells are made of semiconductor materials with crystalline and thin films being the dominant materials. The majority of PV-cells are silicon-based but in the near future other thin film materials are likely going to surpass silicon PV cells in terms of cost and performance [12]. PV materials may fall into one or more of the following classes: crystalline, thin film, amorphous, multi-junction, organic or
: Photovoltaic module characteristics showing the Fill Factor
Another important parameter of the PV characteristics is called the Fill . It is a term that describes how the curve fills the rectangle that is defined by (Voc) and (Isc). It gives an indication of the quality of a s semiconductor junction and measures of how well a solar cell is able to collect
(2.5)
(2.6)
Those parameters are strongly depending the effect of cell temperatures and the
photochemical. In this
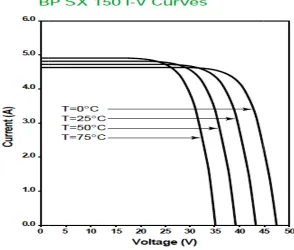
Poly-crystalline silicon technology, namely BPSX150. characteristics.
Table
Electric parameter Maximum power,
Maximum current (short circuit output), Maximum voltage (open circuit), Short circuit current,
Open circuit voltage, NOCT 2) [°C]
Temp. coefficient: short Temp. coefficient: open
[image:25.595.135.502.195.396.2]photochemical. In this project,150 Watt Multi-crystalline photovoltaic con technology, namely BPSX150. Table .
[image:25.595.167.461.449.699.2]Table 1: Typical Electrical of BP SX -150
Figure 2.3: BP SX 150 I-V Curves
Electric parameter BPSX150
Maximum power, PHIJ 150 '
Maximum current (short circuit output), IHK 4.35 Maximum voltage (open circuit), VHK 34.5
Short circuit current, IMN 4.75
Open circuit voltage, VMN 43.5
47 O2°C
Temp. coefficient: short-circuit current (0.065±0.015)%/°C Temp. coefficient: open-circuit voltage –(160±20)mV/°C
crystalline photovoltaic module with able 1 describe its
2.3.1 Crystalline materials
2.3.1.1 Single-crystal silicon
Mono-crystalline silicon cells have in the past dominated the PV market but have now been overtaken by poly-crystalline silicon. The popularity of mono-crystalline silicon was due to the good stability and desirable electronic, physical and chemical properties of silicon. Moreover, silicon was already successful in microelectronics and the enormous industry thus created would benefit the smaller PV industry with regards to economy of scale [13].
2.3.1.2 Poly-crystalline silicon
This is the currently most dominant material and has surpassed the mono-crystalline because it is cheaper. The cost of silicon is a significant portion of the cost of the solar cell. The manufacturing processes of poly-crystalline silicon reduces the cost of silicon by avoiding pulling in the manufacturing process and it results in a block with a large crystal grain structure. This results in cheaper cells with a somewhat lower efficiency. The assembly of multi-crystal wafers is easier and therefore offsets the low efficiency disadvantage [14].
2.4 MPPT Algorithms
actual voltage of the PV panels and the reference voltage maximum power operating point. The qualitative behavior of Figure 2.4. In the region nearby
line having the slope
necessary to introduce a voltage and current perturbation around any operating point of the PV array. Traditional MPPT algorithms are based on “perturbation and observation” method or “incremental conductance” method [
Among these techniques, the P&O and the incremental conductance algorithms are the most common. These techniques have the advantage of an easy implementation but they also have drawbacks, as will be shown l
conditions the V-P curve has only one maximum, so it is not a problem. However, if the PV array is partially shaded, there are multiple maxima in these curves. In order to relieve this problem, some algorithms have been implemented as in [1
next section the most popular MPPT techniques are discussed
Figure 2.4: Current, power, and power derivative of the PV panels vs. voltage
2.4.1 Perturb and Observe
The concept behind the "perturb and observe" (P&
the operating voltage or current of the photovoltaic panel until you obtain maximum power from it. For example, if increasing the voltage to a panel increases the power actual voltage of the PV panels and the reference voltage v* corresponding to the maximum power operating point. The qualitative behavior of ∂p/∂
. In the region nearby v* the power derivative can be considered a straight ine having the slope k. In order to determine the power derivative
necessary to introduce a voltage and current perturbation around any operating point of the PV array. Traditional MPPT algorithms are based on “perturbation and
hod or “incremental conductance” method [15].
Among these techniques, the P&O and the incremental conductance algorithms are the most common. These techniques have the advantage of an easy implementation but they also have drawbacks, as will be shown l
P curve has only one maximum, so it is not a problem. However, if the PV array is partially shaded, there are multiple maxima in these curves. In order to relieve this problem, some algorithms have been implemented as in [1
next section the most popular MPPT techniques are discussed [16]
: Current, power, and power derivative of the PV panels vs. voltage
.1 Perturb and Observe
The concept behind the "perturb and observe" (P&O) method is to modify the operating voltage or current of the photovoltaic panel until you obtain maximum power from it. For example, if increasing the voltage to a panel increases the power corresponding to the ∂v is represented in
the power derivative can be considered a straight . In order to determine the power derivative ∂p/∂v it is necessary to introduce a voltage and current perturbation around any operating point of the PV array. Traditional MPPT algorithms are based on “perturbation and
].
Among these techniques, the P&O and the incremental conductance algorithms are the most common. These techniques have the advantage of an easy implementation but they also have drawbacks, as will be shown later. In normal P curve has only one maximum, so it is not a problem. However, if the PV array is partially shaded, there are multiple maxima in these curves. In order to relieve this problem, some algorithms have been implemented as in [14]. In the
[16].
: Current, power, and power derivative of the PV panels vs. voltage
output of the panel, the system continues increasing the operating voltage until the power output begins to decrease. Once this happens, the voltage is decreased to get back towards the maximum power point. This perturbation continues indefinitely. Thus, the power output value oscillates around a maximum power point and never stabilizes [16].
Yes No
No Yes
Yes No
Figure 2.5: P&O MPPT operation Flow Chart Calculate P , P, PQ!, PQ!
EPR EPQ! EP P D P,
EPQ! PQ!,D PQ! Measure Load current & voltage
Increase voltage Decrease voltage
P R PQ!
End MPP continues
tracking
2.4.2 Constant Conductance
Constant conductance considers the fact that the slope of the power-voltage curve is zero at the maximum power point, positive at the left of the MPP, and negative at the right of the MPP. The MPP is found by comparing the instantaneous conductance (I/V) to the incremental conductance (∆I/∆V)[18] .This algorithm is based on the principle that at the MPP ∂p/∂v= 0, and as S , it yields
T UU V UU
W XSZX 0 Y )S XS
X
Z R 0 Y [ )S XS
X
Z [ 0 Y R )S
\
(2.7)
No No
No No
Yes Yes
Figure 2.6: Constant conductance MPPT operation Flow Chart Measure Load
current & voltage
Calculate ∂I and ∂v
]
]
= 0
]
]
> 0
Increase voltage Decrease voltage
]
]
< 0
By comparing the increment of the power vs. the increment of the voltage (current) between two consecutives samples, the change in the MPP voltage can be determined. In addition, S is defined, as the sum of the array incremental and instantaneous conductance. Thus,
^
__(2.8)
At the MPP, ∂p/∂v= 0, can be rewritten as
^ 0 (2.9)
which can be taken as the desired input (i.e. set-point) for the suggested control system.
The task of the MPPT algorithm is to calculate the reference voltage (Vref) towards which the PV operating voltage should move next for obtaining maximum power output.
To offer a reasonable comparison of these approaches with the approach proposed in this thesis, a set of criteria is put forth to motivate the comparison. This set consists of the following criteria:
(i) Cost: How far does an MPPT design meet the low cost constraints demanded in the commercial market? The penetration of MPPT control technologies in this market depends heavily on their cost.
(ii) Performance: What performance is the MPPT design capable of providing? Future control applications may require nimble and swift power control. (iii) Robustness: Is the MPPT design capable of operating in a wide range of
environmental conditions such as noisy environments? Robustness is highly valued in the commercial market.
(v) Expandability: Can the MPPT design be expanded to accommodate increasing control requirements? It is anticipated that future MPP control systems will require handling of multi-channels.
(vi) Testability: Can the MPPT design be easily tested, verified, and validated against a set of requirements? The commercial market is highly aware that testability has a significant impact on cost.
The remaining chapters in this thesis present a design which is based on a popular MPPT algorithm and is highly suitable for a commercial market given its cost savings, its robustness, its flexibility, and its expandability to handle multi-channel control [19].
2.5 Field Programmable Gate Array (FPGA)
2.5.1. FPGA Architectures
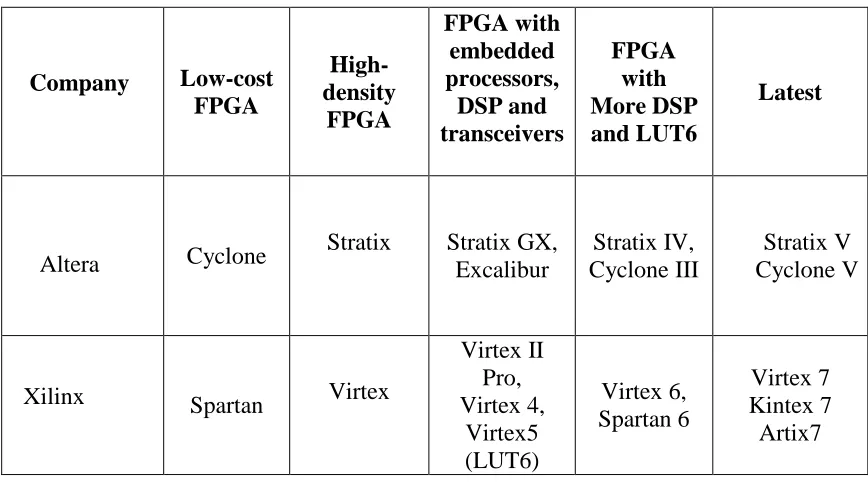
Table 2: FPGA Technologies type and companies
Company Low-cost
FPGA High-density FPGA FPGA with embedded processors, DSP and transceivers FPGA with More DSP and LUT6 Latest
Altera Cyclone
Stratix Stratix GX, Excalibur
Stratix IV, Cyclone III
Stratix V Cyclone V
Xilinx Spartan Virtex
Virtex II Pro, Virtex 4, Virtex5 (LUT6) Virtex 6, Spartan 6 Virtex 7 Kintex 7 Artix7
2.5.2. ALTERA Technology
Altera Corporation is a Silicon Valley manufacturer of PLDs, reconfigurable complex digital circuits. The company released its first PLD in 1984. Altera's main products are the Stratix, Arria and Cyclone series FPGAs,[2] the MAX series CPLDs (Complex programmable logic devices),[2] the HardCopy series ASICs and Quartus II design software [21].
FPGAs have integrated transceivers up to 10 Gbit/s. long-time rival is FPGA founder and market closest competitor is
market [22]. Other FPGA make
differentiated market segments that Altera mostly does not address. In broader terms, Altera competes with
Charge ASIC companies like
rapidly expanding FPGAs' potential markets.
2.5.2.1 ALTERA DE2 board
The Altera DE2 board has man
range of designed circuits, from simple circuits to various multimedia projects. A photograph of the DE2 board is shown in Figure 2.
board and indicates the location of the
[image:35.595.122.574.440.710.2]use the DE2 board, the user has to be familiar with the Quartus II software.
Figure 2.7: ALTERA DE2
FPGAs have integrated transceivers up to 10 Gbit/s. Altera's largest competitor and time rival is FPGA founder and market-share leader Xilinx
Lattice Semiconductor, representing less than 10 percent of the Other FPGA makers, Actel (now Microsemi) and QuickLogic
tiated market segments that Altera mostly does not address.
In broader terms, Altera competes with ASIC, Structured ASIC, and Zero Mask Charge ASIC companies like eASIC. Moore's Law and improving software tools are rapidly expanding FPGAs' potential markets.
2.5.2.1 ALTERA DE2 board
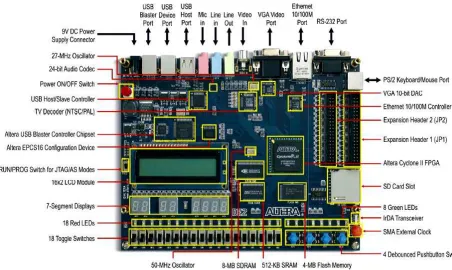
board has many features that allow the user to implement a wide range of designed circuits, from simple circuits to various multimedia projects. A photograph of the DE2 board is shown in Figure 2.7. It depicts the layout of the board and indicates the location of the connectors and key components. In order to
board, the user has to be familiar with the Quartus II software.
Figure 2.7: ALTERA DE2-Cyclone II EP2C35F672C6 board (Adapted from Altera.com)
Altera's largest competitor and Xilinx [22]. The next , representing less than 10 percent of the QuickLogic, sell to tiated market segments that Altera mostly does not address.
, and Zero Mask-. Moore's Law and improving software tools are
y features that allow the user to implement a wide range of designed circuits, from simple circuits to various multimedia projects. A . It depicts the layout of the connectors and key components. In order to board, the user has to be familiar with the Quartus II software.
REFERENCES
[1] Lee, C. C. (1990). Fuzzy-logic in control-systems: Fuzzy logic controller, Part I. IEEE Trans Syst Man Cybern, 20(2), 404-418.
[2] Messai, A., et al. "Maximum power point tracking using a GA optimized
fuzzy logic controller and its FPGA implementation." Solar energy 85.2 (2011): 265-277.
[3] Chu, Chen-Chi, and Chieh-Li Chen. "Robust maximum power point tracking method for photovoltaic cells: A sliding mode control approach." Solar
Energy83.8 (2009): 1370-1378.
[4] Markvart, Tomas. Solar electricity. John Wiley & Sons, 2000.
[5] KEBAILI, SALIMA, and ACHOUR BETKA. "Design and Simulation of
Stand Alone Photovoltaic Systems".
[6] TJUKUP MARNOTO, Tjukup, et al. "Mathematical model for determining
the performance characteristics of multi-crystalline photovoltaic
modules." Proc. of the 9th WSEAS Int. Conf. on Mathematical and
Computational Methods in Science and Engineering. WSEAS Conferences,
Trinidad and Tobago, 2007.
[7] B. Amrouche, M. Belhamel and A. Guessoum, “Artificial Intelligence Based P&O MPPT Method for Photovoltaic Systems” Revue des Engergies Renouvelables ICRESD-07 Telmcen (2007) 11 -16
[8] Chowdhury, Shubhajit Roy, Dipankar Mukherjee, and Hiranmay Saha.
"FPGA Based Maximum Power Point Tracker of Partially Shaded Solar Photovoltaic Arrays using Modified Adaptive Perceptive Particle Swarm Optimization."International Journal on Smart Sensing and Intelligent
Systems 2.4 (2009): 661-675.
[9] Tyson. Denherder, Design and simulation of photovoltaic super system using Simulink, Master’thesis, California Polytechnique StateUniversity, 2006. [10] Volnei A. Pedroni. “Circuit Design With VHDL”. United State of America,
[11] The Shock and Awe VHDL tutorial book
[12] R. Messenger and G. Ventre, Photovoltaic Systems Engineering, Second Edition Wiley, 2003.
[13] T. Esram, P.L. Chapman, "Comparison of Photovoltaic Array Maximum Power Point Tracking Techniques," IEEE Transactions on Energy Conversion, vol. 22, no. 2, pp. 439-449, June 2007.
[14] MacIsaac, L., and A. Knox. "Improved maximum power point tracking algorithm for photovoltaic systems." Proceedings of the international
conference on renewable energies and power quality. 2010.
[15] Pongsakor Takun, Somyot Kaitwanidvilai and Chaiyan Jettanasen, “Maximum Power Point Tracking using Fuzzy Logic Control for Photovoltaic Systems”
[16] Proceeding of “International MultiConference of Engineers and Computer Scientists” 2011 Vol II, IMECS 2011, March 16 – 18, 2011, Hong Kong
[17] C. S. Chin, P. Neelakantan, H. P. Yoong, and K. T. K. Teo, “Control and optimization of fuzzy based maximum power point tracking in solar photovoltaic system”, Global Conference on Power Control and Optimization, 2010.
[18] Koutroulis, Eftichios, Kostas Kalaitzakis, and Vasileios Tzitzilonis. "Development of an FPGA-based system for real-time simulation of photovoltaic modules." Microelectronics Journal 40.7 (2009): 1094-1102.
[19] Robert k. Dueck. “Digital Design with CPLD Applications and VHDL”, 2nd ed., Albany,NY: Thomson Learning, 2005.
[20] Clive Maxfield, EETimes. "Altera's Quartus II design software features Qsys System Integration Tool." May 9, 2011. Retrieved June 6, 2012.
[21] Toni McConnel, Embedded. "Altera ships its first Cyclone V SoC devices." Dec 12, 2012.
[22] G. Walker, "Evaluating MPPT converter topologies using a MATLAB PV model," Journal of Electrical & Electronics Engineering, Australia, IEAust, vol.21,No. 1, 2001, pp.49-56.
[23] Persen, Todd Edward. FPGA-Based Design of a Maximum-Power-Point Tracking System for Space Applications. Diss. University of Central Florida Orlando, Florida, 2004.
IASME/WSEAS international conference on Energy & environment. World
Scientific and Engineering Academy and Society (WSEAS), 2009.
[25] A.Mahamad, S. Saon, and W.g S. Chee, "Development of Optimum Controller based on MPPT for Photovoltaic System during Shading Condition", Malaysian Technical Universities Conference on Engineering and Technology (MUCET) 2012
[26] Mahdi, A. J., W. H. Tang, and Q. H. Wu. "Improvement of a MPPT Algorithm for PV Systems and Its experimental validation." International
Conference on Renewable Energies and Power Quality, Granada, Spain.
2010.
[27] Mellit, A., et al. "FPGA-based real time implementation of MPPT-controller for photovoltaic systems." Renewable Energy 36.5 (2011): 1652-1661.
[28] S. Roy Chowdhury, D. Chakrabarti, H. Saha, “Medical Diagnosis using Adaptive Perceptive Particle Swarm Optimization and its hardware realization using Field Programmable Gate Array”, Journal of Medical Systems, Vol. 33, No. 6, pp. 447-465, 2009.
[29] Giraud, Francois, and Ziyad M. Salameh. "Analysis of the effects of a passing cloud on a grid-interactive photovoltaic system with battery storage using neural networks." Energy Conversion, IEEE Transactions on 14.4 (1999): 1572-1577.
[30] Adly, M., H. El-Sherif, and M. Ibrahim. "Maximum power point tracker for a PV cell using a fuzzy agent adapted by the fractional open circuit voltage technique." Fuzzy Systems (FUZZ), 2011 IEEE International Conference on. IEEE, 2011.