Power Quality Management using STATCOM for
Grid Interfaced Wind Turbine and Solar
Controlled by Microcontroller
Mohan Singh Panwar1, Dr. Ajay Kumar Bansal2 1
M. tech Scholar Department of Electrical Engg. Poornima College of Engineering,Jaipur, India
2
Professor Department of Electrical Engg. Poornima College of Engineering, Jaipur, India
Abstract: Injection of the wind power into an electric grid affects the power quality. The influence of the wind turbine in the grid system concerning the power quality measurement are the active power, reactive power, variation of voltage, filcher, harmonics & electrical behaviors of switching operation & these are measured according to national / international guidelines. This dissertation aims at reducing power quality problems in grid connected wind turbine systems by employing Solar Photo Voltaic Power on Conjunction with ( Static Compensator ) controlled using PWM ( Pulse Width Modulation ) having battery energy storage. The STATCOM is efficiently PWM controlled to sustain the Real Power Source under Fluctuating wind power. Also a unique method for Photo Voltaic Solar Power Utilization has been inducted Solar Power is primary used to charge battery & when battery is charged is used to augment the STATCOM.
Keywords: STATCOM Control, STATCOM Compensation, Power Quality, Wind Turbine, PWM Inverter.
I. INTRODUCTION
The sustainable power source assets like wind, hydro, biomass and so on. Are important to economic development and social advance, it is important to meet the energy require by using the sustainable power source asset like wind. The need to coordinate the sustainable power source like wind energy into control framework is to make it possible to limit the ecological effects. Power quality is characterized as power that empowers the gear to work legitimately. A power quality issue can be characterized as any deviation of extent, recurrence, or virtue from the perfect sinusoidal voltage wave frame. Great power quality is advantage to the operation of electrical gear; however poor power quality will create incredible damage to the power framework. Be that as it may, the produced control from wind energy change framework is continually fluctuating because of the idea of the wind. Accordingly infusion of the wind control into an electric lattice influences the power quality [1].
The essential elements to be considered in control quality estimations are the dynamic power, receptive power, variety of voltage, flash, music, and electrical conduct of exchanging operation. In this proposed plot static synchronous compensator (STATCOM) is associated at a state of basic coupling with a battery energy stockpiling framework (BESS) to alleviate the power quality issues. In this manner, STATCOM gives responsive power support to wind generator and load. The battery energy era framework for control quality change is reenacted utilizing MATLAB/SIMULINK in control framework square set .In the studying of the expressing providing power (voltage/current) including the sounds rate is increasingly while deducing in the consummation phase of the yield control (voltage/current) Is expanded and music rate is diminished at long last we get control quality moved forward.
II. STATECOM
The STATCOM is a shunt-connected reactive power compensation device that is capable of generating and/or absorbing reactive power and in which the output can be varied to control the specific parameter of an electric power system. It is in general a solid-state switching converter capable of generating or absorbing independently controller real and reactive power at its output terminals when it is fed from an energy source or energy-storage device at its input terminals. Specifically, the STATCOM considered in this chapter is a voltage-source converter that, from a given input of dc voltage, produce a set of 3-phase ac-output voltage, each in phase with coupled to the corresponding ac system voltage through a relatively small reactance (which is provided by either an interface reactor or the leakage inductance of a coupling transformer)[2]
The dc voltage is provided by an energy-storage capacitor. The power-oscillation damping in power transmission systems. The dynamic voltage control in transmission and distribution systems. The transient stability. The voltage flicker control.
A. Furthermore, a STATCOM does the following:
1) It occupies a small footprint, for it replaces passive banks of circuit elements by compact electronic converters. 2) It offers modular, factory-built equipment, thereby reducing site work and Commissioning time.
3) It uses encapsulated electronic converters, thereby minimizing its environmental impact.
A STATCOM is analogous to an ideal synchronous machine, which generates a balanced set of three sinusoidal voltages at the fundamental frequency with controllable amplitude and phase angle. This ideal machine has no inertia, is practically instantaneous, does not significantly alter the existing system impedance, and can internally generate reactive (both capacitive and inductive) power [3-8].
Fig. 1 System operational scheme in grid system
B. Advantages
1) It occupies small areas.
2) It replaces the large passive banks and circuit elements by compact converters. 3) Reduces site work and time.
4) Its response is very fast. Control Scheme
Fig. 2 control scheme
The control scheme approach is based on injecting the currents into the grid using ―PID controller. Using such technique, the
controller keeps the control system variable between boundaries of hysteresis area and gives correct switching signals for STATCOM operation [9-12].
The control system scheme for generating the switching signals to the STATCOM is shown in Fig. 2.
III. PWMTHEORY
root of the sum of the squares of the harmonic voltage divided by the fundamental voltage. Alternating current has continuously varying voltage, which swings from positive to negative. This has an advantage in power transmission over long distance. Power from the Grid is carefully regulated to get a pure sine wave and the sine wave radiate the least amount of radio power during long distance transmission. However, it is expensive to generate sine wave in an inverter. Its quality is excellent and almost all electrical and electronic appliances work well in sine wave inverter.
Fig. 3. Sine Wave
The sine wave is the AC waveform we get from the domestic lines and from the generator. The major advantage of sine wave inverter is that all of the household appliances are designed to operate in sine wave AC. Another advantage is that the sine wave is a form of soft temporal rise voltage and it lacks harmonic oscillations, which can cause unwanted counter forces on engines, interference on radio equipment has and surge current on condensers [13].
Modified Sine wave or Quasi Sine wave
Modified sine wave designed to simulate a sine wave since the generation of sine wave is expensive. This waveform consists of a Flat Plateau of positive voltage, dropping abruptly to zero for a short period, then dropping again to a flat plateau of negative voltage. It then go back to zero again and returning to positive. This short pause at zero volts gives more power to 50 Hz fundamental frequency of AC than the simple square wave.
Fig. 4.modified sine wave
Inverters providing modified sine wave can adequately power most household appliances. It is more economical but may present certain problems with appliances like microwave ovens, laser printers, digital clocks and some music systems. 99 % of appliances run happily in modified sine wave. Instruments using SCR (Silicon Controlled Rectifier) in the power supply section behave badly with modified sine wave. The SCR will consider the sharp corners of the sine wave as trashes and shut off the instrument. Many of the Laser printers behave like this and fail to work in inverters and UPS providing modified sine wave power. Most variable speed fans buzz when used in modified sine wave inverters.
Square waveThis is the simplest form of output wave available in the cheapest form of inverters. They can run simple appliances without problems but not much else. Square wave voltage can be easily generated using a simple oscillator. With the help of a transformer, the generated square wave voltage can be transformed into a value of 230 volt AC or higher [14-16].
Fig. 6. System Block Diagram
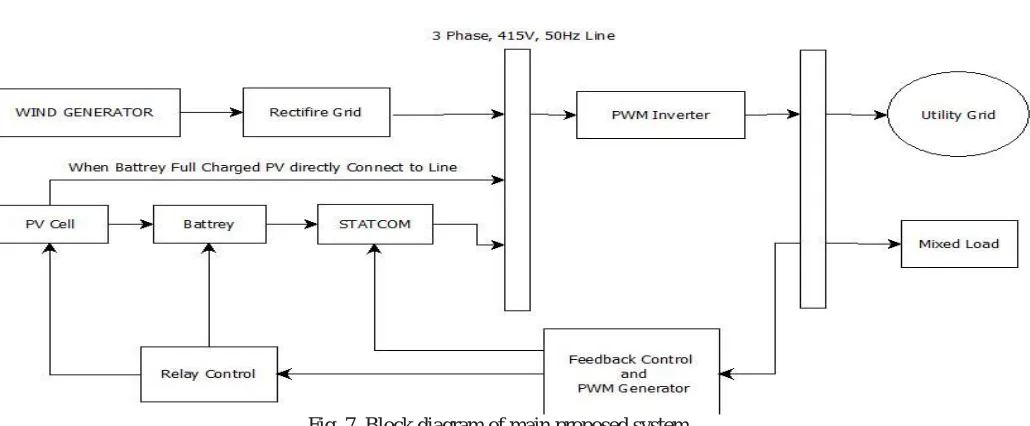
Here by, we propose a novel method of power Quality management in Grid Interfaced wind power Generation contrary to prevailing practice the Electrical power generated by wind generation is first rectifier & converted to DC, to feed a DC bus. The DC power at DC Bus id fed to a Quoi Sine wave PWM Inverter running at fixed Frequencies to convert it to AC & feed the utility grid. Mixed load containing linear as well as nonlinear load is connected across the Inverter/Utility Grid Interface. The voltage at inverter utility grid Interface is sampled by control logic to change PWM duty cycle to a properly drive PWM controlled DC STATCOM to balance out any power irregularities. The batteries of the STATCOM are charged using Solar Power by Photovoltaic Method employing a suitable charge controller [17].
IV. SIMULATIONANDRESULTS
Fig. 7. Block diagram of main proposed system
[image:5.612.57.572.471.684.2]Fig.8.Grid Interfaced Wind Energy System for Power Quality Management CKT.
The DC power at DC Bus is fed to a Quoi Sine wave PWM Inverter running at fixed Frequency’s to convert it to AC & feed the utility grid. Mixed load containing linear as well as nonlinear load is connected across the Inverter/Utility Grid Interface. The voltage at inverter utility grid Interface is sampled by control logic to change PWM duty cycle to appropriately drive PWM controlled DC STATCOM to balance out any power irregularly. The batteries of the STATCOM are charged using Solar Power by Photovoltaic Method employing a suitable charge controller. When battery is full charged then PV is directly connected to grid line and increases power utility
The proposed system comprises of a wind turbine based dynamo for electricity generation. The power generates decertified & fedtoa DC bus, which his point of common coupling of system & provides filter capacitor for rippler ejection. The DC voltage on DCBUOS fedtoa Micro controller controlled PWM Inverter to produce50 Hzusing Dual MOSFET architecture, the voltage is stepped up using step uptransformer&fedtoUtilityGrid.TheACvoltagesogeneratediselectronicallygeneratedthus having fixed frequency & low harmonies, thus improving power quality. In addition, the produced AC voltage is fedtoa PI(Potential Transformer) used for sensing AC voltage Produced &intern to control STATCOM compensation using PWM. The STATCOM Battery is charged using Solar Power via Solar charge controller.
Fig.9.GridInterfacedWindEnergySystemforPowerQualityManagementCkt-1
The proposed system comprises of a wind turbine based dynamo for electricity generation. The power generated is rectified & fedtoa DC bus, which is point of common coupling of system & also provides filter capacity or for rippler ejection.
The DC voltage on DC bus fedtoa Micro controller controlled PWM Inverter to produce50Hz using Dual MOSFET architecture, the voltage is stepped up using step up transformer & fedto Utility Grid.
A. Proposed system architecture model 1
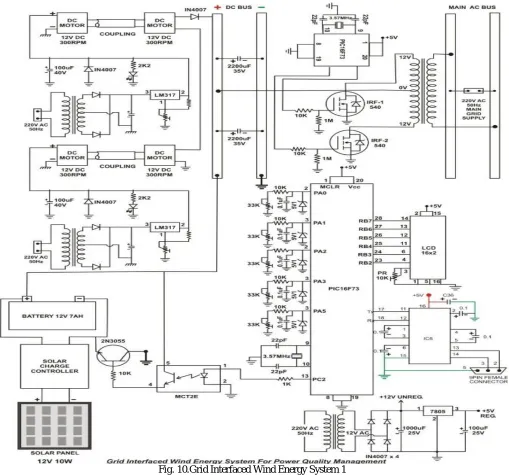
Fig. 10.Grid Interfaced Wind Energy System 1
The proposed system comprises of a wind turbine based dynamo for electricity generation. The power generated is rectified & fed to a DC bus, which is point of common coupling of system & also provides filter capacitor for ripple rejection. The DC voltage on DC bus fed to a Micro controller controlled PWM Inverter to produce 50 Hz using Dual MOSFET architecture, the voltage is stepped up using step up transformer & fed to Utility Grid. The AC voltage so generated is electronically generated thus having fixed frequency & low harmonics, thus improving power quality. Also the produced AC voltage is fed to a PI (Potential Transformer) used for sensing AC voltage Produced & in turn to control STATCOM compensation using PWM. The STATCOM Battery is charged using Solar Power via Solar charge controller.
As evident from the waveform capture, the frequency obtained 50.10 Hz & Cycle RMS voltage is 2.695. Red & yellow marks corresponds the two MOSFET Gate pulse.
Fig.11. Waveform of PWM Pulse for PWM Inverter MOSFET generated by PWM Inverter Microcontroller.
B. PWM generated for STATCOM
The above waveform capture, the PWM generated for STATCOM by main control processor. In this waveform cycle RMS is 2.294V, Frequency 399.5 & Duty cycle is 15.1
Fig.12. Waveform of PWM generated for STATECOM (a)
The above waveform capture, the PWM generated for STATCOM by main control processor. In this waveform cycle RMS is 2.136V, Frequency 399.5 & Duty cycle is 87.2.
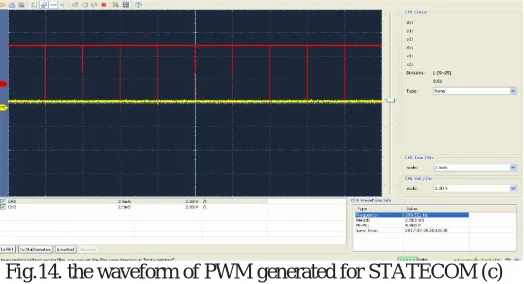
Fig.14. the waveform of PWM generated for STATECOM (c)
[image:10.612.69.545.311.559.2]The above waveform capture, the PWM generated for STATCOM by main control processor. In this waveform cycle RMS is 5.591Vv, Frequency 399.5 & Duty cycle is 0.4.
Table: 1 – Simulated wind Grid without STATCOM @ 0% load
S.No
Vwind Vdc Vac
Volt Volt Volt
0 0 0 0
1 1 1 20
2 2 2 28
3 3 3 41
4 4 4 52
5 5 5 61
6 6 6 74
7 7 7 80
8 8 8 100
9 9 9 110
10 10 10 120
11 11 11 128
12 12 12 146
13 13 13 162
14 14 14 185
15 15 15 197
Figure 15. And table 1 shows relation between simulation wind dc voltage, dc bus voltage and a produced ac voltage which is fed to grid. The system in this mode is working without STATCOM @ no load.
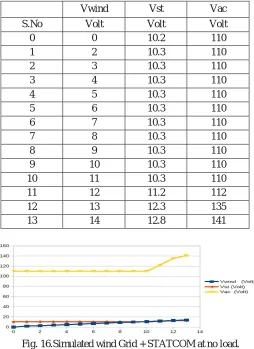
Table: 2 – Simulated wind Grid + STATCOM at no load
Vwind Vst Vac
S.No Volt Volt Volt
0 0 10.2 110
1 2 10.3 110
2 3 10.3 110
3 4 10.3 110
4 5 10.3 110
5 6 10.3 110
6 7 10.3 110
7 8 10.3 110
8 9 10.3 110
9 10 10.3 110
10 11 10.3 110
11 12 11.2 112
12 13 12.3 135
[image:11.612.181.435.128.477.2]13 14 12.8 141
Fig. 16.Simulated wind Grid + STATCOM at no load.
Figure 16. And table 2 shows relation between simulation wind dc voltage, dc bus voltage and a produced ac voltage which is fed to grid. The system in this mode is working with STATCOM @ no load.
Table 3 – Simulated wind + Grid without STATCOM at 33% load
S.No
Vwind Vdc Vac
Volt Volt Volt
0 0 0 0
1 2 2 4
2 3 3 10
3 4 4 17
4 5 5 23
5 6 6 40
6 7 7 50
7 8 8 60
8 9 9 65
9 10 10 68
10 11 11 71
Fig. 17. Simulated wind + Grid without STATCOM at 33% load
Figure 17. And table 3 shows relation between simulation wind dc voltage and a produced ac voltage which is fed to grid. The system in this mode is working without STATCOM @ 33%.
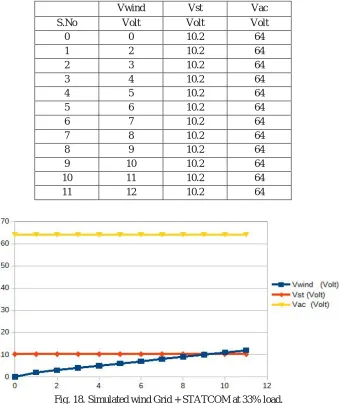
Table 4 – Simulated wind grid + STATCOM at 33% load
Vwind Vst Vac
S.No Volt Volt Volt
0 0 10.2 64
1 2 10.2 64
2 3 10.2 64
3 4 10.2 64
4 5 10.2 64
5 6 10.2 64
6 7 10.2 64
7 8 10.2 64
8 9 10.2 64
9 10 10.2 64
10 11 10.2 64
[image:12.612.183.439.79.222.2]11 12 10.2 64
Fig. 18. Simulated wind Grid + STATCOM at 33% load.
[image:12.612.143.483.284.688.2]Table: 5 – Simulated wind + Grid without STATCOM @ 66% load
S.No
Vwind Vdc Vac
Volt Volt Volt
0 0 0 0
1 2 2 10
2 3 3 11
3 4 4 11
4 5 5 14
5 6 6 25
6 7 7 30
7 8 8 35
8 9 9 40
Fig. 19. Simulated wind + Grid without STATCOM at 66% load
[image:13.612.40.575.490.694.2]Figure 19. In addition, table 5 shows relation between simulation wind dc voltage, dc bus voltage and a produced ac voltage which is fed to grid. The system in this mode is working without STATCOM @ 66%.
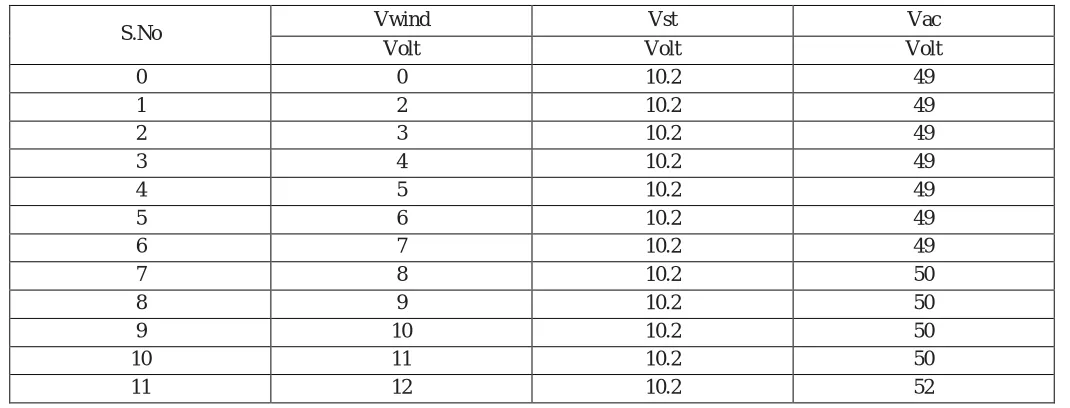
Table: 6 – Simulated wind Grid + STATCOM with at 66% load
S.No Vwind Vst Vac
Volt Volt Volt
0 0 10.2 49
1 2 10.2 49
2 3 10.2 49
3 4 10.2 49
4 5 10.2 49
5 6 10.2 49
6 7 10.2 49
7 8 10.2 50
8 9 10.2 50
9 10 10.2 50
10 11 10.2 50
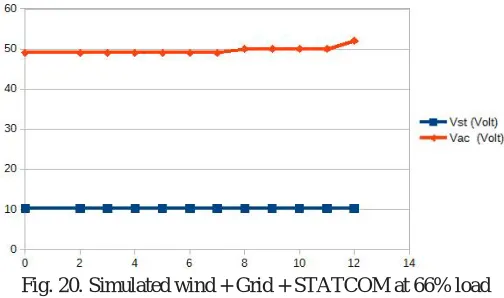
Fig. 20. Simulated wind + Grid + STATCOM at 66% load
Figure 20. And table 6 shows relation between simulation wind dc voltage and a produced ac voltage which is fed to grid. The system in this mode is working with STATCOM @ 66%.
Table: 7 – Simulated wind + Grid without STATCOM at 100% load
Vwind Vdc Vac
S.No Volt Volt Volt
0 0 0 0
1 2 2 10
2 3 3 10
3 4 4 10
4 5 5 10
5 6 6 15
6 7 7 23
7 8 8 25
Fig. 21. Simulated wind + Grid without STATCOM at 100% load
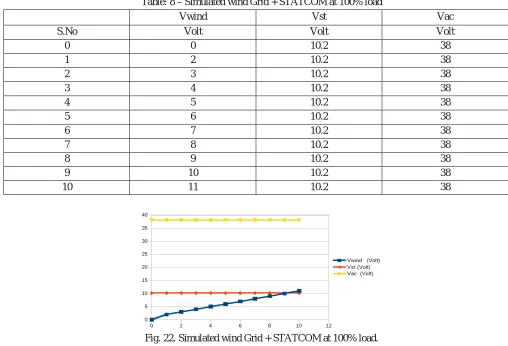
[image:14.612.47.560.291.679.2] [image:14.612.179.438.356.677.2]Table: 8 – Simulated wind Grid + STATCOM at 100% load
Vwind Vst Vac
S.No Volt Volt Volt
0 0 10.2 38
1 2 10.2 38
2 3 10.2 38
3 4 10.2 38
4 5 10.2 38
5 6 10.2 38
6 7 10.2 38
7 8 10.2 38
8 9 10.2 38
9 10 10.2 38
10 11 10.2 38
Fig. 22. Simulated wind Grid + STATCOM at 100% load.
Figure 22. In addition, table 8 shows relation between simulation wind dc voltage, dc bus voltage and a produced ac voltage which is fed to grid. The system in this mode is working with STATCOM @
C. PWM Pulse of PWM Inverter
As evident from the waveform capture, the frequency obtained 50.10 Hz & Cycle RMS voltage is 2.695. Red & yellow marks corresponds the two MOSFET Gate pulse.
The figure show the DSO waveforms from the project hardware test points.
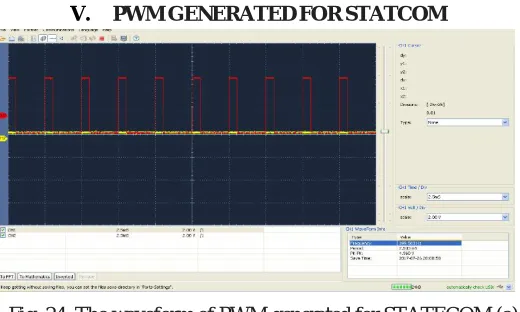
[image:15.612.175.439.519.707.2]V. PWMGENERATEDFORSTATCOM
Fig. 24. The waveform of PWM generated for STATECOM (a)
The above waveform capture, the PWM generated for STATCOM by main control processor. In this waveform cycle RMS is 2.294V, Frequency 399.5 & Duty cycle is 15.1.
Fig. 25. The waveform of PWM generated for STATECOM (b)
The above waveform capture, the PWM generated for STATCOM by main control processor. In this waveform cycle RMS is 2.136V, Frequency 399.5 & Duty cycle is 87.2.
Fig. 26. The waveform of PWM generated for STATECOM (c)
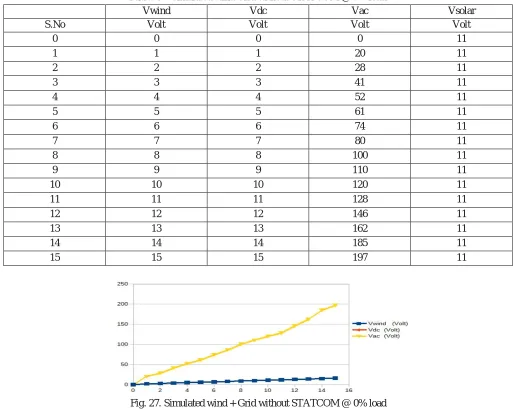
Table: 9 – Simulated wind Grid without STATCOM @ 0% load.
Vwind Vdc Vac Vsolar
S.No Volt Volt Volt Volt
0 0 0 0 11
1 1 1 20 11
2 2 2 28 11
3 3 3 41 11
4 4 4 52 11
5 5 5 61 11
6 6 6 74 11
7 7 7 80 11
8 8 8 100 11
9 9 9 110 11
10 10 10 120 11
11 11 11 128 11
12 12 12 146 11
13 13 13 162 11
14 14 14 185 11
[image:17.612.51.562.89.491.2]15 15 15 197 11
Fig. 27. Simulated wind + Grid without STATCOM @ 0% load
[image:17.612.34.582.553.727.2]Figure 27. And table 9 shows relation between simulation wind dc voltage, dc bus voltage and a produced ac voltage which is fed to grid. The system in this mode is working without STATCOM @ no load.
Table: 10 – Simulated wind Grid + STATCOM at no load
Vwind Vst Vac Vsolar
S.No Volt Volt Volt Volt
0 0 10.2 110 11
1 2 10.3 110 11
2 3 10.3 110 11
3 4 10.3 110 11
4 5 10.3 110 11
5 6 10.3 110 11
6 7 10.3 110 11
7 8 10.3 110 11
8 9 10.3 112 11
10 11 10.3 140 11
11 12 11.2 145 11
12 13 12.3 152 11
[image:18.612.35.575.57.301.2]13 14 12.8 156 11
[image:18.612.55.559.353.697.2]Fig. 28.Simulated wind Grid + STATCOM at no load.
[image:18.612.52.560.357.697.2]Figure 5.18. And table 5.10 shows relation between simulation wind dc voltage, dc bus voltage and a produced ac voltage which is fed to grid. The system in this mode is working with STATCOM @ no load.
Table:11 – Simulated wind + Grid without STATCOM at 33% load
Vwind Vdc Vac Vsolar
S.No Volt Volt Volt Volt
0 0 0 15 10.1
1 2 2 19 10.2
2 3 3 25 10.3
3 4 4 42 10.3
4 5 5 48 10.4
5 6 6 55 10.4
6 7 7 65 10.5
7 8 8 75 10.6
8 9 9 80 10.7
9 10 10 83 10.8
10 11 11 86 10.9
11 12 12 91 11
Fig. 29. Simulated wind + Grid without STATCOM at 33% load
Table: 12 – Simulated wind grid + STATCOM at 33% load
Vwind Vst Vac Vsolar
S.No Volt Volt Volt Volt
0 0 10.2 105 10.1
1 2 10.2 105.5 10.2
2 3 10.2 106 10.3
3 4 10.2 106.5 10.3
4 5 10.2 107 10.4
5 6 10.2 107.5 10.4
6 7 10.2 108 10.5
7 8 10.2 108.5 10.6
8 9 10.2 109 10.7
9 10 10.2 109.5 10.8
10 11 10.2 109.5 10.9
11 12 10.2 110 11
Fig. 29. Simulated wind Grid + STATCOM at 33% load.
[image:19.612.37.578.531.716.2]Figure 29. And table 12 shows relation between simulation wind dc voltage, dc bus voltage and a produced ac voltage which is fed to grid. The system in this mode is working with STATCOM @ 33%.
Table: 13 – Simulated wind + Grid without STATCOM @ 66% load
Vwind Vdc Vac Vsolar
S.No Volt Volt Volt Volt
0 0 0 10 9.5
1 2 2 20 10
2 3 3 21 10.2
3 4 4 21 10.4
4 5 5 24 10.6
5 6 6 35 10.7
6 7 7 40 10.8
7 8 8 45 10.9
Fig. 30. Simulated wind + Grid without STATCOM at 66% load
[image:20.612.44.564.296.694.2]Figure 30. And table 13 shows relation between simulation wind dc voltage, dc bus voltage and a produced ac voltage which is fed to grid. The system in this mode is working without STATCOM @ 66%.
Table: 14 – Simulated wind Grid + STATCOM with at 66% load
Vwind Vst Vac Vsolar
S.No Volt Volt Volt Volt
0 0 10.2 100 9.5
1 2 10.2 100.2 10
2 3 10.2 100.5 10.2
3 4 10.2 101 10.4
4 5 10.2 101.6 10.6
5 6 10.2 102.1 10.7
6 7 10.2 102.9 10.8
7 8 10.2 103.5 10.9
8 9 10.2 103.9 11
9 10 10.2 104.3 11
10 11 10.2 104.6 11
11 12 10.2 105 11
Fig. 31. Simulated wind + Grid + STATCOM at 66% load.
[image:20.612.42.567.298.692.2]Table: 15 – Simulated wind + Grid without STATCOM at 100% load
Vwind Vdc Vac Vsolar
S.No Volt Volt Volt Volt
0 0 0 5 9
1 2 2 15 9.5
2 3 3 15 9.6
3 4 4 15 9.8
4 5 5 15 10.2
5 6 6 20 10.3
6 7 7 28 10.5
7 8 8 32 10.6
Fig. 32. Simulated wind + Grid without STATCOM at 100% load
[image:21.612.35.580.535.725.2]Figure 32.Moreover, table 15 shows relation between simulation wind dc voltage, dc bus voltage and a produced ac voltage which is fed to grid. The system in this mode is working without STATCOM @ 100%.
Table: 16 – Simulated wind Grid + STATCOM at 100% load
Vwind Vst Vac Vsolar
S.No Volt Volt Volt Volt
0 0 10.2 90 9
1 2 10.2 91 9.5
2 3 10.2 92 9.6
3 4 10.2 93 9.8
4 5 10.2 94 10.2
5 6 10.2 95 10.3
6 7 10.2 96 10.5
7 8 10.2 97 10.6
8 9 10.2 98 10.7
9 10 10.2 99 10.8
Fig. 33. Simulated wind Grid + STATCOM at 100% load.
Figure 33 and table 16 shows relation between simulation wind dc voltage, dc bus voltage and a produced ac voltage which is fed to grid. The system in this mode is working with STATCOM @ 100%.
VI. CONCLUSION
In this paper, we present a unique method of wind Generated power Quality Management. Use of advanced micro controller technology allows for power quality improvement in grid connected wind generation system & with nonlinear load. The power quality issues & its consequences on the consumer & electricity grid are observed & rectified by having an advance DC Bus based Electronic PWM Inverter for grid power injection augmented by a PVC ( photo voltaic ) Battery charged of STATCOM Batteries, allows for hybridization o In this paper, we present a unique method of wind Generated power Quality Management. Use of advanced micro controller technology allows for power quality improvement in grid connected wind generation system & with nonlinear load. The power quality issues & its consequences on the consumer & electricity grid are observed & rectified by having an advance DC Bus based Electronic PWM Inverter for grid power injection augmented by a PVC ( photo voltaic ) Battery charged of STATCOM Batteries, allows for hybridization of two most popular, renewable energy sources wind & solar. The proposed system has been proved by a warning prototype as discussed in results, & thus we are able to provide for a highly efficient power Quality Management System for Grid Interfaced wind Energy Generation System.
The proposed system is a promising technology as demand started succeeds fully by prototype model & will change power quality management scenario in wind energy generation. But certain improvement are sought in future implementations such as Pure sine wave Generation instead of Quasi Sine wave Generation, Artificial Intelligence Compensation of Non-linear load harmonics, & support for hybrid generation in lieu of hybrid augmentation will make this system universally acclaimed & acceptable two most popular, renewable energy sources wind & solar. The proposed system has been proved by a warning prototype as discussed in results, & thus we are able to provide for a highly efficient power Quality Management System for Grid Interfaced wind Energy Generation System. In this system when battery is fully charged, then solar directly connected to bus bar and then battery charging graph is decreases and bus voltage is increases
REFERENCES
[1] Priya Tare1, Pawan Pandey2 “Enhancement of power quality of Grid connected wind energy system using STATCOM” International Research Journal of Engineering and Technology (IRJET) , Volume: 04 Issue: 04 | Apr -2017.
[2] M. Thirupathaiah and P. Venkata Prasad “Analysis Of Various Compensation Devices For Power Quality Improvement In Wind Energy System” International Journal of Electrical Engineering & Technology (IJEET),Volume 7, Issue 3, May–June, 2016, pp.25–39.
[3] Shivaraja D M1, S.Saranya2 “Power Quality Improvement of GridConnected Wind Energy System bySTATCOM-Control Scheme”IJAREEIE, Vol. 4, Issue 5, May 2015.
[4] Y.kameswara rao1, Akula.Prasada rao2, Kandukuri.Sudheer3 “PV cell & STATCOM control technique for grid connected wind energy system to improve power quality” International Journal of Science, Engineering and Technology Research (IJSETR), Volume 4, Issue 11, November 2015.
[5] Ch.Sharath Chandra1 G.Srinivasa Rao2 “Power Quality Improvement ForGrid Connected Wind Energy SystemUsingStatcom - Control Scheme”International Journal of Emerging Trends in Electrical and Electronics (IJETEE – ISSN: 2320-9569) Vol. 11, Issue. 2, June 2015.
[7] Mr.Saurabh S. Kulkarni* Mr. Naveen Kumar Mucha “A Matlab/Simulink Model for the control scheme utilized to improve power quality of Wind Generation System connected to
grid” International Journal of Innovative Research in Advanced Engineering ,Volume 1 Issue 6 (July 2014).
[8] 1Dr.K.Ravichandrudu, 2Mr.P.Suman Pramod Kumar “Power Quality Improvement ForGrid Connected Wind EnergySystem By Using Statcom”IJAIEM Volume 03, Issue 09, September 2014.
[9] P. Ramanathan “A Statcom-Control Scheme for Grid ConnectedWind Energy System for Power Quality Improvement”Middle-East Journal of Scientific Research, 57-61, 2014.
[10] Ali Tahmasebi Sohi1, Shahram Javadi2, SZ Moussavi3 “Energy Management and Power Control for a Grid-Connected PMSG Wind Energy Conversion System with Extra Function of Harmonic Elimination for Local Nonlinear Loads” IOSR Journal of Electrical and Electronics Engineering (IOSR-JEEE)e-ISSN: 2278-1676,p-(IOSR-JEEE)e-ISSN: 2320-3331, Volume 9, Issue 6 Ver. I (Nov – Dec. 2014), PP 13-21.
[11] V.Srikanth1, A. Naveen kumar2 “Power Quality Improvement Techniques In Hybrid Systems – AReview”International Journal Of Engineering And Computer Science ISSN:2319-7242Volume 3 Issue 4 April, 2014 Page No. 5495-5498.
[12] S. RAJESH RAJAN “Power Quality Improvement In Grid Connected Wind Energy SystemUsingUPQC”International Journal of Research inEngineering& Technology (IJRET)Vol. 1, Issue 1, June 2013, 13-20.
[13] Suhashini .D1, Ambika .A2 “Grid Power Quality Improvement and Battery Energy Storage in Wind Energy System by PI and Fuzzy Based STATCOM Controller” International Journal of Science and Research (IJSR) 2013.
[14] S. Rajesh Rajan “Power Quality Improvement In Grid Connected Windenergy System Using Statcom”International Journal of Advanced Research in Electrical, Electronics and Instrumentation Engineering, Vol. 2, Issue 3, March 2013.
[15] K. Sheshu Kumar, K. Suresh Kumar, SkBaji “A New Control Scheme for Power Quality Improvement with STATCOM” IJERA Vol. 3, Issue 4, Jul-Aug 2013, pp.2555-2561.
[16] Manoj Kumar Swain1, RatiRanjan Sabat2, Balaram Das3, Rakesh Sahu4 “Enhancement of Power Quality for Grid Connected WindEnergy System using Smart-STATCOM” IJETAE Volume 3, Issue 10, October 2013.
[17] B.T.Ramakrishnarao, B.Eswararao, L.Narendra, K.Pravallika “A Statcom-Control Scheme for Power Quality Improvement of Grid Connected Wind Energy System” International Journal of Engineering Science and Innovative Technology (IJESIT)Volume 2, Issue 3, May 2013.
[18] Ganesh.Harimanikyam1, S.V.R. Lakshmi Kumari2 “Power Quality Improvement of Grid Connected Wind Energy System by Statcom for Balanced and Unbalanced Linear and Nonlinear LoadsGa” International Journal of Engineering Research and Development, Volume 3, Issue 1 (August 2012), PP. 09-17. [19] 1s.Venkateshwaran, 2g.Vijaya Gowri, “Statcom With Tbess To Improve The Power Quality In Grid Connected Wind Energy System” International Journal of
Advanced Technology & Engineering Research (IJATER) 2012.
[20] D. Srinivas 1, M. Rama Sekhara Reddy 2 “Power Quality Improvement in Grid Connected Wind Energy System Using Facts Device and PID Controller” IOSR Journal of Engineering (IOSRJEN),Volume 2, Issue 11 (November 2012), PP 19-26.
[21] V. Amarnath Reddy1, P. Harshavardhan Reddy2, M. Sudheer babu3 “Power Quality Improvement in Wind Energy system by using STATCOM on Integration to the Grid” IJMER Vol. 2, Issue. 5, Sep.-Oct. 2012 pp-3637-3640.
[22] Yuvaraj, Dr.S.N.Deepa “Improving Grid Power Quality With FACTS Deviceon Integration of Wind Energy System” STUDENT PULSE, APRIL 2011, VOL. 3, ISSUE 4.