M E T H O D
Open Access
BERMUDA: a novel deep transfer learning
method for single-cell RNA sequencing
batch correction reveals hidden
high-resolution cellular subtypes
Tongxin Wang
1, Travis S. Johnson
2,3, Wei Shao
3, Zixiao Lu
4, Bryan R. Helm
3, Jie Zhang
5*and Kun Huang
3,6*Abstract
To fully utilize the power of single-cell RNA sequencing (scRNA-seq) technologies for identifying cell lineages and bona fide transcriptional signals, it is necessary to combine data from multiple experiments. We presentBERMUDA (Batch Effect ReMoval Using Deep Autoencoders), a novel transfer-learning-based method for batch effect correction in scRNA-seq data.BERMUDAeffectively combines different batches of scRNA-seq data with vastly different cell population compositions and amplifies biological signals by transferring information among batches. We demonstrate thatBERMUDA outperforms existing methods for removing batch effects and distinguishing cell types in multiple simulated and real scRNA-seq datasets.
Keywords:Single cell, RNA-seq, Batch effect, Transfer learning, Autoencoder
Background
Single-cell transcriptional dynamics are important for un-derstanding molecular physiology and disease dysregula-tion within heterogeneous tissues. Until recently, the standard techniques for single-cell analysis were flow cy-tometry [1,2] and fluorescence imaging of tissue on slides [3, 4]. Though these techniques have provided tremen-dous insights, they are limited to a small, pre-defined set of molecular markers [1]. More recently, high-throughput techniques such as RNA sequencing (RNA-seq) were established to measure expression of thousands of genes, but were designed for bulk tissue samples [5, 6]. Single-cell RNA sequencing (scRNA-seq) was developed to characterize high-throughput gene expression profiles for populations of individual cells, which has enabled an un-precedented resolution of cellular heterogeneity in com-plex tissues. Widespread adoption of scRNA-seq techniques has produced large complex datasets, which
present new computational challenges for evaluating ex-perimental reproducibility and combining data from dif-ferent batches and platforms [5,7–11].
There have been many attempts to combine gene ex-pression data from different experiments to achieve a more comprehensive understanding of the underlying cellular heterogeneity. The first generation of tools was adapted from a linear model analysis of microarrays [12–14] and was subsequently modified for RNA-seq data via generalized linear [15] or negative binomial models [16]. These methods represent the foundation of batch effect removal when scRNA-seq data from dif-ferent sequencing runs are combined; however, scRNA-seq poses additional challenges when combining dispar-ate data. Unlike microarray or whole-tissue RNA-seq, scRNA-seq is especially prone to “drop out” events in which RNA is not amplified during library preparation [17, 18]. Cell types and proportions may vary substan-tially across samples [19, 20]. Both technical and bio-logical variability contribute to strong batch effects (i.e., systematic variance) that must be overcome to mean-ingfully combine datasets as is fundamental in com-parative and bioinformatic studies [21,22].
© The Author(s). 2019Open AccessThis article is distributed under the terms of the Creative Commons Attribution 4.0 International License (http://creativecommons.org/licenses/by/4.0/), which permits unrestricted use, distribution, and reproduction in any medium, provided you give appropriate credit to the original author(s) and the source, provide a link to the Creative Commons license, and indicate if changes were made. The Creative Commons Public Domain Dedication waiver (http://creativecommons.org/publicdomain/zero/1.0/) applies to the data made available in this article, unless otherwise stated.
* Correspondence:[email protected];[email protected]
5
Department of Medical and Molecular Genetics, Indiana University School of Medicine, Indianapolis, IN, USA
3Department of Medicine, Indiana University School of Medicine, Indianapolis, IN, USA
Seurat-CCA (Seurat v2) [22] and mnnCorrect [20] were the first methods proposed to combine scRNA-seq data from multiple batches. Seurat v2 uses canonical correlation analysis (CCA) to project cells from different experiments to a common bias-reduced low-dimensional representation. However, this type of correction does not account for the variations in cellular heterogeneity among studies, e.g., cell types and proportions. Alterna-tively, mnnCorrect utilizes mutual nearest neighbors (MNN) to account for heterogeneity among batches, recognizing matching cell types via MNN pairs [20]. By identifying the corresponding cells, a cell-specific correc-tion can be learned for each MNN pair. As a conse-quence of local batch correction,mnnCorrect avoids the assumption of similar cell population compositions be-tween batches assumed by previous methods. Following
mnnCorrect, a series of new methods have been devel-oped to integrate scRNA-seq data from different experi-ments [23–27]. For example,Seurat v3 [23] uses MNN pairs between the reference batch and query batches to detect“anchors”in the reference batch.“Anchors” repre-sent cells in a shared biological state across batches and are further used to guide the batch correction process through CCA. BBKNN [24] leverages neighborhood graphs to more efficiently cluster and visualize cell types. More recently, scRNA-seq batch correction is conducted by using deep learning approaches. For example, scVI
[28] utilizes deep generative models to approximate the underlying distributions of the observed expression pro-files and can be used in multiple analysis tasks including batch correction. However, most existing batch correc-tion methods for scRNA-seq data rely on similarities be-tween individual cells, which do not fully utilize the clustering structures of different cell populations to identify the optimal batch-corrected subspace.
In this paper, by considering scRNA-seq data from different batches as different domains, we took advan-tage of the domain adaptation framework in deep transfer learning to properly remove batch effects by finding a low-dimensional representation of the data. The proposed method, BERMUDA (Batch Effect Re-Moval Using Deep Autoencoders), utilizes the similar-ities between cell clusters to align corresponding cell populations among different batches. We demonstrate that BERMUDA outperforms existing methods at combining different batches and separating cell types in the joint dataset based on UMAP visualizations and proposed evaluation metrics. By optimizing the
maximum mean discrepancy (MMD) [29] between
clusters across different batches, BERMUDAcombines batches with vastly different cell population composi-tions as long as there is one common cell type shared between a pair of batches. Compared to existing
methods, BERMUDA can also better preserve
biological signals that exist in a subset of batches when removing batch effects. These improvements provide a novel deep learning solution to a persistent problem in scRNA-seq data analysis, while demon-strating state-of-the-art practice in batch effect correction.
Results
Framework ofBERMUDA
We propose BERMUDA, a novel unsupervised frame-work to remove batch effects across different batches by training an autoencoder (Fig. 1a). After preprocess-ing the scRNA-seq data to select highly variable genes, we first used a graph-based clustering algo-rithm to detect cell clusters in each batch individu-ally. Then, we applied a correlation-based approach to evaluate the similarity between cell clusters from dif-ferent batches. Each pair of cell clusters was assigned a similarity score, which was later used as the coeffi-cient in the transfer loss. Next, an autoencoder was trained using the standardized and scaled transcript-per-million (TPM) value of highly variable genes to learn a low-dimensional embedding of the gene ex-pression profiles where the systematic biases across different batches were removed (Fig. 1b). In order to successfully remove batch effects, we propose a novel approach by combining the reconstruction loss with the transfer loss when training the autoencoder. The reconstruction loss was calculated between the input and output of the autoencoder, which helped to learn a low-dimensional embedding that properly repre-sented the original high-dimensional gene expression data. The transfer loss was calculated by estimating the difference of distributions between pairs of cell clusters using the low-dimensional representation, which helped to merge similar clusters from differ-ent batches. The mini-batch gradient descent algo-rithm in deep learning was used to train BERMUDA
where reconstruction loss and transfer loss were cal-culated from a sampled “mini-batch” during each it-eration of the training process. The total loss in each iteration was then calculated by adding recon-struction loss and transfer loss with a regularization parameter (Eq. 8), and the parameters in BERMUDA
were then updated using gradient descent. Finally, the low-dimensional code learnt from the trained
autoencoder was used for further downstream
analysis.
The popularly used UMAP [30] method was utilized to visualize the cell type clustering results. In addition, three evaluation metrics are proposed to evaluate the perform-ance of BERMUDA: divergence_score, entropy_score, and silhouette_score (See the “Methods” section).
populations between pairs of batches, which indicates whether shared cell populations among different batches are mixed properly. Entropy_score is an average of local entropy of distinct cell populations between pairs of batches, which can evaluate whether cell populations not shared by all the batches remain separate from other cells after batch correction.Silhouette_score is calculated using cell type labels as cluster labels, which measures the qual-ity of cell type assignment in the aligned dataset.
Comparison of the performance ofBERMUDAversus existing methods under different cell population compositions
We compared the performance of BERMUDA versus
several existing state-of-the-art batch correction methods for scRNA-seq data (mnnCorrect [20],BBKNN
[24],Seurat v2(v2.3.4) [22], Seurat v3(v3.0.0) [23], and
scVI[28]) using four datasets (Table 1). To evaluate the performance of each method under different cell
[image:3.595.57.539.89.266.2]Fig. 1Overview ofBERMUDAfor removing batch effects in scRNA-seq data.aThe workflow ofBERMUDA. Circles and triangles represent cells fromBatch 1 andBatch 2, respectively. Different colors represent different cell types. A graph-based clustering algorithm was first applied on each batch individually to detect cell clusters. Then, MetaNeighbor, a method based on Spearman correlation, was used to identify similar clusters between batches. An autoencoder was subsequently trained to perform batch correction on the code of the autoencoder. The code of the autoencoder is a low-dimensional representation of the original data without batch effects and can be used for further analysis.bTraining an autoencoder to remove batch effects. The blue solid lines represent training with the cells inBatch 1and the blue dashed lines represent training with cells inBatch 2. The black dashed lines represent the calculation of losses. The loss function we optimized contains two components: the reconstruction loss between the input and the output of the autoencoder, and the MMD-based transfer loss between the codes of similar clusters
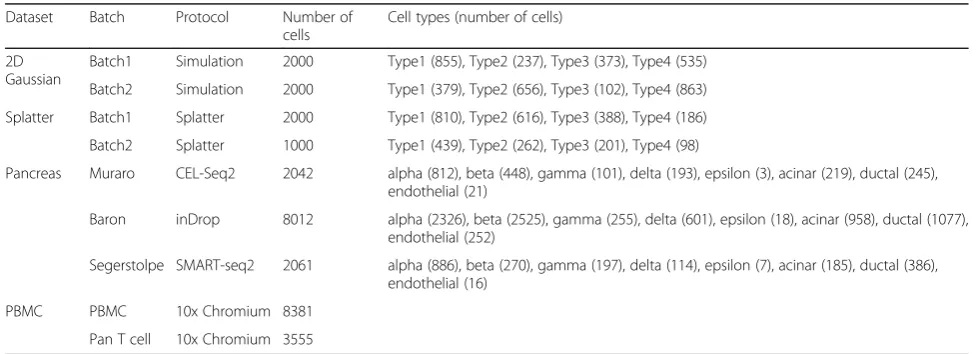
Table 1Datasets used for evaluation ofBERMUDA
Dataset Batch Protocol Number of cells
Cell types (number of cells)
2D Gaussian
Batch1 Simulation 2000 Type1 (855), Type2 (237), Type3 (373), Type4 (535)
Batch2 Simulation 2000 Type1 (379), Type2 (656), Type3 (102), Type4 (863)
Splatter Batch1 Splatter 2000 Type1 (810), Type2 (616), Type3 (388), Type4 (186)
Batch2 Splatter 1000 Type1 (439), Type2 (262), Type3 (201), Type4 (98)
Pancreas Muraro CEL-Seq2 2042 alpha (812), beta (448), gamma (101), delta (193), epsilon (3), acinar (219), ductal (245), endothelial (21)
Baron inDrop 8012 alpha (2326), beta (2525), gamma (255), delta (601), epsilon (18), acinar (958), ductal (1077), endothelial (252)
Segerstolpe SMART-seq2 2061 alpha (886), beta (270), gamma (197), delta (114), epsilon (7), acinar (185), ductal (386), endothelial (16)
PBMC PBMC 10x Chromium 8381
Pan T cell 10x Chromium 3555
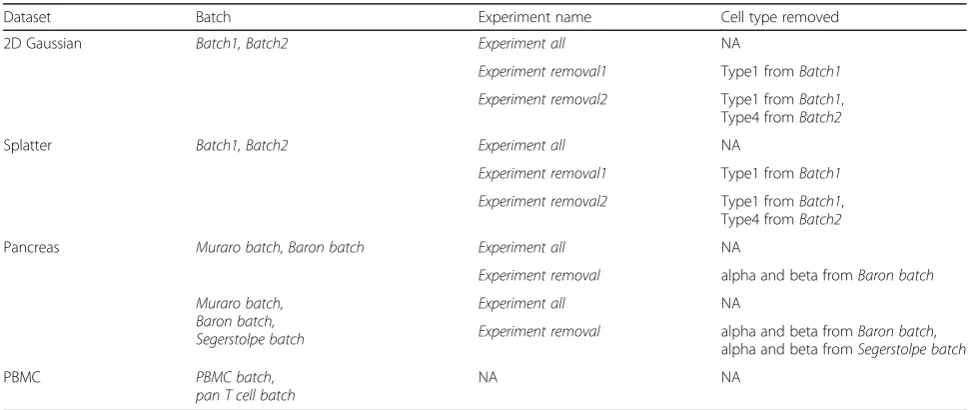
[image:3.595.54.543.529.706.2]population compositions, we performed multiple data analysis experiments on each dataset with cell type labels (Table2). For some experiments, we removed some cell types from specific batches to create different cell type distribution configurations. We performed three differ-ent experimdiffer-ents (“Experiment all”, “Experiment re-moval1”, and “Experiment removal2”) on each of the
simulated datasets (2D Gaussian dataset and Splatter dataset). Specifically, forExperiment all, we applied each method to all the cells in the dataset. ForExperiment re-moval1, we removed Type1 from Batch1 and applied each method on this reduced dataset. ForExperiment re-moval2, we removed Type1 from Batch1 and Type4 fromBatch2at the same time. We performed two differ-ent experimdiffer-ents (“Experiment all”, “Experiment re-moval”) on the human pancreas dataset. ForExperiment all, we applied each method to all the cells in the entire dataset. ForExperiment removal, we removed alpha and beta cells from Baron batch and alpha and beta cells fromSegerstolpe batch(if applicable) and evaluated each method using this reduced dataset. We also applied
BERMUDA to two batches of peripheral blood mono-nuclear cells (PBMCs).
BERMUDAoutperformed existing methods in removing
batch effects on simulated data
To assess the performance of BERMUDA for batch ef-fect removal, we first applied it to a simulated dataset (referred to as “2D Gaussian dataset”) with four shared virtual cell types, where the expression profiles were generated from a two-dimensional biological subspace following the method in [20] (See the “Methods” sec-tion). In order to recover and better visualize the under-lying biological subspace, we set the number of neurons in the bottleneck layer of the autoencoder to two. We
compared the performance ofBERMUDAto other exist-ing methods in three different scenarios:
All the cells from the two batches (referred to as
“Experiment all”);
Removing Type1 inBatch1(referred to as
“Experiment removal1”);
Removing Type1 inBatch1and Type4 inBatch2at
the same time (referred to as“Experiment
removal2”).
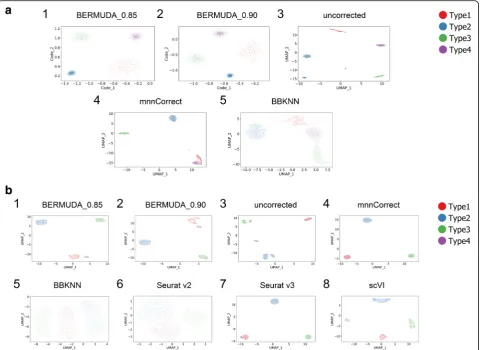
Experiment removal2represented the most difficult case in these three scenarios because only two cell types were shared by both batches. We evaluated the results by inspecting the two-dimensional visualizations (Fig. 2a, Additional file1: Figure S1). Ideally, the visualizations gen-erated after proper batch correction should contain four separate cell clusters (each representing a cell type), and the clusters for shared cell types should contain a homogenous mixture of cells from both batches. In Ex-periment removal2, BERMUDA properly removed batch effects (Fig.2a1, a2) while bothmnnCorrect andBBKNN
[image:4.595.55.540.526.731.2]generated false similarities between cell types that did not exist in the original data (Fig.2a4, a5). Specifically, in Ex-periment removal2, clusters corresponding to Type1 and Type4 were closely connected in the mnnCorrect results (Fig. 2a4), and clusters corresponding to Type1, Type3, and Type4 were not as well separated in theBBKNN re-sults (Fig. 2a5). Moreover, only BERMUDA produced proper batch correction consistently across three different experiments (Fig.2a, Additional file1: Figure S1). For ex-ample, BBKNN incorrectly separated Type1 from the same batch into two distinct clusters in Experiment re-moval1(Additional file1: Figure S1b5). This suggests that althoughmnnCorrectand BBKNNcan handle differences
Table 2Experiments performed for comparingBERMUDAwith existing methods
Dataset Batch Experiment name Cell type removed
2D Gaussian Batch1, Batch2 Experiment all NA
Experiment removal1 Type1 fromBatch1
Experiment removal2 Type1 fromBatch1,
Type4 fromBatch2
Splatter Batch1, Batch2 Experiment all NA
Experiment removal1 Type1 fromBatch1
Experiment removal2 Type1 fromBatch1,
Type4 fromBatch2
Pancreas Muraro batch, Baron batch Experiment all NA
Experiment removal alpha and beta fromBaron batch
Muraro batch, Baron batch, Segerstolpe batch
Experiment all NA
Experiment removal alpha and beta fromBaron batch,
alpha and beta fromSegerstolpe batch
PBMC PBMC batch,
in cell population composition among different batches, their performance was less optimal compared with
BERMUDAwhen such differences were large.
In order to compare BERMUDA with the popularly used scRNA-seq data analysis tool Seurat v2 [22] and the recently proposed Seurat v3 [23] and scVI [28] (where the workflows were designed for scRNA-seq count data), we evaluated BERMUDAusing two batches of simulated single-cell RNA sequence counts generated by Splatter [31] (referred to as “Splatter dataset”). We conducted multiple batch correction experiments using different cell populations:
All the cells from two batches (referred to as
“Experiment all”);
Removing Type1 inBatch1(referred to as
“Experiment removal1”);
Removing Type1 inBatch1and Type4 inBatch2
(referred to as“Experiment removal2”).
Again, Experiment removal2 was the most difficult scenario. When only two cell types were shared be-tween two batches in Experiment removal2, only
BERMUDA properly removed batch effects (Fig. 2b1, b2). Although scVI could align corresponding cell types (Fig. 2b8), it could not remove batch effects at a more granular level to properly merge cells from different batches within each cell type (Additional file 1: Figure S2c8). The other methods improperly merged Type1 with Type4 in the UMAP visualiza-tions (Fig. 2b4–b7). Moreover, BERMUDA was the only method that could consistently remove batch effects in all three cases. When all four cell types were shared in both batches, we observed that all the methods properly merged cells of the same type (Additional file 1: Figure S2a). However, BBKNN and
Seurat v2 produced much lower silhouette_score
values due to the inflated variance within cell clus-ters compared to the original data (Additional file 1:
Fig. 2Removing batch effects in simulated scRNA-seq data.aUMAP visualizations of results forExperiment removal2on 2D Gaussian dataset, where Type1 fromBatch1and Type4 fromBatch2were removed. BERMUDA_0.85 and BERMUDA_0.90 represent results ofBERMUDAwithSthr= 0.85 and 0.90, respectively.
[image:5.595.59.540.88.438.2]Figure S2d1). Also, when the difference in cell type distributions was introduced in Experiment removal1,
we observed that BBKNN and Seurat v2 could no
longer mix the same cell type from different batches properly (Additional file 1: Figure S2b5, b6). The re-sults of Seurat v2 were anticipated since it was de-signed to align different batches globally without
considering the population differences among
batches. The inconsistent results of BBKNN under different cell type distributions indicated that the neighborhood graphs generated by BBKNN may not always be reliable due to the fact that the method mainly focused on computational efficiency.
The observations through UMAP visualizations were further confirmed by evaluating the results through the proposed divergence_score, entropy_score, and silhouette_score (Additional file 1: Figure S2d). In Experiment removal2, scVI could not properly align cells from different batches within each cell type, resulting in a high divergence_score (Additional file 1: Figure S2d5, d6). Other existing methods pro-duced low silhouette_score values (Additional file 1: Figure S2d6, d7) since they were not able to separate different cell types correctly. We observed that
BERMUDA consistently yielded the best performance in all three cases when evaluated using the proposed metrics (Additional file 1: Figure S2d).
By evaluating BERMUDA on two different simulated datasets, we demonstrate that it achieves better perform-ance than existing methods in removing batch effects, especially when the difference of cell population compo-sitions among batches is large.
BERMUDAoutperformed existing methods in removing
batch effects on human pancreas data
To further evaluate BERMUDA using biological data, we applied it to publicly available human pancreas datasets that were generated utilizing different scRNA-seq protocols. Muraro et al. [32] used CEL-Seq2, a multiplexed linear amplification RNA sequencing technique. This dataset will be referred to as“Muraro batch.” Baron et al. [33] used a droplet RNA-seq technology. We refer to this dataset as “Baron batch.” In addition to evaluating our method using all the cells in both batches (referred to as“Experiment all,”
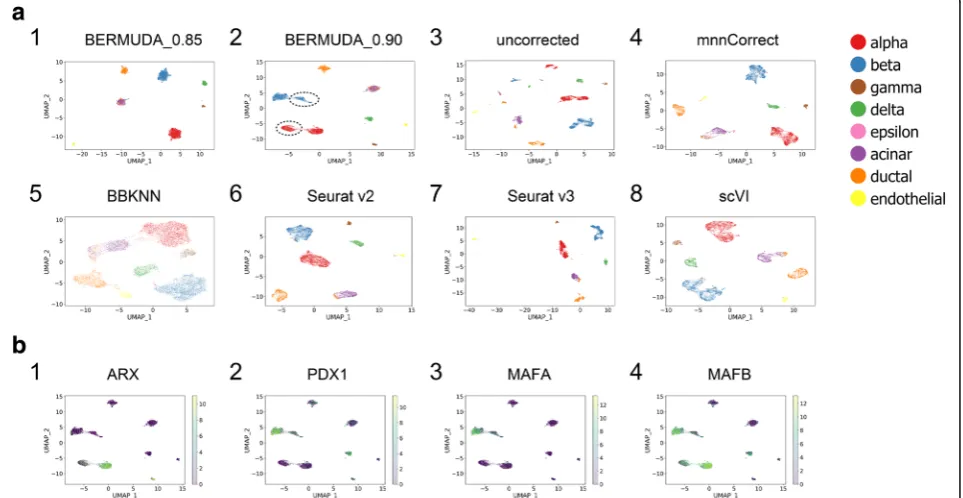
Fig. 3a, Additional file 1: Figure S4a), we also removed alpha and beta cells fromBaron batch(referred to as“ Ex-periment removal”, Additional file1: Figure S4b, c) to simu-late vast differences in cell type distributions found in real scRNA-seq data.
BERMUDAachieved competitive results in both cases compared to mnnCorrect, BBKNN,Seurat v2,Seurat v3, and scVI. Specifically, in Experiment removal, the per-formance ofSeurat v2deteriorated when alpha and beta cells were removed from the Baron batch (Additional
[image:6.595.58.540.433.682.2]file 1: Figure S4d) because only utilizing CCA was not capable of addressing the case where only a subset of cell types was shared among batches. BBKNNand scVI
separated different cell types into different clusters, but could not mix cells from different batches within clus-ters properly (Fig.3a5, a8, Additional file1: Figure S4a5, a8), producing high divergence_score values (Additional file 1: Figure S4d1). Seurat v3and mnnCorrect were de-signed to cope with cell type distributions across data-sets being different. However, Seurat v3 could not produce consistent results with clear separation between cell types when the cell population composition varied within the same set of data. For example,Seurat v3 pro-duced a UMAP visualization that represented alpha, beta, gamma, and delta cells as tightly connected clus-ters when alpha and beta cells from the Baron batch
were removed. This differed from both the original data and the Seurat v3 result in Experiment all (Fig. 3a7, Additional file 1: Figure S4b7). ThemnnCorrect method produced relatively good results across both cases (Fig. 3a4, Additional file 1: Figure S4b4). However,
BERMUDA still outperformed all of these existing methods when evaluated using the three proposed met-rics simultaneously (Additional file1: Figure S4d).
BERMUDApreserved batch-specific biological signals in human pancreas data
In this paper, we use“batch-specific” biological signals to refer to bona fide biological signals that are not shared among all the batches. A homogeneous mixture of the same cell type among different batches is an important in-dicator of proper batch corrections. However, an overly batch-corrected homogeneous mixture could lead to loss of the subtle batch-specific biological signals that may contain information about potential biomarkers of batch-specific cell subtypes, which could defeat the purpose of carrying out scRNA-seq experiments. One advantage of
BERMUDAis the ability to balance between maintaining a more homogeneous mixture of cell types and retaining the subtle structures within cell types, which is accom-plished by adjusting the value ofSthr. A lowerSthr value can merge the same cell type from different batches more homogeneously. However, increasing the value ofSthrcan also be helpful, as it allows subtle batch-specific biological signals to be preserved. We demonstrate that Sthr values between 0.85 and 0.90 can produce proper batch correc-tion in different datasets consistently (Addicorrec-tional file 1: Figure S8, S9). For example, inExperiment allon the pan-creas dataset, BERMUDA produced competitive results for bothSthr values (Additional file 1: Figure S4d1). Each cell type was separated as a single cluster with a homogenous mixture of cells from both batches when
Sthr= 0.85 (Fig.3a1). In addition, we observed two closely connected cell clusters of alpha and beta cells from the
Baron batch when Sthr= 0.90 (Fig. 3a2), which was con-sistent with the original, uncorrected data (Fig. 3a3). When Sthr= 0.90, only one of two connected clusters in alpha or beta cells inBaron batchmerged with the corre-sponding cells in the Muraro batch, whereas the other remained unmixed (Fig. 3a2, Additional file 1: Figure S4a2). This observation was confirmed by themnnCorrect
andSeurat v3results, although both with a subtler distinc-tion of clusters (Fig.3a4, a7). The consistent observation indicated that observed cell clusters inferred alpha or beta cell subtypes that only appeared in theBaron batch, which could be detected whenSthr= 0.90.
To further investigate the potential cell subtypes, we per-formed differential gene expression analysis within alpha cells and beta cells on two pairs of cell populations. For alpha cells, we examined differential gene expression be-tween the mixed cluster fromMuraro batchversus the un-mixed cluster from Baron batch. We also separately examined differential gene expression between the mixed and unmixed cluster fromBaron batch. For beta cells, we performed the same two sets of differential gene expression analysis between the respective mixed cluster and the un-mixed cluster. We used the“FindMarkers”function in Seu-rat v2[22] to identify genes that have significantly different expression patterns in both pairs of cell populations (Add-itional file1: Table S1-S2), which resulted in genes related to important pancreatic functions. For example, ARXand
MAFB(Additional file1: Table S1, Fig. 3b1, b4) were sig-nificantly under-expressed in the unmixed alpha cells com-pared with the mixed alpha cells. PDX1, MAFA, and
MAFBwere significantly under-expressed in the unmixed beta cells compared with the mixed beta cells (Additional file1: Table S2, Fig.3b2–b4). Previous studies [34,35] have shown thatARX plays a key role in the differentiation of pancreatic islet cells. Moreover, the decrease of MAFA,
MAFB, andPDX1expression levels have been found in hu-man type 2 diabetes islet alpha and beta cells, which can be associated to islet cell dysfunction [36]. Identification of the aforementioned transcriptomic signatures suggested that the refined cell clusters that only exist inBaron batchmay contain cell subpopulations with altered pancreatic func-tions, which may warrant further biological investigation. As mentioned above, such cell subpopulations were also identified inSeurat v3andmnnCorrect.
BERMUDAproperly mapped human pan T cells to PBMCs
In order to show that BERMUDAcan transfer informa-tion between batches with more complicated cell popu-lations and reveal biological signals that might remain hidden when analyzing each batch individually, we also applied BERMUDA to two large scRNA-seq datasets of peripheral blood mononuclear cells (PBMCs) generated from the 10x Genomics Chromium platform (i.e., “PBMC batch”and “pan T cell batch”).PBMC batchand
pan T cell batch were acquired from different healthy donors. We expected that cell types in the pan T cell batch should be a subset of those in the PBMC batch, while the PBMC batch could contain other cell types such as B cells and monocytes. From the UMAP visualization of the uncorrected data (Additional file 1: Figure S5c), we speculated that the pan T cell batch
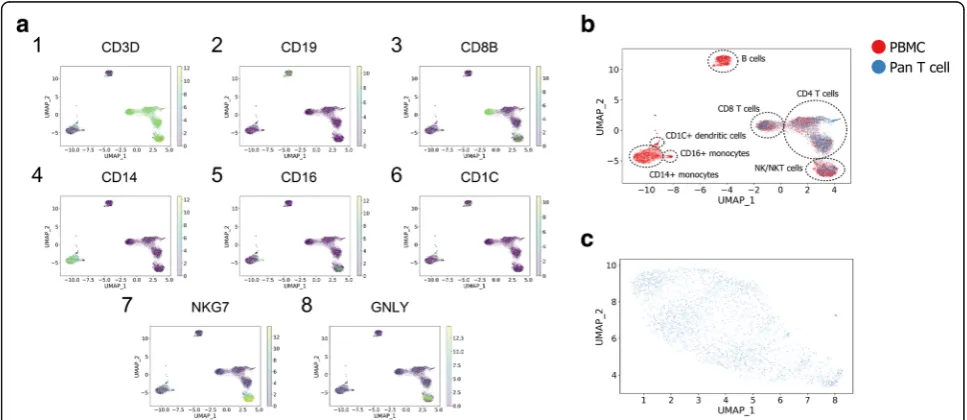
should roughly correspond to the largest cell cluster in the PBMC batch, while the other two smaller clusters should represent non-T cells in the PBMC batch. As shown in Fig. 4b, BERMUDA successfully retained the two PBMC-specific clusters, while mapping the T cell population properly.
Since the obtained data did not include pre-defined cell type labels, we evaluated the results by inspecting the expression patterns of marker genes using the UMAP visualizations. We identified seven major cell types in our results through corresponding marker genes: CD4 T cells (Fig. 4a1, a3), CD8 T cells (Fig.4a3), B cells (Fig. 4a2), CD1c+ dendritic cells (Fig. 4a6),
CD14+ monocytes (Fig. 4a4), CD16+ monocytes
(Fig. 4a5), and NK/NKT cells (Fig. 4a7–a8). Cell types that only existed in the PBMC batch (B cells, CD14+ monocytes, CD16+ monocytes, CD1c+ dendritic cells) retained a similar structure with the uncorrected original data (Additional file1: Figure S5a-c), which further dem-onstrated that our method can combine batches while preserving biological information that only existed in a subset of batches. Interestingly, the UMAP visualization ofpan T cell batchalone did not show any clear cluster-ing structures. However, different cell types within pan T cell batchwere further distinguished as different clus-ters by combining with PBMC cells. This indicates that
BERMUDAis capable of effectively transferring the bio-logical information from one batch to another and extracting biological insights from batches that might not be evident by studying each batch individually.
Conversely, Seurat v2 and Seurat v3 could not align the overlapping cell types from two batches properly (Additional file 1: Figure S5f, g). BBKNN
[image:8.595.56.540.463.673.2]overly corrected batch effects and lost the structure within the T cell cluster and the monocyte cluster observed in the original uncorrected data (Add-itional file 1: Figure S5e). mnnCorrect and scVI were able to align the shared cell types between two batches. However, scVI did not produce a homoge-neous mixture of both batches within pan T cells, while mnnCorrect produced a more heterogeneous structure within the T cell cluster when comparing to the uncorrected data visually (Additional file 1: Figure S5d, h).
BERMUDAcan be generalized to combine multiple batches
Since BERMUDA is based on applying MMD loss to similar clusters from different batches for batch effect removal, it can be easily generalized to deal with mul-tiple batches simultaneously. Here, we demonstrate such capability by including another human pancreas dataset generated by Segerstolpe et al. [37] (referred to as “Segerstolpe batch”). The Segerstolpe batch was gener-ated using the sequencing platform SMART-seq2 tech-nology and contained 2061 cells of interest.
Similar to the previous scenarios, two experiments were performed on the human pancreas dataset: one with all the cells in the dataset (referred to as “ Experi-ment all”, Additional file 1: Figure S6) and one with alpha and beta cells removed from both theBaron batch
and theSegerstolpe batch(referred to as“Experiment re-moval,”Additional file1: Figure S7).BERMUDA consist-ently produced competitive results in both experiments (Additional file 1: Figure S6c, S7c). Moreover, the afore-mentioned potential alpha and beta cell subpopulations in theBaron batchwere also consistently observed when setting Sthr= 0.90. This demonstrates that our method can naturally handle multiple batches simultaneously and generate consistent and robust results when number of batches increases.
Discussion
With the rapid advances of single-cell sequencing tech-nologies and the accumulation of large scRNA-seq data, it is important to combine data from different samples or studies to fully harness the power of scRNA-seq tech-niques, infer cell lineages, and identify bona fide tran-scriptional signals. Proper removal of batch effects between scRNA-seq experiments has become an urgent issue. Batch effects arise from many potential sources, such as different protocol-, platform-, or lab-specific ar-tifacts. In addition, cell type compositions differ among scRNA-seq experiments because of underlying biological variation. This increases the difficulty of distinguishing bona fide biological signals from systematic biases and accurately representing combined data from multiple sources.
In this study, we propose BERMUDA, a novel batch correction method based on the deep transfer learning framework. We considered scRNA-seq data from differ-ent batches as differdiffer-ent domains and utilized domain adaptation approaches to project the original data to a lower-dimensional space without batch effects. We dem-onstrated that BERMUDA can properly combine data from different batches in both simulated data and real datasets as long as there is one common cell type shared by a pair of batches. We observed thatBERMUDA out-performed existing methods (mnnCorrect, BBKNN,
Seurat v2,Seurat v3, andscVI) in three aspects: homoge-neously mixing the same cell type from different batches, maintaining the purity of batch-specific cell clusters, and separating different cell types in the com-bined dataset. By training an autoencoder with MMD loss on pairs of similar clusters, BERMUDA can effect-ively perform batch correction without considering the specific sources of batch effects. Because of this,
BERMUDA is capable of removing batch effects result-ing from various sources, such as simulated batch ef-fects, batch effects from the same platform in the PMBC dataset, and batch effects generated by different plat-forms in the human pancreas dataset. Moreover, by using a deep neural network framework and training through the mini-batch gradient descent algorithm,
BERMUDA is scalable to large numbers of cells, which is beneficial for the rapid adoption of scRNA-seq experiments.
BERMUDA only requires batches to share at least one common cell type with another batch, which is distinct from existing methods that do not account for cell type distributions across batches. Because BERMUDA per-forms batch correction based on similarity among cell clusters, it accommodates variation in both cell compos-ition across batches and also different cell populations. Ra-ther than considering a global batch effect, BERMUDA
removes batch effects locally by combining similar clusters while maintaining the global structure of the data. By ap-plying this approach, knowledge from one batch can be transferred to another, which augments biological insights that cannot be observed when examining each batch indi-vidually. For example, when directly visualizing thepan T cell batch, it did not show obvious clustering structures (Fig. 4c). However, by combining it with PBMCs, pan T cells were properly mapped to the corresponding cell clus-ters in the PBMC batch, providing a higher resolution of cell subtypes within thepan T cell batch(Fig.4b).
Typically, there is a trade-off between removing batch effects and retaining experimental specific biological sig-nals, causing some existing methods (such as BBKNN
and Seurat v2) to lose subtle biological signals while merging multiple batches for a more homogenous mix-ture of cells [38, 39].BERMUDAcan preserve and amp-lify the sensitivity to biological differences in the original data while properly removing batch effects. Specifically, the trade-off between a more homogeneous mixture within cell types and preserving more batch-specific bio-logical signals could be adjusted by changing the Sthr value, where a higher Sthrvalue can help to retain more biological signals that only exist in a subset of batches.
We demonstrate experimentally that BERMUDA is
proper batch correction and preserving batch-specific biological signals (Additional file1: Figure S8, S9).
BERMUDA also has limitations. Since the design of
BERMUDA is based on similarity between cell clusters, it can remove batch effects from scRNA-seq data with distinct cell populations effectively. However, clusters may not always be well separated due to technical or biological noise. Moreover, scRNA-seq data can also be continuously variable—such as data generated for cell differentiation. While BERMUDA was originally de-signed with a focus on scRNA-seq data with distinct cell populations, it can also accommodate such data by adjusting the resolution in the graph-based clustering algorithm and the trade-off between reconstruction loss and transfer loss to align clusters at a more granular level. It is also the focus of our future work to improve
BERMUDA to accommodate these data even more effectively. Another limitation is that the use of k-nearest neighbor in the clustering algorithm (integrated inSeurat v2) may not scale well to extremely large data-sets [24]; though, a neural-network-based framework for batch correction is capable of accommodating large datasets. However, novel clustering algorithms could be applied in the future to speed up the clustering process. For example, Ren et al. [40] proposed a novel framework for clustering large scRNA-seq data, which reduced the computational complexity to O(n) while maintaining a high clustering accuracy.
Conclusions
Removing batch effects is essential for the analysis of
data from multiple scRNA-seq experiments and
multiple technical platforms. Here we introduce
BERMUDA, a novel batch correction method for scRNA-seq data based on deep transfer learning. We use an autoencoder to learn a low-dimensional repre-sentation of the original gene expression profiles while removing the batch effects locally by incorpor-ating MMD loss on similar cell clusters. BERMUDA
provides several improvements compared to existing methods. Firstly, by introducing three different met-rics to evaluate the batch correction performance we
demonstrate that BERMUDA outperforms existing
methods in merging the same cell types, preserving cell types not shared by all the batches, and separat-ing different cell types. Secondly, BERMUDA can properly remove batch effects even when the cell population compositions across different batches are vastly different. Thirdly, BERMUDA can preserve batch-specific biological signals and discover new in-formation that might be hard to extract by analyzing each batch individually. Finally, BERMUDA can be easily generalized to handle multiple batches and can scale to large datasets.
Methods
Datasets used for performance evaluation
For consistency, in this paper, an individual dataset will be referred to as a “batch.” Multiple batches in-vestigating similar biological problems will be referred to as a “dataset.” We applied BERMUDA on simu-lated datasets, human pancreas cell datasets, and PBMC datasets to assess its performance (Table 1). We used two methods to generate simulated datasets for evaluating the performance of BERMUDA. For the 2D Gaussian dataset, we followed [20] to generate highly synthetic data with batch effects. We simulated two batches of four different cell types according to different bivariate normal distributions in a two-dimensional biological subspace. The cell population composition of each batch was generated randomly. Then we randomly projected the data to a 100-dimensional space to simulate the high-100-dimensional gene expression data. Gene-specific batch effects were generated by adding Gaussian noise to the high-dimensional data. For the Splatter dataset, we used the Splatter [31] package to simulate RNA sequence counts of two batches with four different cell popula-tions. Splatter can directly simulate multiple batches following similar cell type compositions at the same time. We set the cell population composition to be 0.4, 0.3, 0.2, and 0.1 among the four simulated cell types.
To evaluate whether BERMUDA can remove batch effects in real scRNA-seq data and extract meaningful biological insights, we also applied it to datasets of human pancreas cells and PBMCs. The pancreas dataset
was obtained from Gene Expression Omnibus
(GSE85241 for Muraro batch [32], GSE84133 for Baron batch [33]) and The European Bioinformatics Institute (E-MTAB-5061 for Segerstolpe batch [37]). The PBMC dataset was obtained from 10x Genomics support data-sets. To effectively compare the difference between the cases where all the cell types or only a subset of those were shared among batches, we only retained the shared cell types in the pancreas dataset. The details of the datasets are shown in Table1.
Framework ofBERMUDA
Preprocessing
Gene expression levels from each cell were first quanti-fied using transcript-per-million values (TPM). First, we restricted the analysis to genes that were highly variable based on Seurat v2 [22]. Gene expression values were normalized as
Gij¼ log2 TPMijþ1
; ð1Þ
where TPMijis the TPM of geneiin cellj. We subse-quently standardized expression per batch as
G0ij¼Gij−Gi
σi ;
ð2Þ
whereG′ijis the standardized expression level of gene
iin cellj.Gi is the mean expression level for geneiand σiis the standard deviation of expression level for genei. Then, we linearly scaled the expression level of each gene to [0, 1].
Clustering of cells and identifying similar cell clusters
Cell clusters were identified from each batch individually following the pipeline inSeurat v2[22].Seurat v2 imple-mented a clustering algorithm based on optimizing the modularity function on a k-nearest neighbor graph. We then used MetaNeighbor [8] to determine the similarity between clusters from different batches based on Spear-man correlation. Fornbatches each containsci clusters,
i= 1, 2, …, n, MetaNeighbor produces a similarity score for each pair of cell clusters by calculating the mean of area under the receiver operator characteristic curve (AUROC) in cross-validation. We denote Mi1;j1;i2;j2 as
the similarity score between cluster j1 in batch i1 and clusterj2in batchi2. Because we were interested in simi-lar clusters across different batches, we set the simisimi-larity score between clusters within the same batch to 0. For each cluster, we considered the most similar cluster in each of the other batches, such that
Mia;ja;ib;jb¼
Mia;ja;ib;jb; ifMia;ja;ib;jb¼ max Mia;ja;ib;j;j¼1;2;…;cib
;ia≠ib
0; otherwise
ð3Þ
We further made the similarity scores between two clusters symmetrical by modifyingMia;ja;ibjb as
Mia;ja;ib;jb¼ max Mia;ja;ib;jb;Mib;jb;ia;ja
;
ia;ib¼1;2;…;n;ja¼1;2;…;cia;jb¼1;2;…;cib:
ð4Þ
Instead of considering mutual nearest cell clusters, our criterion for identifying similar cell clusters summarized in Eqs.3and4can accommodate the case where a cell cluster in one batch corresponds to multiple clusters in another batch, which makesBERMUDAmore robust to the results
in the clustering step. Considering the case where clusterj1 in batchi1was identified to be similar to both clusterj2and j3in batch i2with high confidence by MetaNeighbor (e.g.,
Mi1;j1;i2;j2 ¼Mi2;j2;i1;j1 ¼0:99, Mi1;j1;i2;j3¼Mi2;j3;i1;j1 ¼0:98),
where clusterj2andj3in batchi2might be separated from a single, larger cluster by the clustering algorithm. If we only considered mutual nearest clusters, we would have only aligned cluster j1 in batch i1 with cluster j2 in batchi2. However, by using our proposed criterion, accord-ing to Eqs.3and4, we can getMi1;j1;i2;j3 ¼Mi2;j3;i1;j1 ¼0:98
(Mi1;j1;i2;j3 ¼0, Mi2;j3;i1;j1 ¼0:98 from Eq. 3 and
Mi1;j1;i2;j3 ¼ maxðMi1;j1;i2;j3;Mi2;j3;i1;j1Þ ¼0:98 from Eq. 4),
which faithfully captured the similarity relationships identified.
Finally, we binarized Mia;ja;ib;jb with a threshold value
Sthr, where
Mia;ja;ib;jb¼1 ifMia;ja;ib;jb≥Sthr;
ia;ib¼1;2;…;n;ja¼1;2;…;cia;jb¼1;2;…;cib: ð5Þ
This can prevent finding a spurious counterpart for a cluster (e.g., cluster j2 in batch i1) if such cluster was specific to only one batch. In this case, the similarity scores between clusterj2in batchi1to any other clusters should be lower than Sthr, which set Mi1;j2;i;j¼0;∀i;j
(Eq. 5). In this way, cluster j2 in batch i1 will not be aligned to other clusters during the training process of
BERMUDA. Sthr was chosen empirically and we ob-served thatBERMUDAachieved robust and competitive results across different datasets when Sthr was between 0.85 and 0.90 (Additional file1: Figure S8, S9).
Batch correction using an autoencoder
BERMUDA uses an autoencoder to project the original uncorrected gene expression profiles to a low-dimensional space to remove the experimental artifacts across different batches (Fig.1b). An autoencoder can be represented as a function x′=f(x) =fdecoder(fencoder(x)), where f reconstructs the input gene expression pro-file x through the neural network. To avoid trivial solutions, autoencoders usually incorporate a bottle-neck layer that learns a low-dimensional embedding of the input data called code, e.g., z=fencoder(x). In
BERMUDA, we used an autoencoder with three hid-den layers, and the default number of neurons in each hidden layer were 200, 20, and 200. For the synthetic data generated from bivariate Gaussian dis-tributions, we set the neurons in each hidden layer as 20, 2, and 20 to reconstruct the two-dimensional biological plane.
descent algorithm and is widely adopted in the field of deep learning. For each iteration in each epoch during the training process of BERMUDA, a “mini-batch”
X= {x1,x2,…,xB} was sampled from the dataset, which containednmbcells from each cluster (B¼nmb
Pn i¼1ci). We usednmb= 50 in our experiments. However, we ob-served thatBERMUDA was robust to the choice ofnmb and can outperform existing methods under a wide range of nmbvalues (Additional file 1: Figure S10). The loss was calculated on the entire mini-batch and the pa-rameters in BERMUDA were then updated using gradi-ent descgradi-ent. In each epoch, multiple iterations were performed to cover all the cells in the dataset.
The loss function for training the autoencoder con-sisted of two parts. The first part is a reconstruction loss between the output layer and the input layer defined by mean squared error
L1ð Þ ¼X
XB
i¼1
xi−x0i
2
2; ð6Þ
wherexi and x 0
i are input and reconstructed expression profile of the i-th cell in a mini-batch. The second part is a novel maximum mean discrepancy (MMD) based loss [29] that estimates the differences in distributions among similar cell clusters in different batches. MMD is a non-parametric distance estimate between distribu-tions based on the reproducing kernel Hilbert space (RKHS) and has proven to be highly effective in many deep transfer learning tasks [41–44]. Since MMD does not require density estimates as an intermediate step and does not assume any parametric density on the data, it can be applied to different domains [45]. MMD is also memory-efficient, fast to compute, and performs well on high dimensional data with low sample size [46, 47]. Considering the case where only a subset of the cell population is shared among batches, instead of applying MMD loss on batches entirely, we only considered the loss between pairs of similar cell clusters among differ-ent batches. So, the MMD-based loss can be defined as
L2ð Þ ¼X X
ia;ib;ja;jb
Mia;ja;ib;jb∙MMD Zia;ja;Zib;jb
;
ð7Þ
whereZi,j is the code of the inputXi, j, andXi,j is the expression profiles of cells from cluster j of batch i in the mini-batch X. MMD(∙) equals to zero when the underlying distributions of the observed samples are the same. By minimizing the MMD loss between the distri-butions of similar clusters, the autoencoder can be trained to remove batch effects in the bottleneck layer. In summary, the total loss function on a mini-batch can be written as
Lð Þ ¼X L1ð Þ þX λL2ð ÞX ; ð8Þ
whereλ is a regularization parameter. We followed the strategy introduced by Ganin et al. [48] to gradually in-crease λ during the training process. The regularization parameter at epochpis calculated as
λp ¼
2
1þe−10npp
−1; ð9Þ
wherenpis the number of total epochs in training. This can help the autoencoder to first focus on finding a proper low-dimensional representation of the original gene expression data, then focus on aligning the distri-butions of similar clusters in the low-dimensional space.
Performance evaluation
To evaluate the performance of BERMUDA, we exam-ined the outputs when specific cell types were removed from their respective batches. We then used three met-rics to compare algorithm performance. First, we used a k-nearest-neighbor based divergence estimation method [49] to evaluate the quality of merging the shared cell population among batches. For n scRNA-seq batches with gene expression profiles X1, X2, …, Xn and their corresponding batch-corrected low-dimensional embed-dingsZ1,Z2,…,Zn, we define
divergence score¼ 1 ndiv
X
i≠j;sðZi;ZjÞ≠∅;sðZj;ZiÞ≠∅DðsðZi;ZjÞ;sðZj;ZiÞÞ; ð10Þ
wheres(Zi,Zj) is the cell population in Zithat is shared by Zj, D(Zi,Zj) is the divergence estimation of the two distributions given samples Zi and Zj, and ndiv=∣{(i,
j)| i≠j, s(Zi,Zj)≠ ∅, s(Zj,Zi)≠ ∅}∣ is the number of pairs of batches with shared cell population. Since proper removal of batch effects should produce results where the distributions of shared cell populations among different batches are similar, a smaller divergence_score
is preferred, indicating that the shared cell population between different batches are homogeneously mixed. Second, we used entropy to evaluate whether a cell population that only exists in a certain batch remains distinct from other populations after correction. We define
entropy score¼ 1 nent
X
i≠j;dðZi;ZjÞ≠∅ 1
d Zi;Zj
X
k∈dðZi;ZjÞ Eð Þk;
ð11Þ
EðkÞ ¼X
n
i¼1
pilogðpiÞ; ð12Þ
wherepi is the proportion of cells from batch i among the NN-nearest neighbors of cell k. We choseNN= 100 in our evaluations. When batch effects are removed properly, a cell type that only exists in a batch should not be mixed with cells from other batches. So, a smaller
entropy_score is desired, suggesting that biological sig-nals only contained in a subset of batches are properly preserved during correction. Note that when all the batches share the same cell types, we did not calculate
entropy_scoreduring evaluation since there is no batch-specific cell population.
The divergence and entropy estimations were calculated for pairs of batches and then averaged to acquire a summary of the batch correction performance among multiple batches. When the dimensionality of the embedding was high, diver-gence_score and entropy_scorewere calculated based on the two-dimensional UMAP [30] embeddings of the data to de-rive robust estimations of divergence and entropy. UMAP is a general dimensionality reduction algorithm that can achieve competitive results compared to t-SNE [50], while preserves more global structures of the data.
Third, since divergence_score and entropy_score are both proposed to evaluate the mixture of cells among batches, we also compared a metric to evaluate the separation of different cell types after batch effects being removed. To this end, we calculated the silhou-ette coefficient with clusters defined by cell types. For a cell k, let a(k) be the average distance between k and all the other cells within the same cluster and
b(k) be the smallest average distance between k and all the cells in any other cluster, we define the silhou-ette coefficient of cell k as
Sð Þ ¼k bð Þk −að Þk
maxfað Þk ;bð Þkg: ð13Þ
The average silhouette coefficient of all the cells from different batches is calculated after batch effect removal, such that
silhouette score¼Xn 1
i¼1
jfkjk∈Zigj
Xn
i¼1 X
k∈Zi
SðkÞ: ð14Þ
A largersilhouette_scoreindicates that the cell type as-signment in the aligned dataset is more appropriate, where a cell is close to cells of the same type and distant from cells of different types. S(k) is calculated using Eu-clidean distance on the two-dimensional UMAP embed-dings of the results.
Performance comparison with popular batch correction methods
We comparedBERMUDAwith several existing state-of-the-art batch correction methods for scRNA-seq data, including
mnnCorrect[20],BBKNN[24],Seurat v2(v2.3.4) [22],Seurat v3(v3.0.0) [23], andscVI[28].BBKNNandmnnCorrectwere applied to log-transformed TPM data of variable genes. Seu-rat v2,Seurat v3, and scVIwere applied on the datasets fol-lowing the recommended workflow [22,23,28]. Due to the restriction of the workflow, we did not applySeurat v2,Seurat v3, andscVIon the Gaussian simulated gene expression data. To demonstrate the necessity of batch correction methods for scRNA-seq data, we also compared BERMUDA with batch correction methods for microarray and bulk RNA-seq data, such ascombat[14] andlimma[15] (Additional file1: Figure S3).
Additional files
Additional file 1:Supplementary figures and tables (PDF 3839 kb)
Additional file 2:Review history (DOCX 44 kb)
Acknowledgements
We thank Ms. Megan Metzger for the help in editing the manuscript.
Review history
The review history is available as Additional file2
Authors’contributions
TW, TSJ, JZ, and KH conceived the project. TW, TSJ, and WS conceived and designed the experiments. TW, TSJ, and ZL performed the experiments and analyzed the data. TW and KH developed the structure and arguments for the paper. TW, TSJ, and JZ wrote the manuscript. WS, BRH, JZ, and KH edited and revised the manuscript. All the authors reviewed and approved the final manuscript.
Funding
This work was supported by Indiana University Precision Health Initiative, the National Health Institute F31 Fellowship [F31LM013056], and National Cancer Institute Informatics Technology for Cancer Research (NCI ITCR) U01 [CA188547].
Availability of data and materials
The pancreas dataset was obtained from Gene Expression Omnibus (GSE85241 forMuraro batch[32], GSE84133 forBaron batch[33]) and The European Bioinformatics Institute (E-MTAB-5061 forSegerstolpe batch[37]). The PBMC dataset was obtained from 10x Genomics support datasets (https://support.10xgenomics.com/single-cell-gene-expression/datasets/2.1.0/ pbmc8kforPBMC batchand https://support.10xgenomics.com/single-cell-gene-expression/datasets/2.1.0/t_3kforPan T Cell batch). The
implementation ofBERMUDAcan be downloaded from Github (https:// github.com/txWang/BERMUDA) [51] and from Zenodo (DOI: 10.5281/ zenodo.3339320) [52].
Ethics approval and consent to participate Not applicable.
Consent for publication Not applicable.
Competing interests
Author details
1Department of Computer Science, Indiana University Bloomington, Bloomington, IN, USA.2Department of Biomedical Informatics, The Ohio State University, Columbus, OH, USA.3Department of Medicine, Indiana University School of Medicine, Indianapolis, IN, USA.4Guangdong Provincial Key Laboratory of Medical Image Processing, Southern Medical University, Guangzhou, China.5Department of Medical and Molecular Genetics, Indiana University School of Medicine, Indianapolis, IN, USA.6Regenstrief Institute, Indianapolis, IN, USA.
Received: 9 May 2019 Accepted: 17 July 2019
References
1. Saeys Y, Van Gassen S, Lambrecht BN. Computational flow cytometry: helping to make sense of high-dimensional immunology data. Nat Rev Immunol. 2016;16:449.
2. Wang D, Bodovitz S. Single cell analysis: the new frontier in‘omics’. Trends Biotechnol. 2010;28(6):281–90.
3. Huang WE, Stoecker K, Griffiths R, Newbold L, Daims H, Whiteley AS, et al. Raman-FISH: combining stable-isotope Raman spectroscopy and fluorescence in situ hybridization for the single cell analysis of identity and function. Environ Microbiol. 2007;9(8):1878–89.
4. Puppels GJ, de Mul FF, Otto C, Greve J, Robert-Nicoud M, Arndt-Jovin DJ, et al. Studying single living cells and chromosomes by confocal Raman microspectroscopy. Nature. 1990;347(6290):301–3.
5. Consortium SM-I. A comprehensive assessment of RNA-seq accuracy, reproducibility and information content by the sequencing quality control Consortium. Nat Biotechnol. 2014;32(9):903–14.
6. Marioni JC, Mason CE, Mane SM, Stephens M, Gilad Y. RNA-seq: an assessment of technical reproducibility and comparison with gene expression arrays. Genome Res. 2008;18(9):1509–17.
7. Consortium M, Shi L, Reid LH, Jones WD, Shippy R, Warrington JA, et al. The MicroArray Quality Control (MAQC) project shows inter- and intraplatform reproducibility of gene expression measurements. Nat Biotechnol. 2006; 24(9):1151–61.
8. Crow M, Paul A, Ballouz S, Huang ZJ, Gillis J. Characterizing the replicability of cell types defined by single cell RNA-sequencing data using
MetaNeighbor. Nat Commun. 2018;9(1):884.
9. Draghici S, Khatri P, Eklund AC, Szallasi Z. Reliability and reproducibility issues in DNA microarray measurements. Trends Genet. 2006;22(2):101–9. 10. Labaj PP, Kreil DP. Sensitivity, specificity, and reproducibility of RNA-Seq
differential expression calls. Biol Direct. 2016;11(1):66.
11. Shi L, Campbell G, Jones WD, Campagne F, Wen Z, Walker SJ, et al. The MicroArray Quality Control (MAQC)-II study of common practices for the development and validation of microarray-based predictive models. Nat Biotechnol. 2010;28(8):827–38.
12. Chen C, Grennan K, Badner J, Zhang D, Gershon E, Jin L, et al. Removing batch effects in analysis of expression microarray data: an evaluation of six batch adjustment methods. PLoS One. 2011;6(2):e17238.
13. Diboun I, Wernisch L, Orengo CA, Koltzenburg M. Microarray analysis after RNA amplification can detect pronounced differences in gene expression using limma. BMC Genomics. 2006;7:252.
14. Johnson WE, Li C, Rabinovic A. Adjusting batch effects in microarray expression data using empirical Bayes methods. Biostatistics. 2007;8(1): 118–27.
15. Ritchie ME, Phipson B, Wu D, Hu Y, Law CW, Shi W, et al. limma powers differential expression analyses for RNA-sequencing and microarray studies. Nucleic Acids Res. 2015;43(7):e47.
16. Leek JT. svaseq: removing batch effects and other unwanted noise from sequencing data. Nucleic Acids Res. 2014;42(21):e161.
17. Li WV, Li JJ. An accurate and robust imputation method scImpute for single-cell RNA-seq data. Nat Commun. 2018;9(1):997.
18. Lin P, Troup M, Ho JW. CIDR: ultrafast and accurate clustering through imputation for single-cell RNA-seq data. Genome Biol. 2017;18(1):59. 19. Liu Q, Herring CA, Sheng Q, Ping J, Simmons AJ, Chen B, et al. Quantitative
assessment of cell population diversity in single-cell landscapes. PLoS Biol. 2018;16(10):e2006687.
20. Haghverdi L, Lun ATL, Morgan MD, Marioni JC. Batch effects in single-cell RNA-sequencing data are corrected by matching mutual nearest neighbors. Nat Biotechnol. 2018;36(5):421–7.
21. Johnson T, Abrams Z, Zhang Y, Huang K. Mapping neuronal cell types using integrative multi-species modeling of human and mouse single cell Rna sequencing. Pac Symp Biocomput. 2016;22:599–610.
22. Butler A, Hoffman P, Smibert P, Papalexi E, Satija R. Integrating single-cell transcriptomic data across different conditions, technologies, and species. Nat Biotechnol. 2018;36(5):411–20.
23. Stuart T, Butler A, Hoffman P, Hafemeister C, Papalexi E, Mauck WM 3rd, et al. Comprehensive integration of single-cell data. Cell. 2019;177(7):1888–902 e21. 24. Park J-E, Polanski K, Meyer K, Teichmann SA. Fast batch alignment of single cell transcriptomes unifies multiple mouse cell atlases into an integrated landscape. bioRxiv. 2018.https://doi.org/10.1101/397042.
25. Barkas N, Petukhov V, Nikolaeva D, Lozinsky Y, Demharter S, Khodosevich K, et al. Wiring together large single-cell RNA-seq sample collections. bioRxiv. 2018.https://doi.org/10.1101/460246.
26. Korsunsky I, Fan J, Slowikowski K, Zhang F, Wei K, Baglaenko Y, et al. Fast, sensitive, and accurate integration of single cell data with Harmony. bioRxiv. 2018.https://doi.org/10.1101/461954.
27. Welch J, Kozareva V, Ferreira A, Vanderburg C, Martin C, Macosko E. Integrative inference of brain cell similarities and differences from single-cell genomics. bioRxiv. 2018.https://doi.org/10.1101/459891.arXiv:1802.03426. 28. Lopez R, Regier J, Cole MB, Jordan MI, Yosef N. Deep generative modeling
for single-cell transcriptomics. Nat Methods. 2018;15(12):1053–8.
29. Gretton A, Sejdinovic D, Strathmann H, Balakrishnan S, Pontil M, Fukumizu K, et al. Optimal kernel choice for large-scale two-sample tests. Stateline: NIPS; 2012. p. 1205–13.
30. McInnes L, Healy J, Melville J. Umap: Uniform manifold approximation and projection for dimension reduction. arXiv. 2018;1802:03426.
31. Zappia L, Phipson B, Oshlack A. Splatter: simulation of single-cell RNA sequencing data. Genome Biol. 2017;18(1):174.
32. Muraro MJ, Dharmadhikari G, Grun D, Groen N, Dielen T, Jansen E, et al. A single-cell transcriptome atlas of the human pancreas. Cell Syst. 2016;3(4): 385–94 e3.
33. Baron M, Veres A, Wolock SL, Faust AL, Gaujoux R, Vetere A, et al. A single-cell transcriptomic map of the human and mouse pancreas reveals inter-and intra-cell population structure. Cell Syst. 2016;3(4):346–60 e4. 34. Collombat P, Mansouri A, Hecksher-Sorensen J, Serup P, Krull J, Gradwohl G,
et al. Opposing actions of Arx and Pax4 in endocrine pancreas development. Genes Dev. 2003;17(20):2591–603.
35. Gage BK, Asadi A, Baker RK, Webber TD, Wang R, Itoh M, et al. The role of ARX in human pancreatic endocrine specification. PLoS One. 2015;10(12): e0144100.
36. Guo S, Dai C, Guo M, Taylor B, Harmon JS, Sander M, et al. Inactivation of specific beta cell transcription factors in type 2 diabetes. J Clin Invest. 2013; 123(8):3305–16.
37. Segerstolpe A, Palasantza A, Eliasson P, Andersson EM, Andreasson AC, Sun X, et al. Single-cell transcriptome profiling of human pancreatic islets in health and type 2 diabetes. Cell Metab. 2016;24(4): 593–607.
38. Johnson TS, Wang T, Huang Z, Yu CY, Wu Y, Han Y, et al. LAmbDA: label ambiguous domain adaptation dataset integration reduces batch effects and improves subtype detection. Bioinformatics. 2019.https://doi.org/10.1 093/bioinformatics/btz295.
39. Huang M, Wang J, Torre E, Dueck H, Shaffer S, Bonasio R, et al. SAVER: gene expression recovery for single-cell RNA sequencing. Nat Methods. 2018; 15(7):539–42.
40. Ren X, Zheng L, Zhang Z. SSCC: a computational framework for rapid and accurate clustering of large-scale single cell RNA-seq data. Genomics, Proteomics & Bioinformatics. 2019;17(2):201–10.
41. Ghifary M, Kleijn WB, Zhang M. Domain Adaptive Neural Networks for Object Recognition. Gold Coast: PRICAI; 2014. p. 898–904.
42. Long M, Cao Y, Wang J, Jordan MI. Learning transferable features with deep adaptation networks. Lille: ICML; 2015. p. 97–105.
43. Long M, Zhu H, Wang J, Jordan MI. Deep transfer learning with joint adaptation networks. Sydney: ICML; 2017. p. 2208–17.
44. Wei Y, Zhang Y, Huang J, Yang Q. Transfer Learning via Learning to Transfer. Stockholm: ICML; 2018. p. 5085–94.
45. Gretton A, Borgwardt KM, Rasch MJ, Scholkopf B, Smola A. A kernel two-sample test. J Mach Learn Res. 2012;13:723–73.
47. Gretton A, Borgwardt KM, Rasch M, Scholkopf B, Smola AJ. A kernel method for the two-sample-problem. Vancouver: NIPS; 2006. p. 513–20.
48. Ganin Y, Lempitsky V. Unsupervised Domain Adaptation by Backpropagation. Lille: ICML; 2015. p. 1180–9.
49. Wang Q, Kulkarni SR, Verdu S. Divergence estimation for multidimensional densities via k-nearest-neighbor distances. IEEE Trans Inf Theory. 2009;55(5): 2392–405.
50. Lvd M. Hinton G. Visualizing data using t-SNE. J Mach Learn Res. 2008;9: 2579–605.
51. Wang T, Johnson TS, Shao W, Lu Z, Helm BR, Zhang J, et al. BERMUDA: a novel deep transfer learning method for single-cell RNA sequencing batch correction reveals hidden high-resolution cellular subtypes. Source Code. Github; 2019.https://github.com/txWang/BERMUDA. Accessed 17 July 2019. 52. Wang T, Johnson TS, Shao W, Lu Z, Helm BR, Zhang J, et al. BERMUDA: a
novel deep transfer learning method for single-cell RNA sequencing batch correction reveals hidden high-resolution cellular subtypes. Source Code. Zenodo. 2019.https://doi.org/10.5281/zenodo.3339320.
Publisher’s Note