R E S E A R C H
Open Access
Impact of flanking chromosomal sequences
on localization and silencing by the human
non-coding RNA XIST
Angela D. Kelsey
1†, Christine Yang
1†, Danny Leung
2,3, Jakub Minks
1, Thomas Dixon-McDougall
1, Sarah E.L. Baldry
1,
Aaron B. Bogutz
1, Louis Lefebvre
1and Carolyn J. Brown
1*Abstract
Background:X-chromosome inactivation is a striking example of epigenetic silencing in which expression of the long non-coding RNA XIST initiates the heterochromatinization and silencing of one of the pair of X chromosomes in mammalian females. To understand how the RNA can establish silencing across millions of basepairs of DNA we have modelled the process by inducing expression ofXISTfrom nine different locations in human HT1080 cells. Results:Localization of XIST, depletion of Cot-1 RNA, perinuclear localization, and ubiquitination of H2A occurs at all sites examined, while recruitment of H3K9me3 was not observed. Recruitment of the heterochromatic features SMCHD1, macroH2A, H3K27me3, and H4K20me1 occurs independently of each other in an integration site-dependent manner. Silencing of flanking reporter genes occurs at all sites, but the spread of silencing to flanking endogenous human genes is variable in extent of silencing as well as extent of spread, with silencing able to skip regions. The spread of H3K27me3 and loss of H3K27ac correlates with the pre-existing levels of the modifications, and overall the extent of silencing correlates with the ability to recruit additional heterochromatic features.
Conclusions:The non-coding RNA XIST functions as acis-acting silencer when expressed from nine different locations throughout the genome. A hierarchy among the features of heterochromatin reveals the importance of interaction with the local chromatin neighborhood for optimal spread of silencing, as well as the independent yet cooperative nature of the establishment of heterochromatin by the non-coding XIST RNA.
Keywords:XIST, Long non-coding RNA, Dosage compensation, X-chromosome inactivation, Nucleolar localization, Facultative heterochromatin, SMCHD1, macroH2A, H3K27me3, H4K20me1
Background
To avoid a functional gene dosage imbalance between the sexes, one of the two X chromosomes in female placental mammals is transcriptionally silenced [1]. This process of X-chromosome inactivation (XCI) occurs early in develop-ment and is generally random in all human tissues with either the paternal or maternal X chromosome becom-ing the inactive X (Xi). The X-inactivation centre (XIC), which is located at Xq13 in humans, is the region of the X that is necessary for the chromosome to be inac-tivated, and contains the XISTgene (X-inactive specific
transcript) [2–4]. Remarkably, the approximately 17 kb spliced and polyadenylated long non-coding XIST RNA uniquely localizes to the chromosome from which it is transcribed [5]. The coating of the Xi by the XIST RNA results in a substantial epigenetic transformation, losing epigenetic modifications associated with active chromatin (notably histone acetylation) and gaining modifications associated with inactive chromatin (including H3K27me3, H3K9me2/3, H4K20me1, and H2AK119u1). The Xi also becomes enriched in several other proteins, including the histone variant macrohistone H2A (macroH2A), the nu-clear matrix protein hnRNPU, and the epigenetic regula-tors SMCHD1 and ASH2L ([6, 7], reviewed in [8]). In addition, the Xi is peripherally or perinucleolarly localized [9] with perinucleolar targeting during S phase suggested * Correspondence:[email protected]
†Equal contributors
1
Department of Medical Genetics, Molecular Epigenetics Group, Life Sciences Institute, University of British Columbia, Vancouver, Canada
Full list of author information is available at the end of the article
to be important for maintenance of silencing. A further feature of the Xi is silencing of repetitive elements, as visualized by loss of RNA hybridization with a Cot-1 probe for repetitive DNA [10] resulting in what has been termed a‘Cot-1 hole’.
The timing of acquisition of these features has been best studied in mouse, where the differentiation of em-bryonic stem cells (ESCs) provides anin vitromodel for the events of XCI (reviewed in [11]). Early studies in mouse suggested the presence of a developmental window beyond which Xist was unable to induce X-chromosome inactiva-tion [12], although macroH2A could be recruited [13]. After this stage,Xistexpression was no longer required for main-tenance of silencing [14], consistent with studies in human showing maintenance of silencing in the absence of XIST [15, 16]. SATB1 has been suggested to be involved in defin-ing such a window forXist function [17]; however, Satb1/ Satb2-deficient mice are able to undergo X inactivation [18]. More recent studies have shown that induction ofXistcan recruit H3K27me3 in mouse somatic cells [19], and XIST induction recruits multiple features of the Xi in human somatic cells [10, 20]. In addition, an ongoing role forXist in stable silencing of the Xi has been shown by loss ofXist resulting in gene reactivation, loss of perinucleolar associ-ation and loss of H3K27me3 [21]. Loss of X-linked gene si-lencing is enhanced by disruption of DNA methylation and other pathways that cooperate with Xist, thus reactivation of X-linked markers has been used to identify additional players in the pathway [22–24]. Characterization of the on-going role forXISTin somatic cells has important implica-tions for disease, as highlighted by a recent study showing that deletion ofXistresults in hematological malignancies in female mice due to reactivation of X-linked genes [25].
There is substantial evidence for cooperativity of multiple silencing pathways in the initial silencing of the chromo-some, with XCI able to proceed in the absence of key com-ponents of the silencing machinery such as PRC2 [26–28], PRC1 [29], or macroH2A [30]. In addition to multiple fac-tors cooperating in the process of XCI, different X-linked genes may be silenced (or maintained silent) by different players. For example, mutation of theSmchd1gene results in loss of DNA methylation and partial to full reactivation of approximately 20 % of the X-linked genes in mouse [31, 32]. Surprisingly, many of the marks of an Xi can be re-cruited by a mouse transgene containing a deletion that makes the Xist RNA defective in silencing, although often the recruitment is not as effective as seen with a full-length Xist (reviewed in [8]). This silencing defective Xist RNA is also able to form a 1 hole [33], consistent with the Cot-1 hole not reflecting X-linked gene silencing [34], but rather a core of silenced non-coding DNA [35].
Spread of silencing to autosomal genes has been observed in unbalanced X/autosome translocations; however, the ex-tent of autosomal silencing is highly variable in both humans
(reviewed in [36]) and mice [37]. Silencing of autosomal genes has also been observed upon integration of Xist/ XIST transgenes into autosomes, and localization of the RNA to the autosome is able to induce many features of the Xi including nucleolar localization [10, 20, 21, 38]. Re-cently, an XIST transgene was integrated into chromo-some 21 in induced pluripotent stem cells from an individual with Down’s syndrome and corrected gene ex-pression from chromosome 21 to near normal disomic levels [39]. Together, these studies demonstrate the XIST RNA is able not only to spread along autosomal material but also to recruit some of the heterochromatic features associated with XCI to autosomes. The silencing of the tri-somic chromosome 21 in induced pluripotent stem cells was proposed as a first step towards‘chromosome therapy’ [39], and for such uses ofXISTa better understanding of the influence of the chromatin neighborhood is necessary.
XIST expression is required to induce the cascade of changes that cooperatively silence the X, but relatively lit-tle is known about the process by which the non-coding RNA recruits these changes. In human somatic cells we have reported the recruitment of several features of XCI, including gene silencing, followingXIST expression from an inducible transgene [20, 40]. The separation of XIST expression from the myriad of changes that occur during differentiation provides an opportunity to dissect the role of XIST in XCI. By using this inducible XIST transgene to examine the influence of XIST expression induced from nine different integration sites we aimed to establish a hierarchy to the features that are recruited by XIST and determine if any were influenced by the genomic context of the XIST integration. We were able to identify features (Cot-1 hole formation, perinucleolar localization, proximal reporter silencing, and H2AK119u1) that are recruited to all integrations and thus are compatible with any of the sites/genomic contexts tested, a feature that is not recruited to any site examined (H3K9me3) while another set of features (macroH2A, H3K27me3, SMCHD1, and H4K20me1 recruitment) are dependent on genomic con-text, but appear independent of each other.
Results
XIST RNA expression results in depletion of Cot-1 RNA and increased perinucleolar location
containing a constitutive Tet-repressor transgene to allow induction of XIST by treatment of the cells with the tetra-cycline analog doxytetra-cycline (DOX). The sites of the FRT in-tegrations were identified by inverse PCR and sequencing to be 1p, 3q, 4q, 7p, 7q, 8p, 12q, 15q, and an X chromo-some FRT site at Xq23 was previously reported [41]. The integration sites (described in Additional file 1) are in both G-dark and G-light regions (four and five, respectively), and three integrations occurred within a gene.
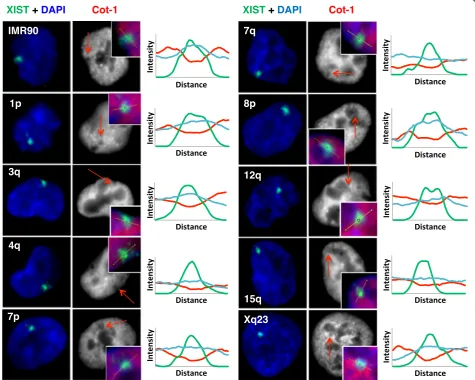
For each clone, the inducible promoter was activated for 5 days and the localization of XIST RNA assessed by RNA FISH. At each integration site the XIST RNA was able to localize and formed an XIST cloud comparable to that observed in normal female cells (Fig. 1). The level of XIST RNA varied between cell lines and also within different cultures of the same cell line, showing from
five- to 30-fold induction of XIST after 5 days of DOX (Additional file 1). The integrations into 3q, 7p, and 15q (all G-dark) showed lower expression by q-RT-PCR, which is consistent with a significantly smaller signal for XIST for the 3q integration clone relative to all other in-tegrations except for 15q (P ≤0.01). Co-hybridization with fluorescently labelled Cot-1 also showed depletion of Cot-1 hybridization coincident with the XIST cloud at each integration site, observable in the line diagrams of signal intensity across the XIST cloud (Fig. 1). Recently stable Cot-1 repeat RNA has been shown to be associ-ated with euchromatic chromosomes, yet excluded from the Xi resulting in the Cot-1 RNA hole [42]. We noted differences in the intensity of the Cot-1 holes; however, in attempting to quantify such differences it became apparent that the XIST RNA signal was often
Fig. 1XIST RNA localizes and forms Cot-1 holes when expressed from nine different integration sites. Shown is XIST RNA FISH (green) upon expression
[image:3.595.62.538.294.674.2]at the nuclear or nucleolar periphery in the HT1080 cells, and that measuring the intensity of the Cot-1 hole could be influenced by nuclear location. The Xi is generally lo-cated at the nuclear or nucleolar periphery; however, as these were autosomal integration sites, it seemed that ex-pression of XIST might be altering nuclear location.
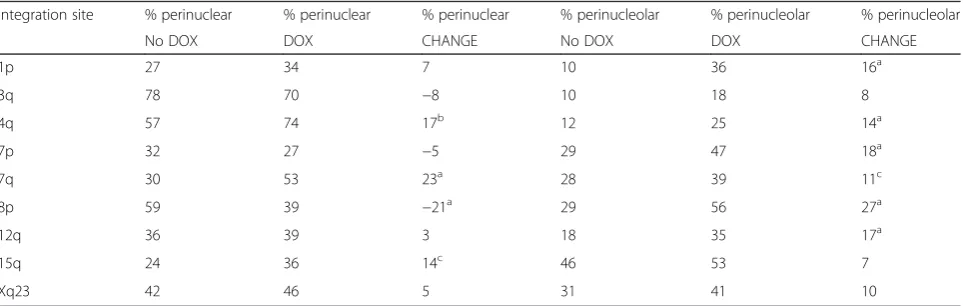
To test whether XIST expression was relocating the chromosome from which it was expressed, the XIST signal was scored for being in contact with either the nuclear periphery or the nucleolus, prior to and after XIST induction. Prior to DOX induction there was only a small focus of XIST expression (see [20]); however this signal was sufficient to identify the location of the inte-grated XIST. In six of the nine integration sites, induc-tion with DOX resulted in a significant increase in perinucleolar localization (P≤0.05), a trend shared with the other integration sites (Table 1). Perinuclear associ-ation, on the other hand, showed no significant differ-ence for five of the integrations, with three integrations showing a significant increase and the 8p integration showing a significant decrease (P ≤0.01; Table 1). The full distribution of localization before and after induction of XIST is shown in Additional file 2. The 8p integration site showed the highest proportion of perinucleolar-associated XIST signals (56 %) and also the greatest increase in perinucleolar association following XIST induction (27 %). In mouse, localization of Xist to the perinucleolar compartment was shown to be necessary for the silencing activity of Xist [21], leading us to ques-tion whether the differing nucleolar recruitment and Cot-1 hole formation that we observed might be reflect-ive of silencing ability.
XIST RNA expression silences nearby reporter and endogenous genes
We previously reported silencing of a flanking EGFP reporter gene at the 3q integration site [20, 40]. At the other FRT sites we did not co-integrate a reporter
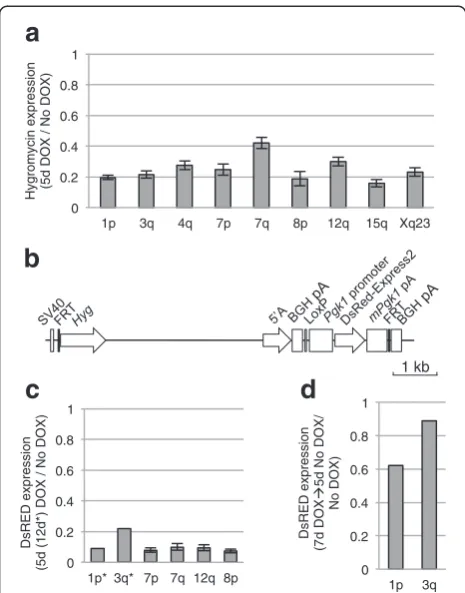
construct; however, the integration of XIST into the FRT site results in expression of an upstream Hygromy-cin (Hyg) gene. Robust silenHygromy-cing ofHygwas observed at all integrations after 5 days of XIST expression (Fig. 2a), suggesting that XIST is able to silence a virally-derived promoter (SV40), consistent with our previous demon-stration that an EGFP reporter driven by the CMV pro-moter could be silenced [20]. The 7q integration site showed significantly less silencing than the 1p, 3q, 7p, 8p, 15q, and Xq integration sites (P ≤0.01). As only the repeat A region of XISTis required for silencing of the flanking reporter genes [40], we generated a construct containing the XIST repeat A and a DsRed reporter driven by the mouse Pgk1 gene promoter, which is nor-mally X-linked and subject to XCI (Fig. 2b). We integrated this construct into six of the integration sites and again observed consistent silencing of greater than 90 % (Fig. 2c), suggesting both viral and mouse-derived promoters could be silenced by XIST in the HT1080 cells. Consistent with previous results with theEGFPreporter gene at 3q, silen-cing of the dsRed reporter was reversible when induction of XIST expression was stopped by removal of DOX (Fig. 2d).
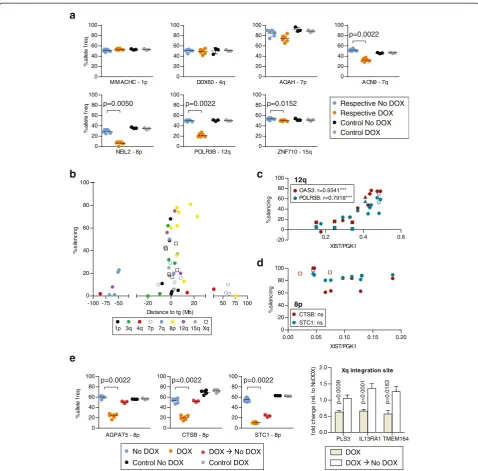
[image:4.595.58.540.563.716.2]Given the capacity of the XIST RNA to silence in cis, and the apparent spread of the RNA along the chromo-some based on our RNA FISH data, we questioned whether there would be silencing of endogenous genes at additional sites adjacent to the XIST transgenes. The HT1080 cells remain diploid although they carry several structural rearrangements (46,XY,del (1)(p21), i(3)(p10), i(3)(q10), der(4)t(1;4)(p21;p16), der(5)t(5;5)(p15;?), der(11)t(3;11)(q11;q25) see additional details in methods). We generated allele-discriminating pyrosequencing assays to examine silencing of candidate genes flanking the integration sites (Fig. 3). The phase of the polymor-phisms relative to the integration was not known, but the allelic expression change upon DOX induction of XIST is presented as a cis-linked loss of expression as
Table 1Increased nucleolar association of chromosomes expressing transgenic XIST
Integration site % perinuclear % perinuclear % perinuclear % perinucleolar % perinucleolar % perinucleolar
No DOX DOX CHANGE No DOX DOX CHANGE
1p 27 34 7 10 36 16a
3q 78 70 −8 10 18 8
4q 57 74 17b 12 25 14a
7p 32 27 −5 29 47 18a
7q 30 53 23a 28 39 11c
8p 59 39 −21a 29 56 27a
12q 36 39 3 18 35 17a
15q 24 36 14c 46 53 7
Xq23 42 46 5 31 41 10
previously demonstrated for the 3q integration for which we were able to assign the allelic loss to the chromosome bearing the inducible XIST [40]. Individ-ual pyrosequencing results for the locus closest to 5 Mb from the integration site are shown in Fig. 3a, with the silencing percentages for all genes examined shown in Fig. 3b as a function of distance from the inte-gration site (all assays are shown in Additional file 3). While no significant changes were observed for the con-trol integrations (clones withXISTintegrated on different chromosomes), allXISTintegration sites except 4q showed
at least one gene with significant allelic silencing. There was much more variability between integration sites for endogenous gene silencing than was seen for the silencing of Hyg. The 8p-integrated XISTclone displayed the most silencing, with four out of the five genes tested showing 60–80 % silencing. The 4q clone, in contrast, showed no significant silencing for any of the three genes tested. Two different integration sites on chromosome 7 showed quite different results, with only one of seven genes assayed showing over 20 % silencing for the 7p integration site, while five of the seven genes showed over 20 % silencing with XIST expressed from the 7q integration site. There was also discontinuous spread of silencing. For example, in the 1p integration site clone, two genes located approxi-mately 200 kb from the XIST transgene failed to silence (1 % silencing), whereas the RHBDL2 gene located ap-proximately 400 kb from the XIST transgene silenced by approximately 70 %. In addition to variation between the integration sites in the number of genes that were silenced, there were also significant differences in the extent of gene silencing between genes that showed silencing. More than half of the significant changes demonstrated less than 50 % silencing of one allele, and a significant change as small as 6 % for theZNF710gene on 15q was observed, indicating that XIST can cause a continuum of silencing.
To distinguish differences between clones that are attributable to the integration site rather than clone-to-clone variation, we analyzed clones that were inde-pendent integrations of the XIST cDNA into the same genomic location. Intriguingly, for the 12q integration site, we observed a significant correlation between the amount of silencing and the level of XIST expression (Fig. 3c). This correlation was observed for both cultures of the same single-cell clone and additional independent clones at the same integration site. Such a correlation was not observed for genes silenced by XIST expression from the 8p integration site using multiple cultures and two independent clones (Fig. 3d). Thus, while variation in the level of XIST expression occurred within a clone, the im-pact of this variation depended on the integration site, and with similar XIST expression a similar extent of silencing was observed between independent integrations into the same FRT site. A second clone from the Xq integration site showed very similar silencing, while a second clone from the 7q integration site showed lower XIST expres-sion levels and failed to silence (Additional files 1 and 3), suggesting that the silencing ability of 7q integrations, like 12q integrations, might be influenced by XIST expression levels. Since the clones at the 8p integration site si-lenced across a range of XIST levels, it seemed possible that, unlike silencing of the reporter genes, the main-tenance of silencing of endogenous genes might not be XIST-dependent, so we analyzed silencing of endogen-ous flanking genes after removal of DOX for the 8p 0
0.2 0.4 0.6 0.8 1
1p* 3q* 7p 7q 12q 8p
DsRED expression
(5d (12d*) DOX / No DOX)
0 0.2 0.4 0.6 0.8 1
1p 3q 4q 7p 7q 8p 12q 15q Xq23
Hygromycin expression (5d DOX / No DOX)
a
b
c
0 0.2 0.4 0.6 0.8 1
1p 3q
DsRED expression
(7d DOX
5d No DOX/
No DOX)
d
1 kb
Fig. 2Silencing of flanking reporter genes upon XIST expression
[image:5.595.57.290.87.384.2]0 20 40 60 80 100 0 20 40 60 80 100 0 20 40 60 80 100
0.00 0.05 0.10 0.15 0.20
0 20 40 60 80 100 XIST/PGK1 % s ile n c in g
0.2 0.4 0.6
-20 0 20 40 60 80 100 XIST/PGK1 % s ilenc ing
a
b
3q1p 4q 7p 7q 8p 12q 15q Xq
c
MMACHC - 1p DDX60 - 4q AOAH - 7p
p=0.0022
ACN9 - 7q
Respective No DOX Respective DOX Control No DOX Control DOX
NEIL2 - 8p
% a lle le f re
q p=0.0050 p=0.0022
POLR3B - 12q
p=0.0152
ZNF710 - 15q 0 20 40 60 80 100 % a lle le f re q 0 20 40 60 80 100 0 20 40 60 80 100 0 20 40 60 80 100 0 20 40 60 80 100 0 20 40 60 80 100 0 20 40 60 80 100 8p CTSB: ns STC1: ns
d
12q OAS3: r=0.9341*** POLR3B: r=0.7918***-100 -75 -50 0 20 40 60 80 100
-20 0 20 50 75 100
Distance to tg (Mb)
% s ilenc ing
e
% a llel e f reqAGPAT5 - 8p CTSB - 8p STC1 - 8p
No DOX DOX
Control No DOX Control DOX
Xq integration site
PLS3 IL13RA1 TMEM164
0.0 0.5 1.0 1.5 2.0 fo ld c h ange ( re
l. to N
o D O X ) DOX
p=0.0039 p<0.0001 p=0.0183
p=0.0022 p=0.0022 p=0.0022
DOX No DOX
DOX No DOX
Fig. 3Allelic silencing of flanking endogenous genes upon XIST induction.aAllele-discriminating RT-PCR pyrosequencing assay for genes closest
[image:6.595.58.537.87.558.2]and Xq integration sites. All genes examined showed partial to complete reactivation (Fig. 3e) 5 days after in-duction of XIST had ceased, indicating that the silen-cing observed requires ongoing XIST expression.
RNA-seq confirms differences in silencing capacity of XIST at different integrations
The significant differences between the integration sites in their capacity to silence endogenous genes suggested an important impact of the genomic context of the inte-gration; however, it was possible that by chance the genes chosen to be tested were non-random in their ability to silence. Therefore, we chose to examine three clones with XIST at different integration sites using RNA-seq to generate a detailed view of any variability in silencing capacity. We chose to examine the 8p and 12q integration sites, which had shown the most silencing, but different sensitivities to XIST levels, as well as the 1p integration site, which had shown limited silencing.
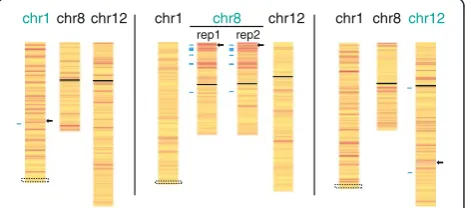
As our candidate genes examined by pyrosequencing had shown significant reductions in gene expression that ranged from as little as 6 % to approximately 80 % silen-cing of one allele, we did not expect complete silensilen-cing of one allele that would reduce expression levels overall by 50 %. We chose a stringent threshold of 30–60 % total reduction to classify genes as silencing, at which level a significantly greater proportion of genes were ob-served within 30 Mb of the 8p and 12q integration sites compared to the genome (Chi-square test, P <0.0001). Consistent with our candidate gene analysis, the increase in proportion of genes in this range was not significant for the 1p integration site. Examination of expression changes as an allelic change is more sensitive to the par-tial reduction of expression of one allele, and should also still detect changes in allelic expression when the total expression level of the gene is regulated in trans although the number of genes that can be examined is reduced by the requirement for an expressed poly-morphism. We examined the allelic change in expression on chromosomes 1, 8, and 12 (Fig. 4), and again a sig-nificantly higher proportion of genes showing an allelic change of greater than 30 % was seen for genes flanking the 8p integration site. A Chi-square permutation test demonstrated that the number of genes silenced on 8p following XIST induction decreased with increasing dis-tance (P= 0.008). The biological duplicate for RNA-seq was highly concordant for the percent allelic gene silen-cing for 8p (Spearman r= 0.5806; P <0.0001 for genes with FPKM≥5). The proportion of genes showing allelic silencing for genes flanking the 1p integration site was significant (P= 0.0269); however no significant change was seen for the 12q integration site. We show only the distal end of chromosome 1 as the HT1080 cells carry a translocation of one chromosome 1 to chromosome 4
(approximately 55 Mb distal to the integration site). We validated several of the observed changes by py-rosequencing or q-PCR, and the assays are included in Additional file 3, and highlighted on Fig. 4. Percent allelic silencing was highly concordant between pyro-sequencing and RNA-seq (r= 0.9341; P <0.0001). Of the 17 genes showing at least 50 % allelic silencing in both 8p RNA-seq replicates, two genes (DLC1and STC1) did not show a decrease in total expression, suggesting that auto-regulation could be another source of discrepancy between total read and allelic read changes. The high rate of validation of the observed changes by pyrosequencing of biological triplicates substantiated that silencing spread to endogenous genes. Intriguingly, on chromosome 8 there appeared to be domains of silencing separated by areas that were more resistant to the action of XIST. In order to explore what features might lead to differential susceptibility to silencing we performed chromatin immu-noprecipitation followed by sequencing (ChIP-seq) for in-duced and uninin-duced cells withXISTintegrated at 8p.
Chromatin features of regions silenced by XIST in somatic cells
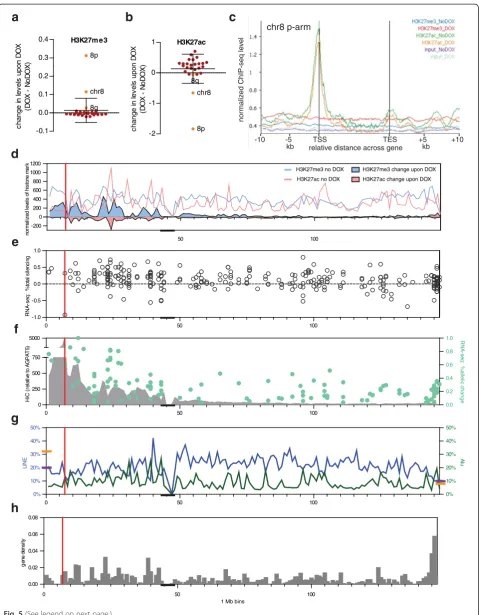
ChIP-seq for both the archetypical facultative heterochro-matic mark H3K27me3 and the active mark H3K27ac showed significant, but opposing changes on chromosome 8 upon DOX induction of XIST from the 8p integration site, and these changes were even more dramatic on the short arm where XIST is integrated (Fig. 5a, b). Surprisingly, DOX treatment significantly increased H3K27ac across the genome, with most chromosomes showing an increase, suggesting a widespread impact of the antibiotic (Fig. 5b). This unexpected change in chromatin accessibility did not extend to any significant
chr1chr8 chr12 chr1 chr8 chr12
rep1 rep2
chr1 chr8 chr12
Fig. 4Silencing of endogenous genes upon ectopic XIST expression.
[image:7.595.306.539.91.195.2]H3K27m e3 -0.1 0.0 0.1 0.2 0.3 0.4 chr8 8p 8q c h ange i n le v e ls upon D O X (D O X - N o D O X )
0 50 100
0.00 0.02 0.04 0.06 0.08 g e ne dens it y
0 50 100
0% 10% 20% 30% 40% 50% 0% 10% 20% 30% 40% 50% LI N
E Alu
a
d
e
f
g
h
1 Mb bins
c
nor
maliz
ed ChIP-seq le
v
el
-10 -5 +5 +10
kb relative distance across gene kb
TSS TES
chr8 p-arm
0 50 100
-1.0 -0.5 0.0 0.5 1.0 R N A -s eq : % tot al s il enc ing
0 50 100
0 250 500 750 5000 0.0 0.2 0.4 0.6 0.8 1.0 H iC ( rel at iv e t o A G P A T 5 ) RNA -s e q : % a llelic change
b
H3K27ac -2 -1 0 1 chr8 8p 8q c h ange i n le v e ls upon D O X (D O X - N o D O X ) 50 100 -200 0 200 400 600 800 1000 1200 nor m al iz ed l e ve ls of hi s tone m a rkH3K27me3 change upon DOX
H3K27ac change upon DOX H3K27me3 no DOX
H3K27ac no DOX
[image:8.595.59.539.86.702.2]change in H3K27me3 across the genome, and the antici-pated enrichments in the imprinted regions of KCNQ1 and IGF2R were observed before and after DOX (Add-itional file 4). When examined across all genes on chromosome 8p, the loss of acetylation was most notable at the promoter, the site of most pre-existing acetylation, but loss was seen throughout the upstream and gene bod-ies (Fig. 5c). The genes from 8q showed changes similar to that of other autosomes, with an increase only detected at the promoter (Additional file 5). The gain of H3K27me3 on chromosome 8p was observed across both genic and intergenic regions (Fig. 5c), with no change observed for genes on 8q or autosomes (Additional file 5). In order to correlate the change in H3K27me3 and H3K27ac with the silencing observed, as well as other features of the chromosome, we plotted the initial levels (without DOX) as well as the total change in both marks along the chromosome (Fig. 5d). While the loss of H3K27ac could be anticipated to occur from locations where there was acetylation initially, the recruitment of H3K27me3 upon XIST induction also mirrored the pexisting levels re-markably well (Spearmanr= 0.8671;P<0.0001 for 8p). In Fig. 5e we show the average silencing determined from total reads, while in Fig. 5f we show allelic gene silencing. We assessed allelic changes in H3K27ac as well, and the limited informative genes showed a significant correlation between allelic silencing and loss of acetylation (correlation for 29 genes with data for both, r= 0.5904; P= 0.0007). Mouse Xist localizes to sequences that are in contact with the integration site as determined by chromatin conform-ation capture [43, 44], and therefore we extracted the Hi-C contacts anchored at the 1 Mb domain containing the 8p integration site from the published Hi-C data [45] (Fig. 5f). There are more contacts, as well as stronger silencing, closer to the integration site, confounding the ability to examine correlations. Interestingly, the Hi-C contacts cor-related with the pre-existing (No DOX) H3K27me3 levels along the chromosome 8 short arm (Spearmanr= 0.4996; P= 0.0006), although we did not identify an association of allelic silencing with domains designated as closed nor
open [46] (Fisher’s exact test). Allelic silencing corre-lated with both the gain of H3K27me3 (Spearman r= 0.4599; P= 0.0003) and loss of acetylation (Spearmanr=
−0.4557, P= 0.0004). Given the proposed role for repeti-tive elements in the XCI process [47–49], and the ten-dency for mouse Xist to first localize to gene-rich regions during early expression in embryonic stem cells [43, 44] we show the LINE and ALU distribution (Fig. 5f) and the gene density (Fig. 5g) along chromosome 8; however, nei-ther feature showed a significant correlation with silen-cing, although as would be expected, gene density is a major contributor to total levels of H3K27 acetylation. To further explore the relationship of the ability to modify chromatin and the silencing ability of the different chromosomal integration sites we performed immuno-fluorescence in conjunction with FISH for XIST.
Recruitment of heterochromatic modifications to the site of XIST localization
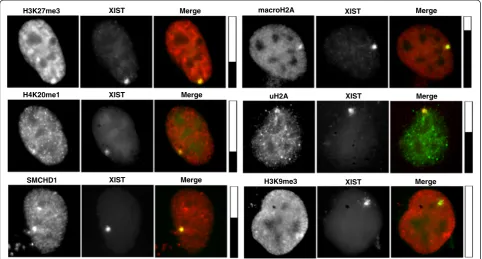
In addition to H3K27me3, the Xi is known to be enriched for additional histone marks and proteins associated with repressed chromatin; however, the hierarchy of recruit-ment of these heterochromatic features by XIST has not been clarified. Therefore, we examined the co-localization of these features with XIST expressed from various inte-gration sites (Table 2). The extent of co-localization can vary with the cell cycle, and therefore we categorize the co-localization as positive (consistently observed in greater than 25 % of XIST-positive cells), negative (consistently observed in less than 10 % of cells) or +/−(in between 10 % and 25 % co-localization, or variable between repli-cates). No recruitment of H3K9me3 was observed at the four sites examined, while H2AK119u1 was observed at all four examined integration sites. The integration onto Xq showed recruitment of all marks (with the ex-ception of H3K9me3) and is shown in Fig. 6. Recruit-ment was still less than was seen for a female cell line–in IMR90 we routinely detect over 80 % co-localization. H3K27me3 was not recruited to the 1p or 3q integration sites, while SMCHD1 was not enriched at 1p, 3q, and also
(See figure on previous page.)
Fig. 5Correlation of genomic neighborhood and XIST-induced silencing on chromosome 8.aChIP-seq changes observed for H3K27me3 on each
4q integration site clones. The integration clone at 3q did however recruit macroH2A, which was not seen to be enriched at the 1p or 7q integration clones. Overall the in-tegration at 1p showed the least enrichment of marks with only variable recruitment of H4K20me1 in addition to H2AK119u1. To further examine dependence on integra-tion site, independent clones integrated into 7q, Xq, and 8p were compared by IF-FISH for H3K27me3 and/or H4K20me1. Of the six side-by-side comparisons of inde-pendent clones at the same integration site, enrichment of
marks were very comparable showing an average of 6 % difference in enrichment and all falling within the same category (except for 8p with H4K20me1 which spanned the +/−and +).
[image:10.595.56.541.100.240.2]The only mark examined that was not detected at any site was the H3K9me3 mark, which is often associated with constitutive heterochromatin. H2AK119u1 was seen at all of the four integrations examined, suggesting it is less dependent on local chromatin structure than the other marks which were heavily dependent upon
Table 2Co-localization of histone modifications with induced XIST RNA signal
Clone H3K27me3 H4K20me1 macroH2A SMCHD1 H2AK119u1 H3K9me3
1p − +/− −a − + −
3q − +a −a
4q +/− − +/− −a
7p +/− +/− + +/−a
7q +/−b −b −a +/−
8p +b +/−b +a +a + −
12q +/−b −a + +/− + −
15q +/− +/− +/− +/−
Xq + +b +a + + −
a
In situ hybridization performed at least in duplicate
b
In situ hybridization performed on two independent clones
Co-localization of the histone modification with the XIST signal was counted in at least 30 cells. No co-localization (−) was <10 % co-localization; +/−was between 10 % and 25 % co-localization and + is assigned to integration sites with over 25 % co-localization
H3K27me3 XIST Merge macroH2A XIST Merge
SMCHD1 XIST Merge
uH2A Merge
H3K9me3 XIST Merge
H4K20me1 XIST Merge XIST
Fig. 6Immunofluorescence shows features enriched at site of XIST RNA. The XIST RNA is identified by RNA FISH (green, except for H2AK119u1
[image:10.595.57.540.426.685.2]the integration site and surprisingly independent of each other. The X chromosome showed the best ability to recruit all features examined, with the next best inte-gration site also being the one that showed the greatest gene silencing (8p).
Discussion
We have examined the impact of genomic location of XIST on its ability to alter nuclear ultrastructure, chromatin state, and gene expression in a somatic cell line. We observe considerable heterogeneity in the ex-tent of silencing and the recruitment of chromatin marks, depending upon the integration site, providing us with an opportunity to dissect the interactions be-tween features in a system in which complete recruit-ment and silencing does not occur. The ability of XIST to localize to all integration sites supports that there is limited sequence specificity for the RNA with the chromosome, in agreement with the spread of in-activation reported in X/autosome translocations, and various mouse Xist transgenes (reviewed in [36, 50]). The lack of sequence specificity is also in line with the recently described proximity-transfer model which suggests that Xist first associates with sequences in physical proximity to the Xist locus and then transfers to gene-rich regions which are topologically associated with the integration site [43].
Spread of silencing to autosomes in these HT1080 cells is not seen to the extent that is observed for X/ autosome translocations [48, 49] or an autosomal XIST transgene in iPS cells [39], suggesting that bypassing differentiation reduces the ability to inactivate a chromo-some. While early mouse studies suggested the presence of a limited developmental window during which silen-cing could be induced [12] we see XIST-dependent silencing of endogenous genes in these HT1080 fibro-sarcoma cells up to almost 50 Mb from the integration site, although endogenous gene silencing is most prom-inent closer to the integration site. It is possible that the cancerous origin of these cells has reactivated crit-ical developmental gatekeepers, as specific mouse can-cers have been shown to allow Xist-induced silencing [17, 25]. The ability of XIST to induce gene silencing in somatic cells has important implications for cancer cells where rearrangements or reactivation of XIST may bring previously active genes under the influence of XIST.
We observe a Cot-1 hole and increased perinucleolar association at all integration sites, consistent with previ-ous reports that XIST/Xist expression from autosomes increases perinucleolar association [10, 21]. In our as-sessment of multiple XIST integrations, we observed heterogeneity in the extent of perinucleolar association, and the correlation with silencing was limited. The three
integration sites for which the increase in perinucleolar association was not significant (15q, 3q, and Xq) were all G-dark integration sites; however, the 7p integration was also in a G-dark band yet demonstrated a significant increase in perinucleolar localization, suggesting an in-complete association between perinucleolar association and G-dark integrations with lower XIST levels (Fig. 7).
The other feature that we observed at all integrations examined was H2AK119u1, which is established by the PRC1 complex. We observed H2AK119u1 in the ab-sence of SMCHD1, macroH2A, and H3K27me3 in the 1p integration cells, suggesting that XIST may be able to directly recruit the PRC1 complex, in agreement with the PRC2-independent PRC1 recruitment previously suggested in mice [27]. As the 1p integration site demon-strated limited silencing in the presence of H2AK119u1 recruitment, we conclude that H2AK119u1 is insufficient for the spread of gene silencing. No integration site exam-ined showed recruitment of H3K9me3, although the anti-body clearly hybridized to the native Xi in female cells. Therefore it appears that facultative heterochromatic marks can be recruited by XIST in these cells, but the establishment of a ‘locked-in’ silent state required add-itional layers of developmentally-regulated chromatin con-densation. Without such locks on silencing, the continued silencing of both reporter genes and endogenous genes was XIST-dependent, undergoing reactivation upon re-moval of XIST induction.
The strong ability of the X integration to recruit all features confounded the ability to detect correlations; however, it appears that the majority of the features are in-dependently recruited to the chromosome that expresses XIST. For several of the integration sites two or more in-dependent clones with similar XIST levels behaved simi-larly supporting that the variation we observe is due to the integration site. In addition, the 4q and 12q clones were derived from a different subclone of HT1080 from the other autosomal integration sites; however, they did not appear to be more similar to each other, arguing against the variation arising during subclone generation.
The differential recruitment of chromatin marks depending on integration site suggests that multiple si-lencing pathways not only work in parallel to promote silencing, but that their recruitment is favored by different underlying DNA sequences, consistent with previous studies using genes that escape from inactivation to iden-tify 12 features of the DNA sequence of the X chromo-some that may be involved in the spread or maintenance of XCI [52].
Conclusions
Overall, we saw variability in the recruitment of chroma-tin marks between the integration sites, highlighchroma-ting the
importance of the integration site in modulating XIST function. Localization of XIST with a concomitant deple-tion of Cot-1 RNA, recruitment of H2AK119u1, and a shift to perinucleolar location was seen at all integrations, and thus reflect features established by XIST independent of the local chromatin environment. In contrast, recruitment of SMCHD1, macroH2A, H3K27me3, and H4K20me1 appeared to be strongly influenced by the site of XIST expression. As some silencing was observed at all integrations, this study demonstrates that silencing in human somatic cells can occur in the absence of macroH2A, SMCHD1, and H3K27me3/H4K20me1 re-cruitment, underscoring the independent but coopera-tive nature of the X-chromosome inactivation process. The X chromosome demonstrated the most consistent ability to recruit the heterochromatic marks of XCI, consistent with an evolutionary accumulation of DNA features enabling the recruitment of heterochromatic marks to the X chromosome.
Methods
Generation and culture of cell lines and identification of the transgene integration site
HT1080 HH1 cells were transfected with pcDNA6/TR, and two subclones (HT1080HH1-2-3 or 2–12) expressing
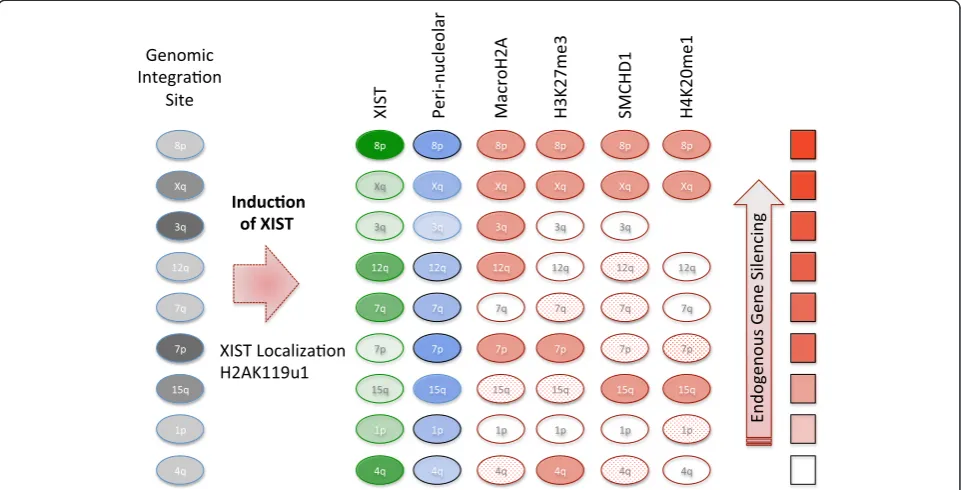
Fig. 7Schematic of features examined at the site of XIST RNA induction. Nine different integration sites of XIST were examined, and these were
in both G-light (pale gray) and G-dark genomic locations. Upon DOX induction XIST was expressed (intensity of green oval reflects average amount of XIST expression) and increased perinucleolar localization was observed (blue oval intensity reflects increase, with significant changes encircled in black). H2AK119u1 was enriched at all four integration sites examined. The enrichment of chromatin marks or proteins that were variably recruited (see Table 2) is shown as solid (enrichment >25 %), dotted (enrichment between 10 % and 25 %) or unfilled (enrichment
[image:12.595.58.539.90.335.2]high RNA levels of the Tet-repressor were subsequently transfected with pFRT/lacZeo (Life Technologies) at low concentrations. The full-length inducibleXISTcDNA con-struct [20] was co-transfected with the pOG44 plasmid expressing Flp recombinase for site-specific recombin-ation into the FRT site followed by Hygromycin selection and confirmation of loss of Zeomycin resistance. Cells were grown at 37 °C with 5 % CO2 in DMEM supple-mented with penicillin/streptomycin, non-essential amino acids, and 10 % V/V fetal bovine serum. XIST expression was induced with the addition of 1μg/mL doxycycline to the culture medium.
Southern blotting identified eight FRT integrations that appeared single copy. Inverse PCR utilizing primers complementary to a sequence within the integrated pFRT plasmid was used to identify the precise integra-tion site of the transgenes in the HT1080 cell lines. The ends of linearized plasmids are subject to exonuclease activity, thus the actual integrated transgene often lacks several hundred of base pairs on each end which was first identified by a series of PCR assays prior to restric-tion endonuclease digesrestric-tion with a frequently-cutting restriction endonucleases identified to cut in the remaining plasmid, followed by ligation with T4 DNA ligase (Invitrogen) to create circular DNA molecules. The captured genomic DNA was amplified by nested PCR with primers facing outward from the plasmid fragment for sequencing and the genomic location was identified using the BLAT algorithm [53]. No X-linked integration was identified, so the F55 HT1080 clone from Yan and Boyd was used [41].
While cancer derived, the HT1080 cells remain dip-loid with four structural rearrangements detected by spectral karyotyping (46,XY,del (1)(p21), i(3)(p10), i(3)(q10), der(4)t(1;4)(p21;p16), der(5)t(5;5)(p15;?), der(11)t(3;11)(q11;q25). Using our allelic pyrosequenc-ing assays we observed instability of chromosome 3 in two of nine clones (see also [40]) and homozygosity for assays on 4q in one clone, while assays on chromosomes 1, 7, 8, and 15 remained diploid in the clones tested, suggesting that the unbalanced rearranged chromosomes were the least stable in these cells. We analyzed two independent clones at the Xq, 7q, and 8p integration site and five inde-pendent clones of the 8p integration site. These clones were individual single-cell clones following Flp-mediated recombination into the FRT site. Each clone was selected for Hyg-resistance and assessed for loss of Zeomycin sensitivity.
As fluorescent reporters allow for efficient screening, we created a plasmid that carries both the inducible re-peat A and a DsRed-Express2, driven by the mousePgk1 promoter (Fig. 2b). To test whether the ability of repeat A to silence the reporter depends on the genomic inte-gration site, we inserted the repeat A–DsRed-Express2
transgene into six of the HT1080 cell lines with a known chromosomal location of the FRT integration site for as-sessment of silencing by flow cytometry as previously performed [40].
RNA FISH and immunofluorescence
Cells were grown on glass coverslips. Upon removal from cell culture the coverslips were first rinsed in ice-cold CSK buffer (0.3 M sucrose, 100 μM NaCl, 10 μM PIPES, 3 μM MgCl2), then permeabilized with 0.5 % Triton-X 100 in CSK for 8 min on ice and then fixed in 4 % paraformaldehyde for 8 min at room temperature. Coverslips were stored at 4 °C in 70 % ethanol. Just prior to RNA FISH, the coverslips were immersed in 100 % ethanol for 5 min and left to air dry. FISH was per-formed with two probes: an XIST probe and a Cot-1 (Invitrogen) probe. Both probes had been directly fluo-rescently labeled using the Nick Translation Reagent Kit (Abbott Molecular, Inc.) with Spectrum red-UTP (Vysis) for Cot-1 DNA probes and Spectrum green-UTP (Vysis) for XIST probes. Approximately 150 ng of each probe was mixed together along with 20 μg salmon testes DNA then air dried in a speed vacuum, resuspended in 10 μL deionized formamide, denatured at 80 °C for 10 min, and then mixed with 10μL hybridization buffer (20 mg/mL BSA, 4XSSC, 20 %). This was pipetted onto a small square of Parafilm and the coverslip was placed on top of the probe mixture. Another piece of Parafilm was then placed on top and the edges were sealed to prevent the drying out of the coverslip. Hybridization took place overnight in a humidified chamber at 37 °C. The next day the coverslips were rinsed as follows: 20 min in 50 % formamide/50 % 4XSSC at 37 °C, 20 min in 2X SSC at 37 °C, and 20 min in 1X SSC at room temperature. Coverslips were then stained with DAPI and mounted onto microscope slides with Vecta-shield (Vector Laboratories). Cells were observed on a Leica inverted microscope (DMI 6000B) at 100X mag-nification and images were obtained using a Retiga 4000R (Q-Imaging) camera with Openlab software (Perki-nElmer). Images were processed using Adobe Photoshop CS4 to reduce background and correct for variation in FISH efficiency between different images. A one-way ANOVA test in GraphPad was used to determine signifi-cantly different signal sizes. Line scans were generated using Image J software (NIH) by drawing a line through the area of interest and plotting the RGB intensities across the line.
periphery and a Cot-1 negative nucleolus), or ‘neither’. XIST signals scored as ‘both’ are included in the ‘ peri-nuclear’/‘perinucleolar’ percentages in Table 1. For the
‘5d DOX’counts, results for each integration site are the average of three independent experiments performed on different coverslips, by at least two independent ob-servers, with a minimum of 50 cells counted each time. The ‘No DOX’counts were done once with a minimum of 60 cells counted per integration site.
For combined RNA FISH and immunofluorescence, coverslips, which had been stored at 4 °C in 70 % etha-nol, were first rinsed in PBS then placed onto a small amount of PBT (PBS with 1 % BSA and 0.1 % Tween 20) containing 0.4 U/μL Ribolock RNase inhibitor. Cov-erslips were sealed between two layers of Parafilm and left in the blocking buffer at room temperature for 20 min, then transferred from blocking buffer to PBT containing 1:100 primary antibody and 0.4 U/μL Ribolock, sealed between two layers of Parafilm and left at room temperature for 4–6 h. Coverslips were then washed three times, for 5 min each time, at room temperature in PBS containing 0.1 % Tween 20, then put onto a small amount of PBT containing 1:250 fluo-rescently labeled secondary antibody and 0.4 U/μL Ribolock, sealed between two layers of Parafilm and left at room temperature in the dark for 45 min. Coverslips were then washed three times, for 5 min each time, at room temperature in the dark in PBS containing 0.1 % Tween 20. Coverslips were then fixed in 4 % PFA in PBS for 10 min at room temperature in the dark, and washed for 5 min in PBS before continuing on to RNA FISH, making sure that the coverslips remained in the dark throughout the RNA FISH procedure. Antibodies used in immunofluorescence include: anti-H3K27me3 (07–449 from Millipore); anti-macroH2A (07–219 from Millipore); anti-SMCHD1 (ab31865 from Abcam); anti-H2AK119u1 (05–678 from Millipore); anti-H3K9me3 (07–442 from Millipore); anti-H4K20me1 (07–440 from Millipore).
RNA isolation, reverse transcription Q-PCR and allelic discrimination by pyrosequencing
RNA was isolated from cell pellets stored at−70 °C using TRIZOL (Invitrogen) according to the manufacturer’s in-structions and then treated with DNase1. cDNA was gen-erated in the range of 0.5–2.5 μg RNA using M-MLV reverse transcriptase for qPCR on a StepOnePlusTM Real-Time PCR System (Applied Biosystems, Darmstadt, Germany), using Maxima Hot Start Taq (Thermo Sci-entific) and EvaGreen dye (Biotium). The following conditions were used: 95° for 5 min, followed by 40 -cycles of (95° for 15 s, 60° for 30 s, 72° for 1 min), and a melt curve stage of (95° for 15 s, 60° for 1 min, in-crease of 0.3° until 95°). The expression levels of genes
of interest were normalized to the expression ofACTBor PGK1. Primer sequences are found in Additional file 6.
Pyrosequencing of cDNA before and after DOX induc-tion of DNA, and of clones containing integrainduc-tions on alter-nate chromosomes were examined. Each 25 μL PCR was performed with 1x PCR Buffer (Invitrogen), 0.2 mM dNTPs, 0.625 UTaqDNA polymerase (Invitrogen), 0.5μM forward and reverse primers, and 50–100 ng of cDNA for (94C for 30 s, 58.3C for 30 s, 72C for 1 min) × 35 cycles, and 72 °C for 10 min for final extension. One of the for-ward and reverse primers was biotinylated for template iso-lation during pyrosequencing preparation. Universal M13 primer was also used for some assays (see Additional file 6), where the primer to be biotinylated instead contained the M13 sequence at the 5′end (5′CGC CAG GGT TTT CCC AGT CAC GAC3′). Nested PCR was run for the assays that utilized the universal primers: the first round of PCR was performed with the same cycling conditions but only for 15x cycles, with the M13-tagged primer (without the biotin) and its paired forward or reverse primer; the second round of PCR was run with 1μL of PCR product from the first round of PCR as the tem-plate, as well as the biotinylated M13 primer and the non-M13-tagged primer that was used in the first round, under the same cycling condition but for 20 cy-cles. Pyrosequencing was performed on the PyroMark MD machine (Qiagen). Template preparation for pyro-sequencing was done according to manufacturer’s proto-col. For each assay, 10–15μL of PCR products was used as template and CDT tips were used to dispense the dNTPs.
Sequencing analysis
Allelic information for both RNA-seq and ChIP-seq was obtained with a custom workflow in Galaxy [56–58]. Briefly, mapped reads were run through Samtools mpileup to obtain SNPs relative to the reference genome in the control and experimental (integration of interest) samples, and allelic ratio of reads was calculated at each variant. In addition, only the variants with a biallelic ratio of 0.3–0.7 in the No DOX (control) sample were further examined. In order to phase the variants, the allele with lower reads for each variant site in the DOX (experimental) sample was considered to be silenced inciswith theXIST trans-gene. Variant sites were next combined based on regions of interest, either gene location or genomic regions for RNA-seq and ChIP-seq, respectively. Variant sites that had an allelic ratio 0.15 greater or less than the overall gene allelic ratio for the sample were removed and a new overall gene ratio was calculated. For ChIP-seq, variants with reads >2-fold different from the average number of reads in the region of interest were also excluded. Percent allelic silencing for a given gene or re-gion of interest was defined as (control allelic ratio – experimental allelic ratio)/control allelic ratio. The calcu-lated ratio was the frequency of the allele with lower reads in the experimental sample for each gene or region of interest. We also required that there were at least 4 reads and 5 reads with allelic information per gene (RNA-seq) and region of interest (ChIP-seq), respectively, in both the control and experimental samples to be considered for analysis.
Hi-C analysis
We obtained normalized Hi-C data for human female fibroblast line IMR90 [45] and the Hi-C analysis was done as previous [43]. We calculated the 1 Mb Hi-C counts by summing the counts in all 40 kb bins within each 1 Mb bins across the chromosome, with the an-chor being the 1 Mb bin containing theXISTtransgene (AGPAT5for 8p clone).
Data availability
The sequence data described are available in GSE68109. Additional microscopy images are available in Figshare (http://dx.doi.org/10.6084/m9.figshare.1529822).
Additional files
Additional file 1:Genomic location of FRT integration sites in the
HT1080 cell lines.(DOCX 129 kb)
Additional file 2:Location of XIST RNA signal for each integration
site with and without DOX treatment.The numbers shown are based on three independent experiments for the DOX results and one experiment for the No DOX results, with≥50 cells counted for each integration site in each experiment. (PDF 57 kb)
Additional file 3:Candidate gene silencing assays for each
integration site.One assay for each integration site was included in
Fig. 2.aAllelic pyrosequencing of three cDNAs from No DOX and DOX were compared in duplicate pyrosequencing reactions. As a control cDNA from a different integration was also assessed.bFor the X-chromosome integration site q-RT-PCR was used to determine silencing as the cells are hemizygous.cQ-RT-PCR assays were also performed to validate some autosomal silencing and compare with pyrosequencing and RNA-seq. (PDF 933 kb)
Additional file 4:Imprinted regions showed broad enrichment of
H3K27me3 and punctate peaks of H3K27ac.Probes with values in the extreme 5 % of inputs were removed. (PDF 175 kb)
Additional file 5:Average H3K27ac and H3K27me3 for genes on 8q
and chromosome 1.The normalized ChIP-seq level are shown across an aggregate of genes and for the 10 kb upstream and downstream before (NoDOX) and after XIST expression (DOX). (PDF 246 kb)
Additional file 6:Table of primers.(XLSX 16 kb)
Competing interests
The authors declare that they have no competing interests.
Authors’contributions
ADK performed the RNA FISH and IF experiments and drafted the manuscript, CY performed the RNA and ChIP-seq analysis and allelic and q-RT-PCR experiments, DCYL performed the ChIP and RNA-seq experiments, TDMD performed additional RNA FISH experiments, JM created the DS-RED construct and performed flow cytometric analyses, SELB generated and cultured the cell lines, ABB established the allelic workflow, LL and CJB provided guidance and interpretation of results and all authors contributed to the final manuscript.
Acknowledgements
This work was supported by CIHR grants to CJB (MOP-13680) and LL (MOP-119357). The authors thank Jen Chow for developing the inducible XIST clones, and Jordan Henriksen, Irene Qi and Allison M. Cotton for assistance and advice on FISH.
Author details
1Department of Medical Genetics, Molecular Epigenetics Group, Life Sciences
Institute, University of British Columbia, Vancouver, Canada.2Ludwig Institute for Cancer Research, University of California at San Diego School of Medicine, La Jolla, CA, USA.3Division of Life Science, The Hong Kong University of Science and Technology, Clear Water Bay, Hong Kong, China.
Received: 17 April 2015 Accepted: 10 September 2015
References
1. Lyon MF. Gene action in the X-chromosome of the mouse (Mus musculus L.). Nature. 1961;190:372–3.
2. Brown CJ, Lafreniere RG, Powers VE, Sebastio G, Ballabio A, Pettigrew AL, et al. Localization of the X inactivation centre on the human X chromosome in Xq13. Nature. 1991;349:82–4.
3. Brown CJ, Ballabio A, Rupert JL, Lafreniere RG, Grompe M, Tonlorenzi R, et al. A gene from the region of the human X inactivation centre is expressed exclusively from the inactive X chromosome. Nature. 1991;349:38–44. 4. Brown CJ, Hendrich BD, Rupert JL, Lafreniere RG, Xing Y, Lawrence J, et al.
The human XIST gene: analysis of a 17 kb inactive X-specific RNA that contains conserved repeats and is highly localized within the nucleus. Cell. 1992;71:527–42.
5. Clemson CM, McNeil JA, Willard HF, Lawrence JB. XIST RNA paints the inactive X chromosome at interphase: evidence for a novel RNA involved in nuclear/chromosome structure. J Cell Biol. 1996;132:259–75.
6. Blewitt ME, Vickaryous NK, Hemley SJ, Ashe A, Bruxner TJ, Preis JI, et al. An N-ethyl-N-nitrosourea screen for genes involved in variegation in the mouse. Proc Natl Acad Sci U S A. 2005;102:7629–34.
8. Sado T, Brockdorff N. Advances in understanding chromosome silencing by the long non-coding RNA Xist. Phil Trans Royal Society London Series B. 2013;368:20110325.
9. Barr ML, Carr DH. Correlations between sex chromatin and sex chromosomes. Acta Cytol. 1962;6:34–45.
10. Hall LL, Byron M, Sakai K, Carrel L, Willard HF, Lawrence JB. An ectopic human XIST gene can induce chromosome inactivation in postdifferentiation human HT-1080 cells. Proc Natl Acad Sci U S A. 2002;99:8677–82.
11. Chow J, Heard E. X inactivation and the complexities of silencing a sex chromosome. Curr Op Cell biol. 2009;21:359–66.
12. Wutz A, Jaenisch R. A shift from reversible to irreversible X inactivation is triggered during ES cell differentiation. Mol Cell. 2000;5:695–705.
13. Rasmussen TP, Wutz A, Pehrson JR, Jaenisch R. Expression of Xist RNA is sufficient to initiate macrochromatin body formation. Chromosoma. 2001;110:411–20. 14. Csankovszki G, Panning B, Bates B, Pehrson JR, Jaenisch R. Conditional
deletion of Xist disrupts histone macroH2A localization but not maintenance of X inactivation. Nat Genet. 1999;22:323–4.
15. Rack KA, Chelly J, Gibbons RJ, Rider S, Benjamin D, Lafreniere RG, et al. Absence of the XIST gene from late-replicating isodicentric X chromosomes in leukemia. Hum Mol Genet. 1994;3:1053–9.
16. Brown CJ, Willard HF. The human X inactivation center is not required for maintenance of X inactivation. Nature. 1994;368:154–6.
17. Agrelo R, Souabni A, Novatchkova M, Haslinger C, Leeb M, Komnenovic V, et al. SATB1 defines the developmental context for gene silencing by Xist in lymphoma and embryonic cells. Dev Cell. 2009;16:507–16.
18. Nechanitzky R, Davila A, Savarese F, Fietze S, Grosschedl R. Satb1 and Satb2 are dispensable for X chromosome inactivation in mice. Dev Cell. 2012;23:866–71. 19. Jeon Y, Lee JT. YY1 tethers Xist RNA to the inactive X nucleation center.
Cell. 2011;146:119–33.
20. Chow JC, Hall LL, Baldry SE, Thorogood NP, Lawrence JB, Brown CJ. Inducible XIST-dependent X-chromosome inactivation in human somatic cells is reversible. Proc Natl Acad Sci U S A. 2007;104:10104–9.
21. Zhang LF, Huynh KD, Lee JT. Perinucleolar targeting of the inactive X during S phase: evidence for a role in the maintenance of silencing. Cell. 2007;129:693–706.
22. Csankovszki G, Nagy A, Jaenisch R. Synergism of Xist RNA, DNA methylation, and histone hypoacetylation in maintaining X chromosome inactivation. J Cell Biol. 2001;153:773–83.
23. Bhatnagar S, Zhu X, Ou J, Lin L, Chamberlain L, Zhu LJ, et al. Genetic and pharmacological reactivation of the mammalian inactive X chromosome. Proc Natl Acad Sci U S A. 2014;111:12591–8.
24. Minkovsky A, Sahakyan A, Rankin-Gee E, Bonora G, Patel S, Plath K. The Mbd1-Atf7ip-Setdb1 pathway contributes to the maintenance of X chromosome inactivation. Epigenetics Chromatin. 2014;7:12.
25. Yildirim E, Kirby JE, Brown DE, Mercier FE, Sadreyev RI, Scadden DT, et al. Xist RNA is a potent suppressor of hematologic cancer in mice. Cell. 2013;152:727–42. 26. Silva J, Mak W, Zvetkova I, Appanah R, Nesterova TB, Webster Z, et al.
Establishment of histone h3 methylation on the inactive X chromosome requires transient recruitment of Eed-Enx1 polycomb group complexes. Dev Cell. 2003;4:481–95.
27. Schoeftner S, Sengupta AK, Kubicek S, Mechtler K, Spahn L, Koseki H, et al. Recruitment of PRC1 function at the initiation of X inactivation independent of PRC2 and silencing. EMBO J. 2006;25:3110–22.
28. Kalantry S, Magnuson T. The Polycomb Group Protein EED Is Dispensable for the Initiation of Random X-Chromosome Inactivation. PLoS Genet. 2006;2, e66. 29. Leeb M, Wutz A. Ring1B is crucial for the regulation of developmental
control genes and PRC1 proteins but not X inactivation in embryonic cells. J Cell Biol. 2007;178:219–29.
30. Tanasijevic B, Rasmussen TP. X chromosome inactivation and differentiation occur readily in ES cells doubly-deficient for macroH2A1 and macroH2A2. PLoS One. 2011;6, e21512.
31. Blewitt ME, Gendrel AV, Pang Z, Sparrow DB, Whitelaw N, Craig JM, et al. SmcHD1, containing a structural-maintenance-of-chromosomes hinge domain, has a critical role in X inactivation. Nat Genet. 2008;40:663–9. 32. Mould AW, Pang Z, Pakusch M, Tonks ID, Stark M, Carrie D, et al. Smchd1
regulates a subset of autosomal genes subject to monoallelic expression in addition to being critical for X inactivation. Epigenetics Chromatin. 2013;6:19. 33. Chaumeil J, Le Baccon P, Wutz A, Heard E. A novel role for Xist RNA in the
formation of a repressive nuclear compartment into which genes are recruited when silenced. Genes Dev. 2006;20:2223–37.
34. Thorogood NP, Brown CJ. Active chromatin marks are retained on X chromosomes lacking gene or repeat silencing despite XIST/Xist expression in somatic cell hybrids. PLoS One. 2010;5, e10787.
35. Clemson CM, Hall LL, Byron M, McNeil J, Lawrence JB. The X chromosome is organized into a gene-rich outer rim and an internal core containing silenced nongenic sequences. Proc Natl Acad Sci U S A. 2006;103:7688–93. 36. Yang C, Chapman AG, Kelsey AD, Minks J, Cotton AM, Brown CJ. X-chromosome
inactivation: molecular mechanisms from the human perspective. Hum Genet. 2011;130:175–85.
37. Duthie SM, Nesterova TB, Formstone EJ, Keohane AM, Turner BM, Zakian SM, et al. Xist RNA exhibits a banded localization on the inactive X chromosome and is excluded from autosomal material in cis. Hum Mol Genet. 1999;8:195–204.
38. Lee JT, Strauss WM, Dausman JA, Jaenisch R. A 450 kb transgene displays properties of the mammalian X-inactivation center. Cell. 1996;86:83–94. 39. Jiang J, Jing Y, Cost GJ, Chiang JC, Kolpa HJ, Cotton AM, et al. Translating
dosage compensation to trisomy 21. Nature. 2013;500:296–300.
40. Minks J, Baldry SE, Yang C, Cotton AM, Brown CJ. XIST-induced silencing of flanking genes is achieved by additive action of repeat a monomers in human somatic cells. Epigenetics Chromatin. 2013;6:23.
41. Yan C, Boyd DD. Histone H3 acetylation and H3 K4 methylation define distinct chromatin regions permissive for transgene expression. Mol Cell Biol. 2006;26:6357–71.
42. Hall LL, Carone DM, Gomez AV, Kolpa HJ, Byron M, Mehta N, et al. Stable C0T-1 repeat RNA is abundant and is associated with euchromatic interphase chromosomes. Cell. 2014;156:907–19.
43. Engreitz JM, Pandya-Jones A, McDonel P, Shishkin A, Sirokman K, Surka C, et al. The Xist lncRNA exploits three-dimensional genome architecture to spread across the X chromosome. Science. 2013;341:1237973.
44. Simon MD, Pinter SF, Fang R, Sarma K, Rutenberg-Schoenberg M, Bowman SK, et al. High-resolution Xist binding maps reveal two-step spreading during X-chromosome inactivation. Nature. 2013;504:465–9.
45. Dixon JR, Selvaraj S, Yue F, Kim A, Li Y, Shen Y, et al. Topological domains in mammalian genomes identified by analysis of chromatin interactions. Nature. 2012;485:376–80.
46. Nora EP, Dekker J, Heard E. Segmental folding of chromosomes: a basis for structural and regulatory chromosomal neighborhoods? BioEssays. 2013;35:818–28. 47. Lyon MF. X-chromosome inactivation: a repeat hypothesis. Cytogenet Cell
Genet. 1998;80:133–7.
48. Cotton AM, Chen CY, Lam LL, Wasserman WW, Kobor MS, Brown CJ. Spread of X-chromosome inactivation into autosomal sequences: role for DNA elements, chromatin features and chromosomal domains. Hum Mol Genet. 2014;23:1211–23.
49. Bala Tannan N, Brahmachary M, Garg P, Borel C, Alnefaie R, Watson CT, et al. DNA methylation profiling in X;autosome translocations supports a role for L1 repeats in the spread of X chromosome inactivation. Hum Mol Genet. 2014;23:1224–36.
50. Gendrel AV, Heard E. Noncoding RNAs and epigenetic mechanisms during X-chromosome inactivation. Annu Rev Cell Dev Biol. 2014;30:561–80. 51. Gendrel AV, Apedaile A, Coker H, Termanis A, Zvetkova I, Godwin J, et al.
Smchd1-dependent and -independent pathways determine developmental dynamics of CpG island methylation on the inactive X chromosome. Dev Cell. 2012;23:265–79.
52. Wang Z, Willard HF, Mukherjee S, Furey TS. Evidence of influence of genomic DNA sequence on human X chromosome inactivation. PLoS Comput Biol. 2006;2, e113.
53. UCSC Genome Bioinformatics. Available at: http://genome.ucsc.edu/cgi-bin/hgBlat. 54. Xie W, Schultz Matthew D, Lister R, Hou Z, Rajagopal N, Ray P, et al.
Epigenomic analysis of multilineage differentiation of human embryonic stem cells. Cell. 2013;153:1134–48.
55. Hawkins RD, Hon GC, Lee LK, Ngo Q, Lister R, Pelizzola M, et al. Distinct epigenomic landscapes of pluripotent and lineage-committed human cells. Cell Stem Cell. 2010;6:479–91.
56. Goecks J, Nekrutenko A, Taylor J. The Galaxy Team. Galaxy: a comprehensive approach for supporting accessible, reproducible, and transparent computational research in the life sciences. Genome Biol. 2010;11:R86. 57. Blankenberg D, Von Kuster G, Coraor N, Ananda G, Lazarus R, Mangan M,
et al. Galaxy: a web-based genome analysis tool for experimentalists. Curr Protoc Mol Biol. 2010; Chapter 19:Unit 19.10.1-21.