Georgia State University Georgia State University
ScholarWorks @ Georgia State University
ScholarWorks @ Georgia State University
Public Health Theses School of Public Health
Spring 5-7-2011
The Relation between Perceived and Real Obesity in School
The Relation between Perceived and Real Obesity in School
Children from Georgia
Children from Georgia
Kartik Pillai
Follow this and additional works at: https://scholarworks.gsu.edu/iph_theses
Part of the Public Health Commons
Recommended Citation Recommended Citation
Pillai, Kartik, "The Relation between Perceived and Real Obesity in School Children from Georgia." Thesis, Georgia State University, 2011.
https://scholarworks.gsu.edu/iph_theses/166
The relation between perceived and real obesity in school children
from Georgia
By
Kartik Pillai B.Tech- Biotechnology Sathyabama University
A Thesis Submitted to the Graduate Faculty of Georgia State University in Partial Fulfillment
of the
Requirements for the Degree MASTER OF PUBLIC HEALTH
APPROVAL PAGE
The relation between perceived and real obesity in school children from Georgia
by
Kartik Pillai
Approved:
__________________________________________
Committee Chair
__________________________________________
Committee Member
__________________________________________
Acknowledgements
I would like to thank Dr.Okosun for guiding me through my thesis writing process
and challenging me to think beyond norms. I would also like to express my gratitude to
Dr.Rodney Lyn for serving on the committee on such a short notice. I would also like to
acknowledge the staff and faculty at Georgia State University: Miss Courtney Burton, Dr.
Frances McCarty, Dr. Richard Rothenberg, Professor John Steward, Dr. Sheryl Strasser,
Dr.Christine Stauber. I would also like to express appreciation for the support to my
parents, Doraiswamy and Shakuntala Pillai and finally to my friends without whom the
journey of MPH would not have been sweet enough. In conjunction with Georgia State
University, I am grateful to the Institute of Public Health for believing in me, and
AUTHOR’S STATEMENT
In presenting this thesis as a partial fulfillment of the requirements for an advanced degree from Georgia State University, I agree that the Library of the University shall make it available for inspection and circulation in accordance with its regulations governing materials of this type. I agree that permission to quote from, to copy from, or to publish this thesis may be granted by the author or, in her absence, by the professor under whose direction it was written, or in his absence, by the Associate Dean, College of Health and Human Sciences. Such quoting, copying, or publishing must be solely for scholarly purposes and will not involve any potential financial gain. It is understood that any copying from or publication of this dissertation which involves potential financial gain will not be allowed without written permission of the author.
Notice to Borrowers Page
All theses deposited in the Georgia State University Library must be used in accordance with the stipulations prescribed by the author in the preceding statement.
The author of this capstone is:
Student‟s Name: Kartik Pillai
Street Address: 517 Main Street, Apt#2322 City, State, and Zip Code: Atlanta, Ga-30324
The Chair of the committee for this thesis is: Professor‟s Name: Dr. Ike Okosun
Department: Institute of Public Health
College: Health and Human Sciences
Georgia State University P.O. Box 3995
Atlanta, Georgia 30302-3995
Users of this thesis who not regularly enrolled as students at Georgia State University are required to attest acceptance of the preceding stipulation by signing below. Libraries borrowing this thesis for the use of their patrons are required to see that each user records here the information requested.
NAME OF USER ADDRESS DATE TYPE OF USE
Kartik D. Pillai
517 Main Street, Apt #2322, GA 30324 Mobile: (678) 662-3468 E-mail: [email protected]
Summary of Qualifications: Public Health professional interested in integrating my
biological background with public health and putting it to use in healthcare consulting, strategy and operation, program planning, health economics, health outcome and research and market research. Relevant Coursework include:
Epidemiology Biostatistics
Advanced Analytics Geographic Information Systems
EDUCATION
Georgia State University, Institute of Public Health
Master in Public Health (Epidemiology) (Program GPA 3.53/4.0) April 2011
Sathyabama University, Chennai, India
Bachelor of Technology in Biotechnology (CGPA 3.75/4) April 2008
EXPERIENCE
American Cancer Society, Atlanta, Georgia February 2011-Present Assist with all phases of research including research design, vendor management,
questionnaire development, data analysis, report-writing and project management.
Division of Aging Services, DHS, Atlanta, Georgia May 2010-December 2010
Examined geospatial mapping patterns and analyzed guardianship for 13 Area Agency on Aging in Georgia.
Analyzed the elder abuse rate with respect to socio-economic status, education level and marital status.
Strategic allocation of the resources increased field efficiency by 10% and made the program cost effective by 13.5%.
Georgia State University, Atlanta, Georgia January 2009-December 2010
Evaluated asteaching assistant for undergraduate course in Principles of Biology Laboratory.
Reviewed the weekly topic with the help of models and power point presentations. Assist students with lab activities.
Graded exam papers and written assignments and provided constructive feedback to students.
International Rescue Committee, Atlanta, Georgia December 2009 –May 2010
Developed public relations with the other NGO‟s.
Created health communication tools for refugees resulting in fewer hospital visits and medical expenses.
Department of Health and Community Welfare, Gujrat, India June 2009-July 2009 Developed intervention strategy proposal and implementation for the AIDS awareness
program.
Intervention was successful in 5 districts out of 8.
Gujrat Cancer and Research Institute, Gujrat, India December 2007–April 2008
Designed and analyzed the project “Expression of p53 in Head and Neck Carcinoma” in Immunohistochemistry Division of Gujarat Cancer and Research Institute.
The result led to further epidemiologic study behind p53 expression and its role in cancer screening and prevention.
Intas Biotherapeutics, Gujrat, India May 2007 –July 2007
Designed and carried out experiments in maintenance of cell lines, fermentation techniques, scale up and scale down processes.
Batch production of erythropoietin protein was increased from 0.10gm/Liter to 0.25 gm/Liter.
Extracurricular Activities
Cultural secretary of Indian Student Association at Georgia State University.
Sports: Recognized Volleyball captain at college, state and national level.
An active participant in HelpAge India (NGO), which works for the betterment of the senior citizens.
ABSTRACT
TITLE OF THESIS: The relation between perceived and real obesity in school children
from Georgia.
THESIS CHAIR: Ike Okosun, MS, MPH, PhD, FRSPH
Background: Physical activity and childhood obesity have been studied extensively
across the globe, but only few studies have been done in children who are aware of their obesity, overweight status and among children who are taking measures to control their weight. The purpose of this study is to examine agreement between perceived weight and ideal weight differences across gender, grade level, race and levels of weight control.
METHODS: This study is based on the secondary analysis of the Youth Risk Behavior
Surveillance System (YRBSS) conducted in the state of Georgia in 2009 (n=1882). The 2009 YRBS for each state that participated used a two-stage cluster sample design to produce a fairly representative sample of public school students in the grades of 9-12. Agreement between the perceived weight and the ideal weight differences across gender, grade level and race was measured using Kappa statistic.
RESULTS: In general, agreement between perceived weight and the ideal weight were
better in females compared to males. A much higher degree of concordance between perceived weight and the ideal weight was observed in Whites compared to Blacks and Hispanics. The analysis by grade resulted in 12th grade participants showing a high concordance value between their ideal weight and their perceived weight than the lower grade levels.
CONCLUSION: The results are in particular very insightful to the public health
TABLE OF CONTENTS
1. INTRODUCTION...1
1a. Background…..………...1
1b. Purpose of study……….……….…………..3
1c. Definitions of elder abuse/mistreatment………..………….…….4
2. REVIEW OF THE LITERATURE...5
2a. Weight perception………….………5
2b. Childhood obesity……….7
2c. Effects of childhood obesity……….9
2d. Physical Activity………..10
2e. Social environment………...12
3. METHODS ……….………... 15
3a. Data source and study population………..…………...15
3b. Data Collection Procedures and Questionnaires………..16
3c. State and Local Youth Risk Behavior Surveys………....16
3d. Study Measures………....17
3e. Statistical Analysis……...………19
4. RESULTS...21
5. DISCUSSION AND CONCLUSION... ..34
5a. Discussion………...29
5b. Limitations of study………...32
5c. Recommendations ………...32
5d.Conclusions……….……..33
1
CHAPTER I
INTRODUCTION
1a. Background
The prevalence of obesity is increasing at an alarming rate across the developing
countries of the world regardless of age, sex, race or ethnicity. Obesity is a major risk
factor for many chronic conditions, including 4 of the 10 leading causes of death in the
US: heart disease, stroke, diabetes & several forms of cancer. According to one study it is
estimated that prevalence of obesity in US adults is (34%) twice than that observed in
children and this figuratively is about 73 million men and women (Flegal, Carroll,
Ogden, & Curtin, 2010). The global epidemic of obesity is impacting an increasing
number of children, adolescents and adults with a common feature being low levels of
physical activity (Andrew P. Hills, 2009). There are many studies done across the world
ascertaining the importance of physical activity for health and growth and development
of youngsters, but little is done to put the words into action. Physical activity
opportunities for children is reduced because of urbanization, social factors and
advancement of technology like television, laptop computers, video games, smart phones
(Andrew P. Hills, 2009; Yeung, Wearing, & Hills, 2008). There has not been done much
research on the multilevel intervention strategy involving family, school, and community
setting (Pate & O'Neill, 2009). Studies have demonstrated health benefits associated with
physical activity such as positive mental health (Scully, Kremer, Meade, Graham, &
2
disease, diabetes certain types of cancer and osteoporosis (Penedo & Dahn, 2005).
Numerous initiatives, national and international guidelines have stressed the important
role of physical activity in maintaining good health and preventing disease; unfortunately
these efforts have not translated into increased physical activity (Van Kleef, Shimizu, &
Wansink, 2011).
According to the Physical Activity report published in 2006 for the state of
Georgia only 59% of the high school students were vigorously active and it clearly did
not meet the target of 85% and similar was the case with middle school students (68%
vigorously active) and adults (42% vigorously active) (Falb M, 2006). The report adds
that whites (45%) were more active than blacks (38%) and Hispanic (28%) and none of
the racial group in Georgia met the Healthy people 2010 objective of 50% (Falb M,
2006). According to the 2003 Georgia Student Health Survey Report around 15% of the
high school students are at risk of becoming overweight and in this subset African
American students are at a higher risk as compared to white students. 11% students are
already overweight and this consists of more males than females. African American
3
Figure 1: Overweight percentage by race and grade level in Georgia, 2003.
1b. Purpose of study
Systematic review of literature have given enough evidence that physical activity
is important in the control of childhood obesity along with other factors like social
environment, genetic composition (Andrew P. Hills, 2009). Obesity clearly is a precursor
to many of the chronic conditions like hypertension, blood pressure, cardiovascular
disease, diabetes and also it plays as a trigger for psychosocial problems in adulthood.
Physical activity and childhood obesityare being studied extensively across the globe,
but there has not been done enough research to determine the obesity awareness status of
children The purpose of this study is to examine the relation between perceived and real
obesity status across levels of physical activity, nutritional status and race/ethnicity in
4
other variables such as gender, age, BMI, dietary patterns and physical activity level. The
data from the study was obtained from Youth Risk Behavior Survey
(YRBS) for Georgia from 2009 to examine the relations.
1c. Research question
Question 1- Is there an agreement between the perceived weight and right weight in the
adolescent population of Georgia by gender, race/ethnicity and grade?
Null Hypothesis- There is no agreement between the perceived weight and the right
weight.
Question 2- How does the agreement between perceived weight status and right weight
status differ by levels of physical activity across gender, race and grade?
Null Hypothesis- There is no difference in agreement when the engagement in physical
activity is observed and stratified across gender, race and grade.
Question 3- How is the agreement between perceived weight status and right weight
status different by levels of weight control behavior across gender, race and grade?
Null Hypothesis- There is no difference in agreement when the engagement in weight
control behavior is observed and stratified across gender, race and grade.
Question 4- How is the agreement between perceived weight status and right weight
status different by nutritional status across gender, race and grade?
Null Hypothesis- There is no difference in agreement when the engagement in nutritional
5
CHAPTER II
REVIEW OF THE LITERATURE
To get a deep understanding of the research question this section is dissected to
understand the prevalence of physical activity, obesity and the effects of obesity.
Furthermore, comprehensive review of effect of physical activity on childhood obesity,
self perception, childhood obesity and its effect in adulthood, parental influence and
genetic makeup are included.
2a. Weight perception
If individuals who are overweight, obese or underweight do not recognize their
original weight status it becomes clear that they are unaware of the health risk and do not
take any measure to lead a healthy life. Similar may be the case when healthy people
perceive themselves as obese or overweight and engage in physical activity or weight
control behavior which is not needed or unhealthy (Binkley, Fry, & Brown, 2009).
Perception of overweight is related to depressed mood, lower self esteem and somatic
complains in some ethnic and gender groups (Ge, Elder Jr, Regnerus, & Cox, 2001). It
has been found that the perception of weight status is very much different in the males
and the females and it also shows drastic variation across gender. Girls in most of the
cases perceive themselves to be overweight to report more body dissatisfaction and to be
concerned about their weight than boys (Pritchard, King, & Czajka-Narins, 1997). In one
of the studies (Desmond, Price, Hallinan, & Smith, 1989) it was seen that about 43% of
6
right weight black females identified themselves correctly. 100% of heavy white girls
identified themselves as heavy whereas only 40% of heavy black girls perceived
themselves as heavy. Another study concluded that females in the age group of 11-16
years tend to underestimate their weight status and usually identify a too low number
(Rierdan & Koff, 1997). But, when asked to be identified based on the weight status if
they were overweight or normal weight they were more likely to report as being
overweight even though if they would be about right weight(Rierdan & Koff, 1997;
Strauss, 1999). A study also showed that African American students tend to
underestimate their weight when compared to other race students and children who were
at risk for overweight or who were overweight underestimated their weight more than the
healthy students (Morrissey, Whetstone, Cummings, & Owen, 2006). Hispanic and white
boys tend to perceive their bodies to be larger than the girls and girls perceived
themselves to be larger than what they really were and additionally there is no difference
in body perception in the two ethnic groups (Gardner, Friedman, Stark, & Jackson, 1999).
Weight perception is a very important driving force in determination of
behavioral pattern of eating, weight management among adolescents (Brener, Eaton,
Lowry, & McManus, 2004). Perceived body weight and weight gain concern have a
direct influence on desire to change weight and in turn influence physical activity
(Plotnikoff, Bercovitz, Rhodes, Loucaides, & Karunamuni, 2007). Perceived health status
also drives the estimation of caloric intake and it has been shown that overweight
adolescents and adults tent to underestimate their caloric intake as compared to right
weight individuals (Roberts, 1995). For example as one of the literature mentioned
behavioral attitude of fast food consumption was significantly and positively associated
7
the perceived barrier varies by weight status (French, Story, Neumark-Sztainer,
Fulkerson, & Hannan, 2001). Negative perception also has detrimental effects on the
health of the adolescents. Negative weight perception is related to extreme weight control
behaviors like dieting, use of laxatives, diet pills and binge eating among over weight
adolescents (Boutelle, Neumark-Sztainer, Story, & Resnick, 2002).
There has also been conflicting results when it comes to validating self reported
height and weight. One study found that there was no difference in self reported and
measured height and weight between African Americans and whites(Strauss, 1999).
While another study found that white students were more likely to perceive themselves as
taller than the children of other ethnic group (Brener, McManus, Galuska, Lowry, &
Wechsler, 2003). One of the study showed that self reporting of their perception was
misleading in middle school students when relied only on self reported data. The study
further showed that on an average students underreported themselves by 1.5 kg and 1 out
of 6 children would be misclassified if relied solely on the self reported data (Morrissey,
et al., 2006).
2b. Childhood obesity
According to American Academy of Pediatrics, adolescents who are overweight
have an estimated 80% chance of being obese as adults and if overweight begins before
age the of 8 years adulthood is likely to see severe obesity (CDC, 2011b). Obesity kills
more Americans each year than AIDS, cancer and injuries combined (Connecticut
Department of Public Health, 2007). The growing prevalence of childhood obesity is
alarming, given the long term and short term effects associated with obesity. A study
done by Green and Patterson found that there has been an increase of 3.2% annually in
8
2001). Although the suggestion that Type I diabetes is related to childhood weight gain
was first reported in 1975 by Baum and his co-workers (Baum, Ounsted, & Smith, 1975).
There has been no systematic review of association between childhood obesity and Type
I diabetes but based on the literary evidence they both seem to be correlated and
controlling childhood obesity would have an added advantage of reduction in Type I
diabetes. (Verbeeten, Elks, Daneman, & Ong, 2011).. With the growing incidence in
childhood obesity there has also been a stable rise in Type II diabetes in children and
adolescents (Pinhas-Hamiel et al., 1996). And it is a well known fact that metabolic
syndrome is strongly associated with type II diabetes, arterial hypertension and breathing
difficulties leading to myocardial infarction. If not in all, in most of the cases the above
mentioned disorders cause an early or premature death. Another effect of prevalence of
these disorders is the increase in the consumption of the economic resources. The
problem can prove to be more grave if we factor in the loss of quality of life and the
dangers of psychosocial isolation (Lob-Corzilius, 2007). Obesity during childhood
appears to be a precursor to other chronic diseases like cardiovascular disease,
hypertension, dyslipidemias (Freedman, Dietz, Srinivasan, & Berenson, 1999). Although
in one study it was seen that there was no association between BMI of children measured
at 5 years of age and its relation to coronary disease in adult life, but the risk of having a
stroke in adulthood doubled in children who were obese (Lawlor & Leon, 2005).
Behavioral problems and low self esteem have been seen in girls in addition to
psychological problems (Stewart, 2011). There has been seen long term consequence of
social and economic effects in women achieving lower income (Reilly, 2005). Obesity
contributes to the burden of chronic disease; but it has also been noted that the
9
tend to be at the receiving end of early and systematic discrimination. The children in
school and in society tend to create a barrier with the obese children. According to one
study, 10-11 year old boys and girls prefer being friendly with children with wide variety
of handicap to obese children (Richardson, Goodman, Hastorf, & Dornbusch, 1961). As a
result of such discrimination overweight children prefer to stay friends with younger
children who would most likely not discriminate and would not be much judgmental
about their weight.
2c. Effects of Childhood Obesity
Obesity is defined as an excess of body adiposity (Koplan, 2007). In just over one
generation, US rates of obesity have approximately increased by three times among
preschoolers and adolescents, and increased four times among children aged 6 to 11
years(Koplan, 2007). One study estimated that almost 9% of all medical expenditure in
2008 was obesity related and amounted to $147 billion, compared to $78.5 billion 10
years before (Finkelstein, Trogdon, Cohen, & Dietz, 2009). Epidemiologic data from
German Children and Adolescent Health Survey resonated the same opinion (Rosario,
Kurth, Stolzenberg, Ellert, & Neuhauser, 2010). The nationalized data showed that about
2 million children and adolescents (about 15%) between the ages 3-17 years are
overweight and about 800,000 (about 6.5%) of these children and adolescents are obese.
It is also true that a significant proportion of the children continue to be overweight for
the rest of their life if not obese. Like adult obesity, childhood obesity and overweight is
also defined by Body Mass Index (BMI). Percentiles are the most common way of
measure of growth and size patterns in United States (CDC, 2011a). Although there
10
obesity between USA and rest of the world, for the study purpose we will take into
consideration the definition by CDC (Center for Disease Control and Prevention). If the
percentile range is between 85th and 95th percentile the child is considered as overweight;
if greater to or equal to 95th percentile as obese. Obesity is an outcome that has many
attributes to it apart from physical activity namely socioeconomic status, poverty,
education, sedentary life style and neighborhood safety (Hu, 2008).
2d. Physical Activity
Physical activity is any type of body movement which requires spending of
energy and includes aerobic and muscle strengthening activity (CDC, 2011b). But the
intensity and the recommendation for the amount of physical activity differs between
adults and children. CDC recommends that children and adolescents should do one hour
of physical activity each day (CDC, 2011b). One of the reasons for childhood obesity
being a global epidemic is due to substantial reduction in physical activity with
continuous increase in childhood obesity rates (Wang & Lobstein, 2006). As a result of
reduction in physical activity energy imbalance is created where energy intake is much
more than the energy expenditure (Andrew P. Hills, 2009). The author further explains
how dietary patterns have changed and now includes low-quality carbohydrates and fats
and energy dense foods. Nature of present day environment makes the lifestyle sedentary
and which in turn contributes to positive energy balance and childhood obesity (A. P.
Hills, King, & Armstrong, 2007). Previous research has shown that only 12%-42% of 13
year olds and about 8%-37% of 15 year olds achieved physical activity recommendation
(Biddle, Gorely, & Stensel, 2004). A research conducted by Malina found that
11
and development. Although lack of physical activity might still lead to growth and
maturation (Malina, 2004). It is also suggested that people in their youth are more likely
to display healthy patterns of physical maturation consistent with their genetic potential if
they indulge in physical activity (Andrew P. Hills, Okely, & Baur, 2010). The concept of
habitual physical activity is greatly declining in large proportion in young people and
there is an overall reduction in energy expenditure (Andrew P. Hills, 2009). The author
also explains that the concept of low levels of physical activity is becoming a “new
normal” in the younger generation. A strategy which decreases the sedentary behavior,
support participation in more lifestyle physical activity and challenges the minimum
activity level of youngsters and their parents is definitely needed to fight against
childhood obesity (Andrew P. Hills, 2009). Children spend most of their time away from
home and to be precise in the school. So an intervention would be most effective if it is
deliverable in the school setting which emphasis on physical education, activities during
school day and the involvement of families (Salmon, Booth, Phongsavan, Murphy, &
Timperio, 2007). Another logical reason for reduction in physical activity that comes to
mind from personal experience is the change in mode of transport to school. Not many
school children bike or walk to school given longer commute distance. Active transport
from to and from school is considered also considered a good enough opportunity to
increase physical activity levels in children and adolescents (Yeung, et al., 2008). Modern
technology and urbanization has contributed to a decrease in physical activity and a
significant reduction in energy expenditure (Lob-Corzilius, 2007). And seeing from the
perspective of children today television, x-box, laptop, mobile phones, notebook are his
best friends, which makes the child physically undemanding and increases sedentary
12
to eating healthier food options than their less physically active (Ottevaere et al., 2011).
And another study which was conducted in a small subsample of 11-15 year old
adolescents found that energy intake was higher in the group which participated more in
physical activities but the results were statistically not significant (Cavadini, Decarli,
Grin, Narring, & Michaud, 2000).
2e. Social environment
With consistent change in lifestyle given to globalization dietary patterns have
been changing continuously. Men and women have taken to eat outside at restaurants and
fast food joints reasoning as lack of time to cook at home (Kearney, Hulshof, & Gibney,
2001). There has been a substantial change among women, with a greater proportion
now working out of home compared to a decade ago (Kearney, et al., 2001). Another
study on observing the temporal eating patter among men and women concluded that
there was more of outside eating as they neared the weekends (O'Dwyer, McCarthy,
Burke, & Gibney, 2005). Conflicting with the busy schedule of the working parents the
adolescents are the ones to suffer. A study concluded that adolescents who had meals at
home were encouraged to bring food to school (Utter, Scragg, Schaaf, & Mhurchu,
2008), which again reduces the probability of outside eating which could have been a fast
food joint. Problems of obesity and hypertension are quickly descending on the children
due to increase in the consumption of soft drinks, fast food and food that are very high in
energy (calories) [as a result of eating outside](Hejazi & Mazloom, 2009). Poor diet can
also be a cause for increase in adiposity which in combination with sedentary lifestyle
[which is also a factor for obesity] makes it all the more aggravating (Ludwig & Pollack,
13
physical activity in children (Nicklas, Webber, Thompson, & Berenson, 1989) . A study
established the fact that youngsters are greatly involved in eating fast food and snacks
while on the go (Laska, Graham, Moe, & Van Riper, 2010). Adolescents are tomorrow‟s
adults and they should have a choice of eating healthy meals at home which will
influence their children in future and subsequently dictate the food pattern of the future
generations (Nicklas, et al., 1989). After school it is home where they spend most of their
time.
In the home environment, parents should be engaged in physical activities with
their children which acts as a motivating factor to them. Like a study says parents will
also need to be provided with education to strategies to better understand the
consequences of obesity, making healthy food and activity choices and behavioral change
strategies (Waters & Baur). Parents play a sensitive role in development of their
children‟s food habits, dietary intake and activity patterns (Perusse et al., 1988). Parents
in a way drive the feeding practices and the foods that they offer their children, shape
their childs eating behaviors (Johnson & Birch, 1994). The same study also governed the
fact that parents shape their children‟s eating behavior through direct modeling. Obesity
status of the parents also has influence on the health of the child. A study concluded that
obese mothers are likely to have obese children and the correlation has greater impact
when taking into account the respective socio-economic status of the family (Langnase,
Mast, & Muller, 2002). The same study further claimed that the lower the
socio-economic status of the family, along with one or two obese parents, the higher the rate of
obesity in children. Another risk factor for increasing obesity which has not been talked
about much concerns the migrant population, especially the children of the immigrants
14
found that children‟s obesity status was influenced by parents obesity status up to 10
years of age, but after that child‟s weight was the dominant influence from adolescence to
early adulthood (Whitaker, Wright, Pepe, Seidel, & Dietz, 1997). It has been proven that
adverse lifestyle changes do enter into the families and early recognition can help prevent
childhood obesity and also improve the risk of the other family members (Burke, 2006).
Interestingly one of the study showed that breastfeeding has protective benefit for
children, who consequently might be at reduced risk of developing childhood obesity
(Harder, Bergmann, Kallischnigg, & Plagemann, 2005). In another study it was found
that around 30% of the women do not breastfeed their child and only 40% of them
15
Chapter III
Methodology
3a. Data source and study population
This study is based on the secondary analysis of the data obtained from Youth
Risk Behavior Surveillance System (YRBSS) conducted in 2009 (CDC, 2009). The
YRBS, a component of the Youth Risk Behavior Surveillance System (YRBSS), is an
instrument developed by the Centers for Disease Control and Prevention (CDC) to
monitor the prevalence of youth health-risk behaviors; assess trends in these behaviors;
assess the impact of youth prevention interventions across multiple population levels; and
monitor progress toward achieving the Healthy People 2010 goals.
The YRBS monitors six categories of health risks among adolescents. They are 1)
behavior towards injury/violence 2) alcohol and drug use 3) tobacco use 4) sexual
behaviors leading to unplanned pregnancy and sexually transmitted diseases (STD‟s) 5)
unhealthy dietary patterns and 6) physical inactivity (Eaton et al., 2010). YRBS is a
national survey which is school based conducted by local education and health agencies.
The 2009 national survey included 42 states and about 20 local surveys conducted among
students in grades 9-12. The national Youth Risk Behavior Survey (YRBS) uses a three
stage sampling method to produce a nationally representative sample of 9th through 12th
grade students. All kinds of school-public, catholic, or private were taken into account.
After the data was collected weighting factor was applied to each student record and
adjusted to no-response and oversampling of one factor. Finally the sample was scaled up
so as to match the population projection for each survey year. A nationally representative
16
al., 2010). The school response rate was 81% having 158 schools participated out of 196
and the student response rate was 88% with n=16,410 out of total 18,573. Findings from
the surveys will assist professionals in research to improve public welfare.
3b. Data Collection Procedures and Questionnaires
Survey procedures for the national, state, and local YRBS were designed to
protect students' privacy by allowing for anonymous and voluntary participation. Before
survey administration, local parental permission procedures were followed. Students
completed the self-administered questionnaire during one class period and recorded their
responses directly on a computer-scannable booklet or answer sheet. CDC's Institutional
Review Board approved the protocol for the national YRBS. The 2009 standard
questionnaire contained 87 questions. States and cities could add or delete questions from
the standard questionnaire. For the national questionnaire, 11 questions were added to the
standard questionnaire. Skip patterns were not included in any YRBS questionnaire to
protect students' privacy by ensuring all students took about the same amount of time to
complete the questionnaire. For state and local surveys, only data from standard questions
are presented in this report. Information about the reliability of the standard questionnaire
has been published elsewhere (Eaton, et al., 2010).
3c. State and Local Youth Risk Behavior Surveys
The 2009 YRBS for each state that participated used a two-stage cluster sample
design to produce a fairly representative sample of public school students in the grades of
9-12. The Results are not available from every state because some states do not
participate in the YRBS (in 2009, Minnesota, Oregon, and Washington did not
17
response rate to receive weighted results(CDC, 2009). State and district data files and
documentation are owned and controlled by the jurisdictions that conducted the survey.
Many states and districts have given CDC permission to distribute their data files upon
request. Other states and districts manage the distribution of their data files themselves.
For this particular study the data files were requested from the YRBS coordinator for the
state of Georgia.
3d. Study Measures
The study measures that were considered in the study were obtained from the
demographic file. These included grade, race, sex, Body Mass Index (BMI) percentile,
weight control behavior, nutritional behavior, physical activity behavior, weight status.
a. Grade
Grade was reported in four categories 9th, 10th, 11th and 12th. The students in the
other grade were not included for the study.
b. Sex
Participants were characterized as males or females based on their responses.
c. Race
Race was categorized into the following group: African American/Black and
White and Hispanic/. The results of the other races showed wide variation and it
cannot be meaningfully interpreted.
d. BMI percentile
Percentiles are the most commonly used indicator to assess the size and growth
patterns of individual children in the United States. The percentile indicates the
relative position of the child's BMI number among children of the same sex and
18
was later categorized into underweight (<5th percentile), health weight (5th-85th
percentile), overweight (85th-95th percentile) and obese (>95th percentile).
e. Nutritional behavior
For assessing the nutritional behavior four questions were dichotomized into
“meeting the nutritional goal” and “not meeting the nutritional goal”. The
questions that were included for the calculation of the variable were 1) how many
times fruit juice 7 days? 2) How many times fruit 7 days 3) How many times
other vegetables 7 days and 4) How many glass of milk 7 days. If the candidate
did not indulge in any of the four behaviors for a minimum of three days in a
week the result was taken to be “Not meeting the nutritional goal”. This cut off is
based on the guideline by CDC (CDC, 2011c).
f. Weight control behavior
For assessing the weight control behavior three questions were dichotomized into
“engaged in weight control behavior” and “not engaged in weight control
behavior” . The questions were 1) Did you eat less to lose weight 30 days 2) Did
you fast to lose weight 30 days and 3) Did you take pill to lose weight 30 days. If
the candidate did any of the above the result was coded as “engaged in weight
control behavior”.
g. Physical activity behavior
For assessing the weight control behavior three questions were dichotomized into
“engaged in physical activity” and “not engaged in physical activity”. The
questions were 1) Days active 60 min plus past 7 days. 2) How many days went to
PE class in the past week? 3) On how many sports team 12 months. If the
19
they were a part of sports team in past 12 months the respondent was
characterized as “engaged in physical activity”.
h. Weight status
The categories were self reported and they were 1) underweight 2) about right
weight 3) overweight 5) obese.
3e.Statistical Analysis
a. Sensitivity
Sensitivity for this study was defined as the probability that the test says a person
is overweight when in fact they really were overweight.
b. Specificity
Specificity for this study was defined as the probability that the test says a person
is not overweight when in fact they were not overweight.
c. Predictive value of a positive test
For this study it was defined as the proportion of participants who perceived
themselves as overweight and who really were overweight.
d. Predictive value of a negative test
For this studyit was defined as the proportion of participants who perceived
themselves as overweight and who really were about right weight.
e. Overall agreement (Cohens kappa)
Cohen‟s Kappa is an index of interrater reliability that is used to measure the level
of agreement between two sets of dichotomous ratings or scores.
20
Poor agreement = Less than 0.20 Fair agreement = 0.20 to 0.40 Moderate agreement = 0.40 to 0.60 Good agreement = 0.60 to 0.80 Very good agreement = 0.80 to 1.00
The Statistical Package for Social Sciences (SPSS v.18) was used for the
analysis of the data. There were some individuals in the data set that did not
answer to the questions and were hence considered as missing. To have an
understanding of the study population frequency tables were produced to
determine the representation of all variables like grade, gender, BMI. Cross
tabulation were analyzed between perceived weight and right weight and the file
was stratified by gender and engagement in physical activity, which was
converted into a dichotomous variable where 0 was coded as no engagement in
physical activity and 1 as engagement in physical activity. The same was done
with nutritional status and weight control status. This whole process of analysis
was repeated by stratifying the file according to grade level and race. The cross
tabulation values available were then used to test for overall agreement by
analyzing for sensitivity, specificity, predicted positive value, predicted negative
value and overall agreement (kappa) using WinEpiscope 2.0. WinEpiscope is
software for quantitative veterinary epidemiology. It is suitable for both the
design and analysis of epidemiological studies, and as an aid to the teaching of
21
Chapter IV
Results
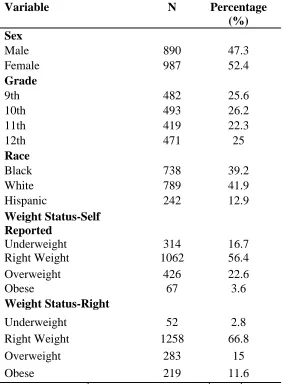
From the YRBS 2009 for the State of Georgia, 1882 respondents were gathered
using two stage cluster sampling. Participant demographics are as mentioned in the table
1 below. The population was almost fairly evenly distributed for male and female with
their respective percentages being 47.3% and 52.4%. The study population was equally
distributed with 25.6% coming from 9th grade, 26.2% from 10th grade, 22.3% coming
from 11th grade and 12th grade having a contribution of 25%. Whites made up almost
42% of the population followed closely by blacks at 39.2% and then followed after a big
gap by Hispanic population at 12.9%.About 56.4% of the participants who self-reported
their weight were as right weight and 22.6% participants perceived themselves to be
overweight. When their BMI percentile was calculated „Right weight‟ category still
remained highest with about 66.8% and „overweight‟ and „obese‟ category followed by
22
Table 1:Demographic Profile of Participants from YRBS Georgia 2009 Sample
(n=1882).
Variable N Percentage
(%) Sex
Male 890 47.3
Female 987 52.4
Grade
9th 482 25.6
10th 493 26.2
11th 419 22.3
12th 471 25
Race
Black 738 39.2
White 789 41.9
Hispanic 242 12.9
Weight Status-Self Reported
Underweight 314 16.7
Right Weight 1062 56.4
Overweight 426 22.6
Obese 67 3.6
Weight Status-Right
Underweight 52 2.8
Right Weight 1258 66.8
Overweight 283 15
Obese 219 11.6
23
Table 2: Overall agreement between perceived and right weight stratified across gender, race and grade.
Overall agreement
Gender Male 0.26 (0.17-0.34)
Female 0.34 (0.27-0.41)
Race Black 0.30 (0.21-0.38)
White 0.36 (0.28-0.44)
Hispanic 0.18 (0.03-0.33)
Grade 9th 0.24 (0.13-0.35)
10th 0.19 (0.08-0.31)
11th 0.26 (0.15-0.38)
12th 0.48 (0.38-0.59) *Kappa values with 95% CI
In Table 2 are shown the overall global agreement between perceived weight
status and the right weight status which is stratified across gender, race and grade.
Females are in better agreement than males in estimating their weight with kappa value of
0.34 as compared to that of 0.26. Whites have better agreement than blacks and
Hispanics. As the grade increases the agreement becomes stronger and 12th grade
participants have a moderate agreement as compared to the 9th, 10th and 11th grade
24
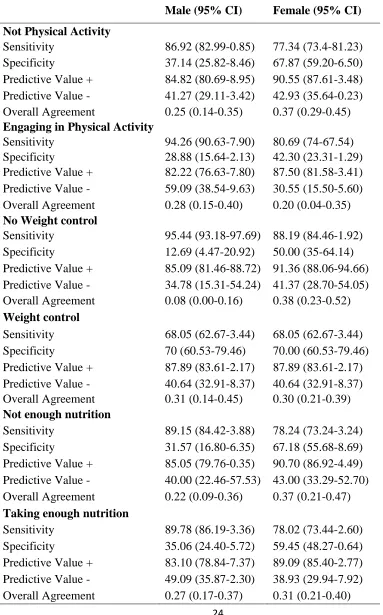
Table 3:Agreement between perceived weight and right weight by physical activity,
weight control and nutrition intake stratified by gender.
Male (95% CI) Female (95% CI)
Not Physical Activity
Sensitivity 86.92 (82.99-0.85) 77.34 (73.4-81.23) Specificity 37.14 (25.82-8.46) 67.87 (59.20-6.50) Predictive Value + 84.82 (80.69-8.95) 90.55 (87.61-3.48) Predictive Value - 41.27 (29.11-3.42) 42.93 (35.64-0.23) Overall Agreement 0.25 (0.14-0.35) 0.37 (0.29-0.45)
Engaging in Physical Activity
Sensitivity 94.26 (90.63-7.90) 80.69 (74-67.54) Specificity 28.88 (15.64-2.13) 42.30 (23.31-1.29) Predictive Value + 82.22 (76.63-7.80) 87.50 (81.58-3.41) Predictive Value - 59.09 (38.54-9.63) 30.55 (15.50-5.60) Overall Agreement 0.28 (0.15-0.40) 0.20 (0.04-0.35)
No Weight control
Sensitivity 95.44 (93.18-97.69) 88.19 (84.46-1.92) Specificity 12.69 (4.47-20.92) 50.00 (35-64.14) Predictive Value + 85.09 (81.46-88.72) 91.36 (88.06-94.66) Predictive Value - 34.78 (15.31-54.24) 41.37 (28.70-54.05) Overall Agreement 0.08 (0.00-0.16) 0.38 (0.23-0.52)
Weight control
Sensitivity 68.05 (62.67-3.44) 68.05 (62.67-3.44) Specificity 70 (60.53-79.46) 70.00 (60.53-79.46) Predictive Value + 87.89 (83.61-2.17) 87.89 (83.61-2.17) Predictive Value - 40.64 (32.91-8.37) 40.64 (32.91-8.37) Overall Agreement 0.31 (0.14-0.45) 0.30 (0.21-0.39)
Not enough nutrition
Sensitivity 89.15 (84.42-3.88) 78.24 (73.24-3.24) Specificity 31.57 (16.80-6.35) 67.18 (55.68-8.69) Predictive Value + 85.05 (79.76-0.35) 90.70 (86.92-4.49) Predictive Value - 40.00 (22.46-57.53) 43.00 (33.29-52.70) Overall Agreement 0.22 (0.09-0.36) 0.37 (0.21-0.47)
Taking enough nutrition
25
The aim of the table 3 is to measure and understand the concordance across
gender between perceived weight and right weight on physical activity, weight control
and nutrition status. For this stratification it is seen that females in general have a better
agreement as compared to that of males. For not engagement in physical activity there is
fair agreement for females (0.37) as compared to males (0.25). And the same was also
observed for not taking measures to control weight, where females (0.35) have fair
agreement and males (0.10) have poor agreement. Not having a nutritious diet also had
the similar agreement where females (0.37) are better than male (0.22). The females
(0.31) seemed to have a better agreement when it came to engagement in having a
nutritious diet when compared to males (0.27). Males (0.28) seemed to have a fair
agreement when it came to engaging in physical activity than females (0.20) who showed
poor overall agreement. Males (0.31) and females (0.30) showed almost same level of
agreement when it came to taking measured to control weight.
The results for concordance across race between perceived weight and right
weight by physical activity, weight control and nutrition intake is shown in table 4.
Whites and they seemed to have a better agreement with their perceived weight status and
the ideal weight status in all the subgroups. Whites (0.45) had moderate agreement;
blacks (0.35) and the Hispanics (0.28) had fair agreement when seen for not engaging in
physical activity. When analyzed for engagement in physical activity it was pretty much
same as before with whites (0.45) showing moderate agreement and blacks (0.02) and
Hispanics (0.10) showing poor agreement. Not engaging in weight control whites (0.28)
showed fair agreement and blacks (0.19) and Hispanics (0.12) showed poor agreement
26
whites (0.49) were in moderate agreement as compared to blacks (0.28) who showed fair
agreement and Hispanics (0.14) who showed poor agreement. For not taking enough
nutrition whites (0.47) once again had moderate agreement and blacks (0.37) and
Hispanics (0.24) showed fair agreement. Whites (0.45) showed moderate agreement and
blacks (0.16) and Hispanics (0.21) showed poor agreement.
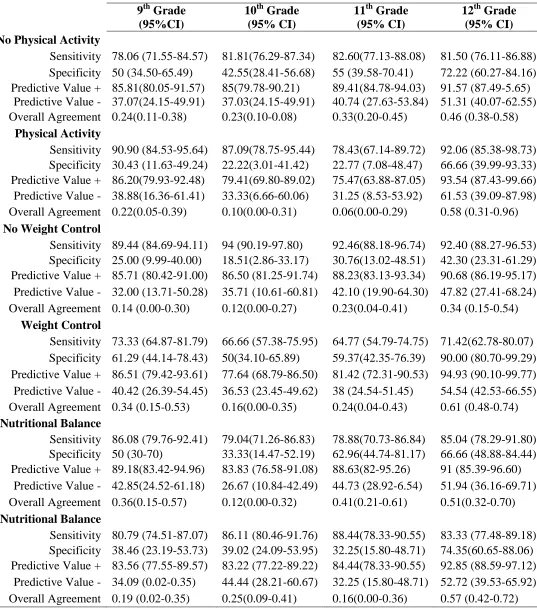
Concordance across grade level between perceived weight and right weight by
physical activity, weight control and nutrition status is shown in table 4. It was observed
12th grade participants showed a high concordance value between their right weight and
their perceived weight. Not engaging in physical activity there was increase in the overall
agreement with the increase in grade level. 9th grade (0.24), 10th grade (0.23), 11th grade
(0.33) showed fair agreement and 12th grade (0.46) showed moderate agreement. For
engagement in physical activity also 12th grade was showed the highest moderate
agreement with value of 0.58 and 11th grade showed very poor agreement with 0.06. For
weight control behavior 12th grade participants showed good agreement for controlling
weight (0.61) and fair agreement for not controlling weight (0.34). 9th grade (0.14) and
10th grade (0.12) showed poor agreement and 11th grade (0.23) showed fair agreement for
not controlling weight. For controlling weight 9th grade (0.34) and 11th grade (0.24)
showed fair agreement and 10th grade (0.16) showed poor agreement. Not enough
nutritional balance, 12th grade (0.51) showed moderate agreement and 9th grade (0.36)
and 11th grade (0.41) showed fair agreement as compared to 10th grade (0.12) which
showed poor agreement. For nutritional balance 9th grade (0.19) and 11th grade (0.16)
showed poor agreement and 10th grade (0.25) showed fair agreement between their
27
Table 4:Agreement between perceived weight and right weight by physical activity,
weight control and nutrition intake stratified by race.
Black (95% CI) White (95% CI) Hispanic (95% CI)
No Physical Activity
Sensitivity 89.25 (85.56-92.95) 77.98(73.49-82.43) 72.04(62.92-81.16) Specificity 46.42 (35.76-57.09) 67.16(55.91-78.40) 56.52(36.26-76.78) Predictive Value + 84.26 (80.04-88.48) 92.05 (88.87-95.24) 87.01(79.50-94.52) Predictive Value - 57.35 (45.59-69.10) 38.46 (29.64-47.27) 33.33 (18.53-48.12) Overall Agreement 0.35 (0.24-0.46) 0.45(0.33-0.57) 0.28(0.06-0.50)
Physical Activity
Sensitivity 92.24(87.37-97.11) 90.55 (85.36-95.63) 71.87 (56.29-87.45) Specificity 10(0-20.73) 54.54 (33.73-75.35) 38.46 (12.01-64.90) Predictive Value + 79.85(73.05-86.64) 92 (87.24-96.75) 74.19 (58.79-89.59) Predictive Value - 25(0.5-49.50) 50 (29.99-70) 35.71 (10.61-60.81) Overall Agreement 0.02(-0.09-0.14) 0.45 (0.23-0.66) 0.10 (0.00-0.41)
No Weight Control
Sensitivity 95.23 (92.71-97.76) 90.94 (87.33-94.55) 87.32 (79.58-95.06) Specificity 24.59 (13.78-35.39) 37.50 (20.72-54.27) 23 (0.50-49.50) Predictive Value + 84.96 (80.96-88.97) 91.70 (88.21-95.18) 87.32 (79.58-95.06)
Predictive Value - 53.57 (35.09-72.04) 35.29 (19.23-51.35) 25.00 (0.50-49.50) Overall Agreement 0.19 (0.08-0.30) 0.28 (0.11-0.45) 0.12 (0.00-0.38)
Weight Control
Sensitivity 77.87 (70.22-85.52) 70.61 (64.47-76.76) 51.85 (38.52-65.17) Specificity 50.94 (37.48-64.40) 78.94 (68.36-89.53) 62.50 (43.13-81.86) Predictive Value + 77.19(69.49-84.89) 92.54 (88.49-96.60) 75.67 (61.85-89.50) Predictive Value - 51.92 (38.34-65.50) 42.05 (32.70.51.41) 36.58 (21.84-51.32) Overall Agreement 0.28(0.13-0.44) 0.49 (0.37-0.61) 0.14 (0.00-0.37)
No Nutrition
Sensitivity 91.41 (87.10-95.71) 79.29 (73.64-84.93) 70 (57.29-82.70) Specificity 46.42 (33.66-59.49) 67.74 (51.28-84.19) 54.54 (25.12-83.97) Predictive Value + 83.24 (77.76-88.71) 94.01 (90.41-97.61) 87.50 (77.25-97.74) Predictive Value - 65 (50.21-79.78) 33.87 (22.09-45.65) 28.57 (9.25-47.89) Overall Agreement 0.37 (0.24-0.51) 0.47 (0.29-0.64) 0.24 (0.00-0.56)
Yes Nutrition
Sensitivity 89.23 (85.17-93.30) 83.20 (78.62-87.78) 73.33 (63.32-83.34) Specificity 27.58 (16.08-39.08) 62.06 (49.58-74.55) 48 (28.41-67.58) Predictive Value + 82.57 (77.78-87.36) 90.63 (86.91-94.36) 80.88 (71.53-90.22)
28
Table 5:Agreement between perceived weight and right weight by physical activity,
weight control and nutrition intake stratified by grade.
9
th
Grade (95%CI)
10th Grade (95% CI)
11th Grade (95% CI)
12th Grade (95% CI)
No Physical Activity
Sensitivity 78.06 (71.55-84.57) 81.81(76.29-87.34) 82.60(77.13-88.08) 81.50 (76.11-86.88) Specificity 50 (34.50-65.49) 42.55(28.41-56.68) 55 (39.58-70.41) 72.22 (60.27-84.16) Predictive Value + 85.81(80.05-91.57) 85(79.78-90.21) 89.41(84.78-94.03) 91.57 (87.49-5.65)
Predictive Value - 37.07(24.15-49.91) 37.03(24.15-49.91) 40.74 (27.63-53.84) 51.31 (40.07-62.55) Overall Agreement 0.24(0.11-0.38) 0.23(0.10-0.08) 0.33(0.20-0.45) 0.46 (0.38-0.58)
Physical Activity
Sensitivity 90.90 (84.53-95.64) 87.09(78.75-95.44) 78.43(67.14-89.72) 92.06 (85.38-98.73) Specificity 30.43 (11.63-49.24) 22.22(3.01-41.42) 22.77 (7.08-48.47) 66.66 (39.99-93.33) Predictive Value + 86.20(79.93-92.48) 79.41(69.80-89.02) 75.47(63.88-87.05) 93.54 (87.43-99.66) Predictive Value - 38.88(16.36-61.41) 33.33(6.66-60.06) 31.25 (8.53-53.92) 61.53 (39.09-87.98) Overall Agreement 0.22(0.05-0.39) 0.10(0.00-0.31) 0.06(0.00-0.29) 0.58 (0.31-0.96)
No Weight Control
Sensitivity 89.44 (84.69-94.11) 94 (90.19-97.80) 92.46(88.18-96.74) 92.40 (88.27-96.53) Specificity 25.00 (9.99-40.00) 18.51(2.86-33.17) 30.76(13.02-48.51) 42.30 (23.31-61.29) Predictive Value + 85.71 (80.42-91.00) 86.50 (81.25-91.74) 88.23(83.13-93.34) 90.68 (86.19-95.17) Predictive Value - 32.00 (13.71-50.28) 35.71 (10.61-60.81) 42.10 (19.90-64.30) 47.82 (27.41-68.24) Overall Agreement 0.14 (0.00-0.30) 0.12(0.00-0.27) 0.23(0.04-0.41) 0.34 (0.15-0.54)
Weight Control
Sensitivity 73.33 (64.87-81.79) 66.66 (57.38-75.95) 64.77 (54.79-74.75) 71.42(62.78-80.07) Specificity 61.29 (44.14-78.43) 50(34.10-65.89) 59.37(42.35-76.39) 90.00 (80.70-99.29) Predictive Value + 86.51 (79.42-93.61) 77.64 (68.79-86.50) 81.42 (72.31-90.53) 94.93 (90.10-99.77) Predictive Value - 40.42 (26.39-54.45) 36.53 (23.45-49.62) 38 (24.54-51.45) 54.54 (42.53-66.55) Overall Agreement 0.34 (0.15-0.53) 0.16(0.00-0.35) 0.24(0.04-0.43) 0.61 (0.48-0.74)
No Nutritional Balance
Sensitivity 86.08 (79.76-92.41) 79.04(71.26-86.83) 78.88(70.73-86.84) 85.04 (78.29-91.80) Specificity 50 (30-70) 33.33(14.47-52.19) 62.96(44.74-81.17) 66.66 (48.88-84.44) Predictive Value + 89.18(83.42-94.96) 83.83 (76.58-91.08) 88.63(82-95.26) 91 (85.39-96.60)
Predictive Value - 42.85(24.52-61.18) 26.67 (10.84-42.49) 44.73 (28.92-6.54) 51.94 (36.16-69.71) Overall Agreement 0.36(0.15-0.57) 0.12(0.00-0.32) 0.41(0.21-0.61) 0.51(0.32-0.70)
Nutritional Balance
Sensitivity 80.79 (74.51-87.07) 86.11 (80.46-91.76) 88.44(78.33-90.55) 83.33 (77.48-89.18) Specificity 38.46 (23.19-53.73) 39.02 (24.09-53.95) 32.25(15.80-48.71) 74.35(60.65-88.06) Predictive Value + 83.56 (77.55-89.57) 83.22 (77.22-89.22) 84.44(78.33-90.55) 92.85 (88.59-97.12)
29
Chapter V
DISCUSSION AND CONCLUSION
5a. Discussion
The purpose of this study was to examine the relation between perceived and real
obesity in school children from Georgia. This study found that there is fair agreement
among males and females and they did not show difference when estimating their weight
status. In particular females showed to have a fair agreement with kappa value of 0.37, in
estimating their perceived weight as overweight, which is consistent with other studies.
(Pritchard, et al., 1997). Fair agreement (kappa value between 0.20-0.40) between the
perceived weight status and real weight gives an understanding that the students are
unaware of their candidature for weight related disease and health problems such as
type-II diabetes, high blood pressure, high cholesterol and other cardiovascular heart disease.
A study found that overweight individuals who perceive their weight status as about the
right weight are more likely to get involved in risky behavior and are at risk of becoming
obese (Turner, Hamilton, Jacobs, Angood, & Dwyer, 1997). The risky behavior can be
not engaging in physical activity (males=0.2; females=0.37), not taking measures to
control weight (males=0.10; females=0.38) and not taking enough nutrition (male=0.22;
female=0.37). This suggests that apart from the fitness professionals, students should
also be educated in depth about the health implications for their specific weight category.
This study also shows that females with fair agreement between their perceived weight
and right weight are taking enough nutrition when compared to the males. This result is
30
poor dieting behavior (Esch & Zullig, 2008). In one of the studies it was mentioned that
females were at high risk of practicing unhealthy weight control behavior and report
decreased life satisfaction (Neumark-Sztainer, Paxton, Hannan, Haines, & Story, 2006).
Results from this study are consistent with previous study where blacks
are more content with their body size and as a result there is always less agreement
between their perceived weight and right weight (Thompson & et al., 1996), although the
study was based only on the female population. Black women in general are accepting to
their overweight status than white females (Bowen, Tomoyasu, & Cauce, 1991). Being
large and having extra amount of body weight is not viewed in a negative context by
black adolescents which makes them feel normal about their weight (Kemper, Sargent,
Drane, Valois, & Hussey, 1994). In this study it is seen that blacks and hispanics have
fair agreement with their perceived body size and right weight when compared to whites
who have moderate agreement. Whites are satisfied with smaller body sizes and prefer
the expected female body size to be smaller than the black counterparts (Kemper, et al.,
1994). Hispanic parents do not perceive their children to be overweight and are least
concerned about the health risks (Baughcum, Chamberlin, Deeks, Powers, & Whitaker,
2000). Although the study was based on the mothers of the preschool children, it can still
be logically applied to the children themselves as majority of them learn from their
parents about healthy behavior. Since, the parents themselves are not bothered about the
weight status and health risks associated with it, it seems very unlikely that the children
themselves would be well educated from their home environment. Additionally in
Hispanic population perception of health is determined more by the actual problem and
by the ability to function in day to day normal activities (Angel & Worobey, 1988). Thus,
31
essentially means living disease free and be able to perform everyday activities without
assistance. The results in the current study are in total compliance with the literature and
among the three racial ethnic groups into consideration Hispanics show the least
agreement with their perceived and right weight status and they seem to be not taking any
measures to control it by indulging in physical activity, better nutrition or weight control
behavior.
This study is different from others in examining the perception of weight across
the grades of students in 9th, 10th, 11th and 12th. With the increase in grade level there was
increase in the agreement between the perceived weight and right weight. On an average
there was moderate agreement in the 12th grade participants and there was fair agreement
to poor agreement in the other three grades. Some studies have shown that life
dissatisfaction and unhealthy weight perception and poor dieting behavior starts at young
age and continues through college years (Esch & Zullig, 2008; Zullig, Pun, & Huebner,
2007). This study is in agreement with the research as a pattern can be seen in the
agreement and it becomes stronger as the grades increase. This logically implies that as
the participants mature into adulthood their perception to weight status and healthy living
changes but it is shown to have a bad effect early on in their life.
Overall it can be said that the study population does not perceive their weight
status accurately. It is important that the children be educated to assess their body weight
32
5b. Limitation of the study
There are several limitations to the study which should be noted. First, this study
focuses on the high school student population in the state of Georgia alone and should not
be generalized to the national population and also to the non-high school students of
Georgia. Second, the sample size of 1882 is not considered very strong and which may
have limited the association between certain variables and overweight. Third,
self-reported weight and height information was used to calculate BMI and their BMI status.
Some agree on the high correlation between the self reported measurements and the
actual measurements (Spencer, Appleby, Davey, & Key, 2002), while some argue it to be
illogical to collect self-reported data from adolescents and especially the females as they
misperceive their weight to be low and height to be more (Farre Rovira, Frasquet Pons,
Martinez Martinez, & Roma Sanchez, 2002). The strength of this study includes the use
of reliable and nationally tested questionnaire.
5c. Recommendation
With an increase in childhood overweight status and current budget cuts in physical
education in school, children are at greater risk for developing poor body image. School
children are very permeable audience and an intervention at school level can be highly
successful. School setting is considered an excellent setting for overweight prevention
and giving insight about body weight (Adams et al., 2000). Student culture should be
understood and school nurses or health practitioner should provide intervention with
childhood overweight status. They can train other staff members to teach about nutrition
33
Media should be influenced to become more sensitive to how body shapes and
sizes are portrayed and admired.
5d. Conclusion
This study is important because it gives an understanding of how the school
children on the threshold of adulthood perceive about their weight status and what steps
they take to remain under control in Georgia. The results are in particular very insightful
to the public health professionals who are in the process of promoting healthy behaviors
since early stages of childhood in order to have a disciplined lifestyle in adulthood. The
study implies that the minority racial groups of Blacks and Hispanicsare much less
informed about their health and this may again be due to the cultural perception of being
overweight as a symbol of being healthy.
Future research of weight perception could be enhanced by using actual weight measures
of height and weight rather than self-reported data. Further exploration about the weight
belief and factors associated with weight misperception would likely support the planning
and development of intervention programs aimed at helping the children to achieve
34
References
Adams, K., Sargent, R. G., Thompson, S. H., Richter, D., Corwin, S. J., & Rogan, T. J. (2000). A study of body weight concerns and weight control practices of 4th and 7th grade adolescents. Ethn Health, 5(1), 79-94.
Angel, R. J., & Worobey, J. L. (1988). Acculturation and Maternal Reports of Children's Health: Evidence from the Hispanic Health and Nutrition Examination Survey. Social Science Quarterly, 69(3), 707-721.
Baughcum, A. E., Chamberlin, L. A., Deeks, C. M., Powers, S. W., & Whitaker, R. C. (2000). Maternal perceptions of overweight preschool children. Pediatrics, 106(6), 1380-1386.
Baum, J. D., Ounsted, M., & Smith, M. A. (1975). Letter: Weight gain in infancy and subsequent development of diabetes mellitus in childhood. Lancet, 2(7940), 866. Biddle, S. J., Gorely, T., & Stensel, D. J. (2004). Health-enhancing physical activity and
sedentary behaviour in children and adolescents. J Sports Sci, 22(8), 679-701. Binkley, S. E., Fry, M. D., & Brown, T. C. (2009). The Relationship of College Students'
Perceptions of Their BMI and Weight Status to Their Physical Self-Concept. American Journal of Health Education, 40(3), 139-145.
Boutelle, K., Neumark-Sztainer, D., Story, M., & Resnick, M. (2002). Weight control behaviors among obese, overweight, and nonoverweight adolescents. J Pediatr Psychol, 27(6), 531-540.
Bowen, D. J., Tomoyasu, N., & Cauce, A. M. (1991). The triple threat: a discussion of gender, class, and race differences in weight. Women Health, 17(4), 123-143. Brener, N. D., Eaton, D. K., Lowry, R., & McManus, T. (2004). The association between
weight perception and BMI among high school students. Obes Res, 12(11), 1866-1874.
Brener, N. D., McManus, T., Galuska, D. A., Lowry, R., & Wechsler, H. (2003). Reliability and validity of self-reported height and weight among high school students. J Adolesc Health, 32(4), 281-287.
Burke, V. (2006). OBESITY IN CHILDHOOD AND CARDIOVASCULAR RISK. [Article]. Clinical & Experimental Pharmacology & Physiology, 33(9), 831-837. Cavadini, C., Decarli, B., Grin, J., Narring, F., & Michaud, P. A. (2000). Food habits and
sport activity during adolescence: differences between athletic and non-athletic teenagers in Switzerland. Eur J Clin Nutr, 54 Suppl 1, S16-20.
CDC. (2009). YRBSS: Youth Risk Behavior Surveillance System. Retrieved 02/25/2011, from http://www.cdc.gov/HealthyYouth/yrbs/index.htm
CDC. (2010). Racial and ethnic differences in breastfeeding initiation and duration, by state - National Immunization Survey, United States, 2004-2008. MMWR Morb Mortal Wkly Rep, 59(11), 327-334.
CDC. (2011a). How is BMI calculated and interpreted for children and teens? About BMI for Children and Teens Retrieved 02/03, 2011
CDC. (2011b). How much physical activity do children need? Retrieved 02/03, 2011 CDC. (2011c). Nutrition. Retrieved 02/27/2011, from
http://www.cdc.gov/HealthyYouth/nutrition/