Copyright © 2003, American Society for Microbiology. All Rights Reserved.
Comparison between Prototype Hybrid Capture 3 and Hybrid Capture
2 Human Papillomavirus DNA Assays for Detection of High-Grade
Cervical Intraepithelial Neoplasia and Cancer
Philip E. Castle,
1* Attila T. Lorincz,
2David R. Scott,
3Mark E. Sherman,
1Andrew G. Glass,
3Brenda B. Rush,
3Sholom Wacholder,
1Robert D. Burk,
4M. Michele Manos,
5John E. Schussler,
6Paul Macomber,
2and Mark Schiffman
1Division of Cancer Epidemiology and Genetics, National Cancer Institute, NIH, Bethesda, Maryland
1; Digene, Gaithersburg,
Maryland
2; Kaiser Permanente, Portland, Oregon
3; Cancer Research Center, Albert Einstein College of Medicine,
Bronx, New York
4; Kaiser Permanente Division of Research, Oakland, California
5; and Information
Management Services, Silver Spring, Maryland
6Received 2 October 2002/Returned for modification 29 March 2003/Accepted 9 June 2003
We compared the performance of a prototype version of the Hybrid Capture 3 (HC3) human papillomavirus
(HPV) DNA assay to the current generation Hybrid Capture 2 (HC2) assay, both of which target 13 oncogenic
HPV types, for the detection of cervical intraepithelial neoplasia grade 3 and cancer (CIN3
ⴙ
) with
cervico-vaginal lavage specimens collected at enrollment into a 10-year cohort study at Kaiser Permanente (Portland,
Oreg.). HC3 results for a risk-stratified sample (
n
ⴝ
4,364) were compared to HC2 results for the entire cohort
(
n
ⴝ
20,810) with receiver operating characteristics curves, and the optimal cut points for both tests (relative
light units [RLU]/positive control [PC]) for the detection of CIN3
ⴙ
were determined. Specimens were also
tested for HPV16 and HPV18 with separate HC3 type-specific probes. The optimal cut point for detecting
CIN3
ⴙ
was 1.0 RLU/PC for HC2, as previously shown, and was 0.6 RLU/PC for HC3. At the optimal cut points,
HC3 and HC2 had similar screening performance characteristics for CIN3
ⴙ
diagnosed at the enrollment visit.
In analyses that included cases CIN3
ⴙ
at enrollment and those diagnosed during early follow-up, HC3 had
nonsignificantly higher sensitivity and equal specificity for the detection of CIN3
ⴙ
compared to HC2; this
increase in sensitivity was primarily the result of increased detection of CIN3
ⴙ
in women who were 30 years
of age or older and were cytologically negative (
P
ⴝ
0.006). We also compared the performance of the hybrid
capture tests to MY09/11 L1 consensus primer PCR results (
n
ⴝ
1,247). HC3 was less likely than HC2 to test
positive for specimens that tested positive by PCR for any untargeted types (
P
< 0.001). HC3 was less likely
than HC2 to test positive for untargeted PCR-detected single infections with HPV53 (
P
ⴝ
0.001) and HPV66
(
P
ⴝ
0.01). There was good agreement between test positivity by PCR and by single type-specific HC3 probes
for HPV16 (kappa
ⴝ
0.76; 95% confidence interval [CI]
ⴝ
0.71 to 0.82) and for HPV18 (kappa
ⴝ
0.73; 95% CI
ⴝ
0.68 to 0.79). In conclusion, we suggest that HC3 (
>
0.6 RLU/PC) may be slightly more sensitive than and
equally specific test as HC2 (
>
1.0 RLU/PC) for the detection of CIN3
ⴙ
over the duration of typical screening
intervals.
Hybrid Capture 3 (HC3) (Digene Corporation,
Gaithers-burg, Md.) is being evaluated as the next generation of hybrid
capture clinical assays that target 13 oncogenic HPV types for
the detection of cervical precancerous cervical intraepithelial
neoplasia grade 3 (CIN3) (11) and cancer (1, 9, 18). Hybrid
Capture 2 (HC2), the predecessor of HC3 and an assay
cur-rently in clinical use, has been shown to have similar analytic
sensitivity to some PCR methods for HPV DNA detection (2,
4, 10). HC2 is a sensitive test for the detection of CIN3 and
cervical cancer (CIN3
⫹
) (13) and has received Food and Drug
Administration approval for guiding the management of
women with equivocal cytology (atypical squamous cells) (16,
19).
HC3, like the previous hybrid capture tests, relies on the
formation of target HPV DNA-RNA probe heteroduplexes
during the hybridization step in specimens containing sufficient
HPV DNA and the chemiluminescent detection of these
hy-brids by with an alkaline phosphatase-conjugated monoclonal
antibody specific to DNA-RNA complexes with dioxetane
sub-strate in a 96-well enzyme-linked immunosorbent assay
(ELISA) format (8). A primary technical distinction between
HC3 and HC2 is that HC3 employs a biotinylated DNA
oli-gonucleotide specific for selected HPV DNA sequences for the
capture of the DNA-RNA complexes on streptavidin-coated
wells, whereas HC2 uses wells coated with polyclonal antibody
against DNA-RNA complexes for hybrid capture. The use of
capture oligonucleotide instead of an immobilized antibody
also diminishes the possibility of nonspecific RNA-DNA
hy-brids, present as the result of improperly alkali-denatured
specimens, from binding to the microplate well and
conse-quently may reduce false positivity for HC3 compared to HC2
(3, 10, 17).
To evaluate the performance of a prototype HC3 test for the
detection of CIN3
⫹
with probes that target the same set of 13
carcinogenic HPV types (16, 18, 31, 33, 35, 39, 45, 51, 52, 56,
* Corresponding author. Mailing address: National Cancer Institute,
Division of Cancer Epidemiology and Genetics, 6120 Executive Blvd.,
Room 7074, MSC 7234, Bethesda, MD 20892-7234. Phone: (301)
435-3976. Fax: (301) 402-0916. E-mail: [email protected].
4022
on May 15, 2020 by guest
http://jcm.asm.org/
58, 59, and 68) as targeted by HC2, we tested a risk-stratified
sample of 4,364 cervicovaginal lavage specimens collected
from women enrolled in a 10-year cohort study at Kaiser
Per-manente in Portland, Oreg. (11). Specimens were also tested
with single HC3 probes specific for HPV16 and HPV18. We
compared HC3 test results to previously determined HC2 test
results obtained for the entire cohort of 20,810 women (13),
assessed the optimal threshold for detection of CIN3
⫹
,
com-pared cross-reactivity of both tests with untargeted HPV types
with MY09/11 L1 consensus primer PCR results as the referent
standard (7), and compared test results of single HPV16- and
HPV18-specific HC3 probes to those for PCR.
MATERIALS AND METHODS
[image:2.603.70.521.68.566.2]Study subjects.Between 1 April 1989 and 2 November 1990, 23,702 women were enrolled in a natural history study of HPV infection at the Kaiser Perma-nente Northwest Region prepaid health plan in Portland, Oreg., as previously
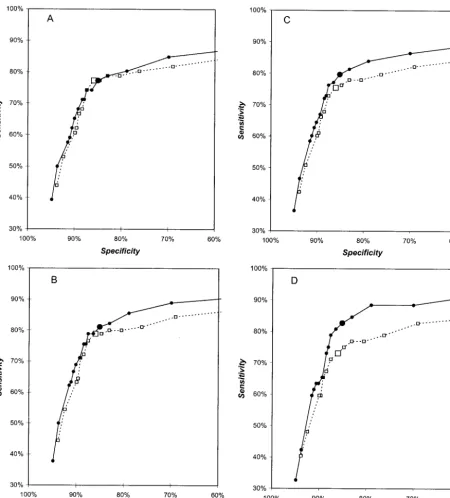
FIG. 1. Receiver operating characteristics (ROCs) for detection of cervical intraepithelial neoplasia grade 3 and cancer (CIN3
⫹
) by HPV DNA
assays HC2 (
■
) and HC3 (
F
). ROCs were calculated for enrollment cases (A), for enrollment cases and those diagnosed within 1 year (B), for
enrollment cases and those diagnosed within 3 years (C), and for cases diagnosed within 3 years excluding enrollment cases (D). Enlarged symbols
indicate the 1.0-pg/ml cut point for HC2 and the 0.6-pg/ml cut point for HC3.
on May 15, 2020 by guest
http://jcm.asm.org/
described (11, 13). Both National Institutes of Health and Kaiser Permanente Institutional review boards approved the study. Subjects were 16 years of age or older, with a mean age of 35.9 years (range, 16 to 94 years). A main analysis cohort of 20,810 women was established and followed passively as part of stan-dard cytologic screening for cervical neoplasia (13). This analysis cohort excluded women who refused to participate (n⫽1,107), had undergone hysterectomy (n
⫽1,406), had an inadequate specimen for HPV testing (n⫽195), had unsatis-factory or missing enrollment cervical smears (n⫽85), or underwent colposcopy rather than Pap smear screening at enrollment (n⫽99).
Enrollment examination.Subjects who consented as required by institutional review boards at Kaiser Permanente and the National Institutes of Health un-derwent a routine pelvic examination (11). Exfoliated cervical cells were col-lected with an Ayre spatula and a cytobrush for Pap test screening. Next, a 10-ml sterile saline cervicovaginal lavage was performed on each subject to collect specimens for HPV testing. Lavages were performed by rinsing the cervical os with 10 ml of sterile physiologic saline with a syringe fitted with an intracatheter
extender and then collecting the pooled fluid in the vaginal fornix with the same device (11).
Lavages were refrigerated within 1 h of collection and shipped to a central laboratory for processing. A 1-ml aliquot was removed for HPV DNA testing by PCR as described elsewhere (8, 12). The remaining volume was split into two aliquots of approximately equal volume and centrifuged at 400⫻gfor 5 min (4°C). After drawing off⬇3 ml of supernatant from the top of each aliquot, the pellet and remaining fluid were suspended, repelleted with a microcentrifuge (16,000⫻gfor 5 min), and the supernatant was decanted. The resulting dry pellets were then frozen at⫺70°C until used for HPV DNA testing.
[image:3.603.46.541.81.217.2]Pathology.Tests reported as “normal” or “benign reactive atypia” were re-classified as “negative for intraepithelial lesion or malignancy (negative)” ac-cording to the Bethesda 2001 classification (17). Tests reported as “severe reac-tive atypia, possibly dysplasia” or “possible koilocytotic or condylomatous atypia” were classified as “atypical squamous cells.” Cytologic interpretations of dyspla-sia were reclassified as low- and high-grade squamous intraepithelial lesions.
TABLE 1. Comparison of cut points and corresponding assay performance for HC2 and HC3 for the detection of CIN3
⫹
in all women
CIN3⫹group Test Cut point(RLU/ PC)
No. positive/
no. tested Est. no. positive/no. Testeda Sensitivityb Specificityb Youden’s indexb,c Referralb
Enrollment (n
⫽
66) HC2
1.0
2,979/20,810
77.3 (67.2–87.4) 85.9 (85.4–86.4) 63.2 (53.0–73.3) 14.3 (13.8–14.8)
HC3
1.0
1,947/4,345
2,464/20,810
71.2 (60.3–82.1) 88.4 (86.9–89.8) 59.6 (48.5–70.6) 11.8 (10.4–13.3)
HC3
0.6
2,156/4,345
3,166/20,810
77.3 (67.2–87.4) 85.0 (83.5–86.5) 62.3 (52.1–72.5) 15.2 (13.7–16.7)
0–1 yr (n
⫽
90)
HC2
1.0
2,979/20,810
78.9 (70.5–87.3) 86.0 (85.5–86.4) 64.9 (56.4–73.3) 14.3 (13.8–14.8)
HC3
1.0
1,947/4,345
2,464/20,810
75.6 (66.7–84.4) 88.4 (87.0–89.9) 64.0 (55.0–73.0) 11.8 (10.4–13.3)
HC3
0.6
2,156/4,345
3,166/20,810
81.1 (73.0–89.2) 85.1 (83.6–86.6) 66.2 (58.0–74.4) 15.2 (13.7–16.7)
0–3 yr (n
⫽
118)
HC2
1.0
2,979/20,810
75.4 (67.7–83.2) 86.0 (85.6–86.5) 61.5 (53.7–69.2) 14.3 (13.8–14.8)
HC3
1.0
1,947/4,345
2,464/20,810
72.0 (63.9–80.1) 88.5 (87.0–90.0) 60.5 (52.3–68.8) 11.8 (10.4–13.3)
HC3
0.6
2,156/4,345
3,166/20,810
79.7 (72.4–86.9) 85.2 (83.7–86.7) 64.8 (57.4–72.3) 15.2 (13.7–16.7)
aEstimated number of positive tests for the entire cohort of 20,810 based on the extrapolation of the test performance within each sample of risk strata. bValues are percentages. Values in parentheses are 95% confidence intervals.cYouden’s index values are presented as summary statistics of clinical performance.
TABLE 2. Comparison of assay performance for HC2 (1.0 RLU/PC cut point) and HC3 (0.6 RLU/PC cut point) for the detection of CIN3
⫹
in women who were cytologically negative at baseline, women who were aged 30
⫹
years with any cytology, and women who were cytologically
negative and aged 30
⫹
years
aStratum Test Group (no. of cases) No. positive/no. tested Est. no. Positive/no. tested Sensitivitya Specificitya Youden’s indexa,b Referrala
Cytologically
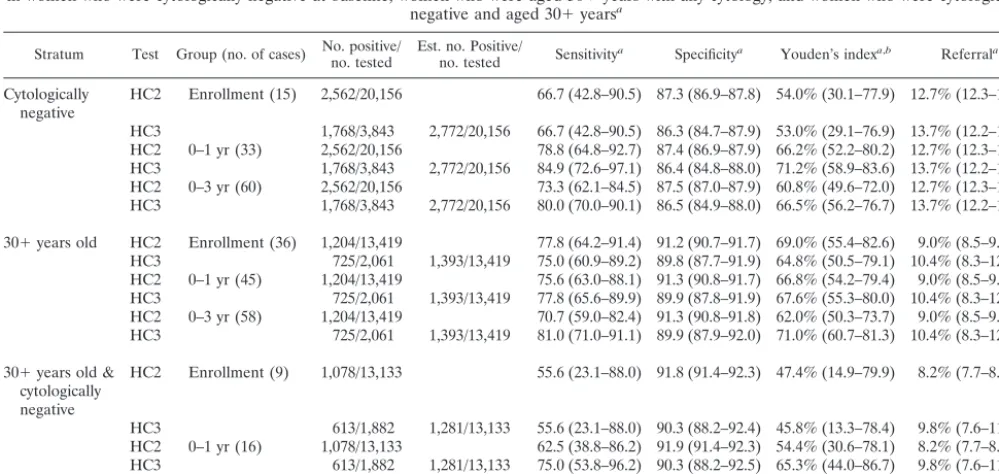
negative HC2 Enrollment (15) 2,562/20,156 66.7 (42.8–90.5) 87.3 (86.9–87.8) 54.0% (30.1–77.9) 12.7% (12.3–13.2) HC3 1,768/3,843 2,772/20,156 66.7 (42.8–90.5) 86.3 (84.7–87.9) 53.0% (29.1–76.9) 13.7% (12.2–15.3) HC2 0–1 yr (33) 2,562/20,156 78.8 (64.8–92.7) 87.4 (86.9–87.9) 66.2% (52.2–80.2) 12.7% (12.3–13.2) HC3 1,768/3,843 2,772/20,156 84.9 (72.6–97.1) 86.4 (84.8–88.0) 71.2% (58.9–83.6) 13.7% (12.2–15.3) HC2 0–3 yr (60) 2,562/20,156 73.3 (62.1–84.5) 87.5 (87.0–87.9) 60.8% (49.6–72.0) 12.7% (12.3–13.2) HC3 1,768/3,843 2,772/20,156 80.0 (70.0–90.1) 86.5 (84.9–88.0) 66.5% (56.2–76.7) 13.7% (12.2–15.3)
30⫹years old HC2 Enrollment (36) 1,204/13,419 77.8 (64.2–91.4) 91.2 (90.7–91.7) 69.0% (55.4–82.6) 9.0% (8.5–9.5) HC3 725/2,061 1,393/13,419 75.0 (60.9–89.2) 89.8 (87.7–91.9) 64.8% (50.5–79.1) 10.4% (8.3–12.4) HC2 0–1 yr (45) 1,204/13,419 75.6 (63.0–88.1) 91.3 (90.8–91.7) 66.8% (54.2–79.4) 9.0% (8.5–9.5) HC3 725/2,061 1,393/13,419 77.8 (65.6–89.9) 89.9 (87.8–91.9) 67.6% (55.3–80.0) 10.4% (8.3–12.4) HC2 0–3 yr (58) 1,204/13,419 70.7 (59.0–82.4) 91.3 (90.8–91.8) 62.0% (50.3–73.7) 9.0% (8.5–9.5) HC3 725/2,061 1,393/13,419 81.0 (71.0–91.1) 89.9 (87.9–92.0) 71.0% (60.7–81.3) 10.4% (8.3–12.4)
30⫹years old & cytologically negative
HC2 Enrollment (9) 1,078/13,133 55.6 (23.1–88.0) 91.8 (91.4–92.3) 47.4% (14.9–79.9) 8.2% (7.7–8.7)
HC3 613/1,882 1,281/13,133 55.6 (23.1–88.0) 90.3 (88.2–92.4) 45.8% (13.3–78.4) 9.8% (7.6–11.9) HC2 0–1 yr (16) 1,078/13,133 62.5 (38.8–86.2) 91.9 (91.4–92.3) 54.4% (30.6–78.1) 8.2% (7.7–8.7) HC3 613/1,882 1,281/13,133 75.0 (53.8–96.2) 90.3 (88.2–92.5) 65.3% (44.0–86.7) 9.8% (7.6–11.9) HC2 0–3 yr (28) 1,078/13,133 60.7 (42.6–78.8) 91.9 (91.4–92.4) 52.6% (34.5–70.7) 8.2% (7.7–8.7) HC3 613/1,882 1,281/13,133 82.1 (68.0–96.3) 90.4 (88.3–92.5) 72.5% (58.2–86.9) 9.8% (7.6–11.9)
aValues are percentages. Values in parentheses are 95% confidence intervals. bSee Table 1, footnotec.
on May 15, 2020 by guest
http://jcm.asm.org/
[image:3.603.43.543.470.707.2]Women with rigorously defined histopathologic CIN3 or cancer (including endocervical adenocarcinoma in situ) were designated as cases. To avoid mis-classification of less severe lesions as cases, we restricted our case group to women who had received original histopathologic diagnoses of CIN3 or cancer on two different clinical specimens obtained on different dates (usually a diag-nostic punch biopsy and a cone performed for treatment) or who met specific review criteria. The review criteria were an original histopathologic diagnosis of CIN2 reviewed as CIN3 or worse or an original histopathologic diagnosis of CIN3 or worse confirmed as at least CIN2. A single pathologist applying strin-gent criteria performed the reviews.
Follow-up.During the study period, annual cytologic screening of women at Kaiser Permanente was standard practice. Tests were generally obtained at clinic visits if screening had not been performed within the prior 9 months or there was clinical suspicion of a cervical abnormality. Patients with abnormal cytology were managed according to standard practice guidelines at Kaiser Permanente, which included ablative or excisional treatment for histologic diagnoses of cervical intraepithelial neoplasia grade 2 (CIN2) or worse and some CIN1. HPV testing was not used to direct patient management.
Follow-up time was divided into an initial period of 9 months to capture overt prevalent disease, followed by analogous yearly intervals (9 to 21 months, 21 to 33 months, etc.) to the completion of the study for a total time of 122 months of follow-up. For some analyses (see below), cases that were diagnosed within the first 21 months of follow-up and those that were diagnosed within the first 45 months were included with those that were diagnosed at enrollment. Function-ally, it represents the screening that was performed up to the first year and third year of annual screening, respectively.
Hybrid capture HPV testing.Frozen aliquots of cervicovaginal lavage speci-mens were retrospectively tested. First the entire cohort was tested with HC2 (n
⫽20,810) (13), and then risk-stratified samples were retested with HC3 (n⫽ 4,364). Both used probe sets that target HPV DNA of 13 cancer-associated HPV types (8). Signal strengths in relative light units (RLU) were compared to 1 pg/ml HPV type 16 DNA-positive controls (PC). Based on a previous study (12), specimens withⱖ1 RLU/PC for HC2 testing were a priori considered test positive. Hybrid capture tests were performed at Digene Corporation masked to the clinical results and previous PCR results for HPV DNA testing, and HC3 was also performed masked to the results of the previous HC2 testing.
HC3 was performed on a risk-stratified sample of 4,364 enrollment cervico-vaginal lavage aliquots. Specimens were selected and tested based on five hier-archical sampling criteria: (i) to permit direct calculations of assay sensitivity, all 171 cases of CIN3⫹diagnosed over the 10-year study (n⫽171 results, 100%);
(ii) 867 women who were not diagnosed with CIN3⫹but who were previously reported to be test positive by MY09/11 L1 consensus primer PCR (n⫽855 results, 98.6%); (iii) All 2,260 women who were either not tested or negative by PCR but positive by HC2 (n⫽2,253 results, 99.7%); (iv) the 23 women with an enrollment Pap smear interpreted as low squamous intraepithelial lesion or more severe and not captured by the above strata (n⫽23 results, 100%). (v) A 6% random sample of the remaining 17,489 women not included in the above strata was tested (n⫽1,043 results, 100%). Overall, we had results on 4,345 of 4,364 specimens (99.6%) tested. For type-specific assays with HPV16 and HPV18 probes, there were 4,321 test results (99.0%).
MY09/MY11 L1 consensus primer PCR.MY09/MY11 L1 consensus primer PCR (MY09/11 PCR) test results were available from previous studies in this cohort (n⫽1,247) (7, 11). A first batch of MY09/11 PCR testing was performed at Cetus Corporation (M. M. Manos), and then a second batch of testing was performed at Albert Einstein College of Medicine (R. D. Burk). Proteinase K-digested cellular specimens were tested for HPV by MY09/MY11 L1 consen-sus primer PCR with AmpliTaq polymerase (Perkin Elmer Cetus, Norwalk, Conn.) (7). Primers for-globin were used as the internal PCR amplification control. Amplified DNA was separated by electrophoresis, transferred to a nylon membrane, and hybridized with radiolabeled generic probes for HPV.
Specimens (n⫽927) at the M. M. Manos laboratory were tested for the following individual types: 6/11, 16, 18, 26, 31, 33, 35, 39, 40, 42, 45, 51 to 59, 66, 68, 73, 82 [W13B], 83 [PAP291], and 84 [PAP155]. Specimens (n⫽342) at the R. D. Burk laboratory were tested for the following individual types: 2, 6, 11, 13, 16, 18, 26, 31-5, 39, 40, 42, 45, 51 to 59, 61, 66 to 70, 71 [AE8], 72-4, 81 [AE7], 82 [W13B], 82v [AE2], 83 [PAP291], 84 [PAP155], 85 [AE5], and AE6. Thirty-two specimens were tested by both laboratories, and the results were combined such that positive for any type by either assay was considered positive for that type. The HPV test positive specimens that were negative by all type-specific probes were classified as HPV test positive with undetermined HPV types and were excluded from type-specific analysis. Those specimens demonstrating only weak signals when hybridized with the generic HPV probe and were negative for type-specific probes were conservatively considered to be test negative.
Statistical analysis.To extrapolate HC3 data to the whole cohort, sensitivity percentages were calculated directly (as all high-grade lesions and cancers were tested). To compute test positivity in the whole study population, numbers of HPV-positive specimens for each of the five sampling strata were divided by sampling fractions to derive the number of estimated HPV-positive test results derived from that stratum. Numbers of positive test results expected from each expanded stratum were added to obtain a total estimate of positive test results, which was divided by the number of women in the cohort to obtain the percent-age of positive tests in the population. Sensitivity, specificity, and referral rates were all calculated with 95% confidence intervals (95% CI).
Referral rates were based on the assumption that a positive test would be the basis of colposcopic referral (i.e., referral rate equals test positivity). A measure-ment of test accuracy, Youden’s index, was also calculated with 95% CI (Youden’s index equals percent sensitivity plus percent specificity⫺100%; a test with perfect sensitivity and specificity has a Youden’s index of 100%) (14). We evaluated the statistical significance of differences in accuracy (i.e., test positivity for cases and test negativity for noncases) with a newly developed Z-test (Guill-ermo Marshall, in preparation) to account for screening accuracy for the two tests being evaluated in the same individuals and to give equal weight to sensi-tivity and specificity, just as Youden’s index does. The Z statistic is computed according to the formula:
Z⫽
n⫹⫺⫺n⫺⫹
n ⫺
m⫹⫺⫺m⫺⫹
m
冑
n⫺⫹⫹n⫹⫺⫺关n⫹⫺⫺n⫺⫹兴2/nn2 ⫹
m⫺⫹⫹m⫹⫺⫺关m⫹⫺⫺m⫺⫹兴2/m
m2
wherenis the number of cases,mis the number of noncases,n⫹⫺is the number of cases classified properly as positive only by test strategy 1,n⫺⫹is the number of cases classified as positive by test strategy 2 only,m⫺⫹is the number of noncases classified properly as negative by test strategy 1 only, andm⫹⫺is the number of noncases classified properly as negative by test strategy 2 only. Only discordant test results figure into this statistic, and women with missing values for either test were excluded.
[image:4.603.43.285.99.224.2]Receiver operating characteristic (ROC) analyses (20), modified by using specificity instead of 1⫺specificity, for detection of CIN3⫹diagnosed at en-rollment currently with cervicovaginal lavage specimen collection (n⫽66) were performed for both HC2 and HC3 with the following cut points: 0.1, 0.2, 0.3, 0.4, 0.5, 0.6, 0.7, 0.8, 0.9, 1.0, 1.2, 1.4, 1.6, 1.8, 2.0, 5.0, and 10.0 RLU/PC (there is a linear relationship between RLU/PC and picogram per milliliter values above 1
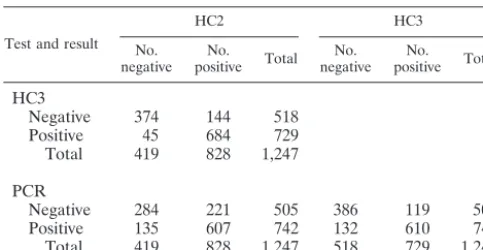
TABLE 3. Comparison of MY09/11 L1 consensus PCR, HC3, and
HC2 detection of HPV types 16, 18, 31, 33, 35, 39, 45, 51, 52, 56,
58, 59, and 68 (targeted types); interassay comparisons
Test and result
HC2 HC3
No.
negative positiveNo. Total negativeNo. positiveNo. Total
HC3
Negative
374
144
518
Positive
45
684
729
Total
419
828
1,247
PCR
Negative
284
221
505
386
119
505
Positive
135
607
742
132
610
742
[image:4.603.44.283.645.706.2]Total
419
828
1,247
518
729
1,247
TABLE 4. Interassay comparison statistics
aTest
% Exact
agreement Kappa (95% CI) McNemar’s2
HC2 HC3 HC2 HC3 HC2 HC3
HC3 84.8 0.68 (0.62–0.73) ⬍0.001 (HC2)
PCR 69.1 79.9 0.39 (0.34–0.44) 0.58 (0.53–0.64) ⬍0.0001 (PCR) 0.4
aIn the final column, the test with the greatest positivity for oncogenic HPV is shown in parentheses.
on May 15, 2020 by guest
http://jcm.asm.org/
RLU/PC for HC2) (8, 17). The cut point of 1.0 RLU/PC (⫽1.0 pg/ml) is standard for the HC2 (12); we wished to confirm this choice with cervicovaginal lavage specimens. To address the possibility that Pap screening at enrollment missed some prevalent cases or that some cases developed rapidly, separate ROC analyses were performed to include those cases diagnosed at enrollment through the first year of follow-up (0- to 1-year cases) (n⫽90), those cases diagnosed at enrollment through the first 3 years of follow-up (0- to 3-year cases) (n⫽118), and those cases diagnosed in the first 3 years of follow-up excluding the enrollment cases (n⫽52). With the optimal cut points from these ROC analyses, we also examined the performance characteristics of these tests on groups of women that might be targeted by HPV screening: women 30 years and over, cytologically negative women, and the combination. Additional analyses that included unreviewed histologic CIN2 cases (n⫽111, enrollment;n⫽149, 0- to 1-year cases;n⫽199, 0- to 3-year cases) were also performed.
For the subset of specimens for which MY09/11 PCR, HC2, and HC3 data were available (n⫽1,247), we also evaluated HPV type specificity of the two hybrid capture tests by comparing the test results to referent PCR test results with contingency tables and Pearson2tests. MY09/11 PCR data were ranked
hierarchically: (i) test positive for the 13 cancer-associated (high-risk) HPV types targeted by hybrid capture assays, else (ii) test negative for the targeted HPV types but positive for one or more untargeted HPV types (including HPV DNA positives by the generic probe but uncharacterized by type-specific probes), else (iii) HPV DNA negative. HC2 and HC3 data were categorized by whether both tests were negative (HC2⫺/HC3), HC2 was negative but HC3 was positive (HC2⫺/HC3⫹), HC2 was positive but HC3 was negative (HC2⫹/HC3⫺), or both tests were positive (HC2⫹/HC3⫹). Test results for 13 targeted high-risk types by all three HPV DNA assays were compared with kappa analyses and McNemar2.
To examine the test positivity for single targeted types and the predilection for test positivity for untargeted types (cross-reactivity), HC3 test results were com-pared to HC2 test results with McNemar’s2restricted to PCR test positives for
a single HPV type. As a crude measure for comparing the sensitivity and spec-ificity of each assay among the women with valid tests for all three assays, logistic regression was used to calculate the crude odds ratios (OR) and 95% CI as an estimate of the association of these HPV types with CIN3⫹.
PCR data were also used to evaluate the test results of single type-specific HC3 probes for HPV16 and HPV18 by with kappa analyses and McNemar2tests.
Logistic regression, restricted to the 1,189 women with test results for the type 16 and 18 probes and for PCR, was again used to calculate the OR and 95% CI to estimate the association of hierarchical HPV categories (HPV16⬎HPV18⬎ other targeted high-risk types⬎all other types and HPV DNA negatives), as detected by PCR and HC3, with CIN3⫹.
RESULTS
An ROC analysis was performed to determine the optimal
cut point for HC3, based on testing a risk-stratified sample of
the cohort and extrapolating those results to the cohort. A
parallel analysis for HC2, based on previous testing of the
entire cohort (13), was performed because cervicovaginal
la-vage samples are not the standard cervical specimen for HPV
DNA detection by hybrid capture and the effect of using this
type of specimen on assay performance is unknown.
[image:5.603.41.544.89.225.2]As shown in Fig. 1A to C, the ROC curves for both HC3 and
HC3 with and without early follow-up cases have inflection
points at
⬇
75% to 80% sensitivity and 85% to 90% specificity.
At specificities lower than the inflection point, HC3 was more
sensitive than HC2 for a given specificity, and this difference
was greater when including early follow-up cases. Figure 1D
shows the ROC curves for cases that were diagnosed after
enrollment but within 3 years, showing that the primary
ana-lytic distinction between HC3 and HC2 appeared to be the
ability of HC3 to detect these early follow-up cases. The
opti-mal cut point for HC3 and HC2 was 0.6 RLU/PC and 1.0
RLU/PC, respectively, for enrollment cases, 0- to 1-year cases,
and 0- to 3-year cases.
TABLE 5. Association of CIN3
⫹
(odds ratios [OR] and 95% CI) with the HPV types listed for Tables 3 and 4 as detected by the
three methods
Group Total no. MY09/11 PCR HC3 HC2
No. positive OR (95% CI) No. positive OR (95% CI) No. positive OR (95% CI)
Enrollment
Controls
1,195
699
1
686
1
785
1
Cases (CIN3
⫹
)
52
43
3.89 (1.64–7.02)
43
3.55 (1.71–7.34)
43
2.50 (1.20–5.17)
0–1 yr
Controls
1,175
682
1
688
1
768
1
Cases (CIN3
⫹
)
72
60
3.61 (1.92–6.79)
61
4.21 (2.19–8.08)
60
2.65 (1.41–4.98)
0–3 yr
Controls
1,155
671
1
655
1
756
1
Cases (CIN3
⫹
)
92
71
2.44 (1.48–4.02)
74
3.14 (1.85–5.32)
72
1.90 (1.14–3.16)
TABLE 6. Comparison of HC2 and HC3 HPV type specificity with MY09 L1 consensus primer PCR results available for 1,247 specimens
aHPV group (PCR) No. (%) of cases
HC2⫺/HC3⫺ HC2⫺/HC3⫹ HC2⫹/HC3⫺ HC2⫹/HC3⫹ Total
Negative
139 (53.6)
8 (3.1)
68 (26.1)
46 (18.5)
261 (100.0)
Untargeted types
132 (51.6)
5 (2.1)
62 (25.4)
45 (18.4)
244 (100.0)
Targeted types
118 (15.9)
17 (2.3)
29 (3.9)
578 (77.9)
742 (100.0)
Total
389
30
159
669
1,247
aPCR data were classified hierchically: targeted types (16, 18, 31, 33, 35, 39, 45, 51, 52, 56, 58, 59, and 68), if not target then untargeted types, else negative. HC2 (1.0-pg/ml cut point) and HC3 (0.6-pg/ml cut point) data were categorized by whether both tests were negative (HC2⫺/HC3⫺), HC2 was negative but HC3 was positive (HC2⫺/HC3⫹), HC2 was positive but HC3 was negative (HC2⫹/HC3⫺), or both tests were positive (HC2⫹/HC3⫹). Raw percentages are shown in italics.P⬍0.001, Pearson2, overall;P⬍0.001, Pearson2; HC2⫺/HC3⫹versus HC2⫹/HC3⫺.
on May 15, 2020 by guest
http://jcm.asm.org/
[image:5.603.43.539.621.690.2]The assay performances of these tests are summarized in
Table 1. The referral rate (equal to the percentage of women
with at least one of the 13 targeted HPV types) for HC3 was
estimated to be 15.2% (95% CI
⫽
13.7% to 16.7%), compared
to a referral rate of 14.3% (95% CI
⫽
13.8% to 14.8%) for
HC2. For enrollment cases alone, the accuracy of HC3
posi-tivity (
ⱖ
0.6 RLU/PC), as measured by Youden’s index, was
similar to HC2 positivity (
ⱖ
1.0 RLU/PC) (Table 1). HC3
pos-itivity (
ⱖ
0.6 RLU/PC) was nonsignificantly more sensitive and
had similar specificity compared to HC2 positivity (
ⱖ
1.0 RLU/
PC) when early cases of CIN3
⫹
were included in the analysis.
Inclusion of unreviewed CIN2 diagnoses into our case
defini-tion did not appreciably alter the performances of these two
tests (data not shown).
We examined the performances of HC3 positivity (
ⱖ
0.6
RLU/PC) (extrapolated results based on testing a
risk-strati-fied sample) and HC2 positivity (
ⱖ
1.0 RLU/PC) in groups of
women that might be targeted for screening and ancillary
test-ing for negative reassurance: in women of all ages who were
cytologically negative at enrollment, women who were aged
30
⫹
years regardless of cytology result, and women who were
cytologically negative and aged 30
⫹
years (Table 2). In these
subgroups, there was no difference in performance (as
mea-sured by Youden’s index) of HC3 positivity (
ⱖ
0.6 RLU/PC)
and HC2 positivity (
ⱖ
1.0 RLU/PC) for detection of
enroll-ment cases. For 0- to 3-year cases, HC3 positivity (
ⱖ
0.6 RLU/
PC) was nonsignificantly more accurate than HC2 positivity
(
ⱖ
1.0 RLU/PC) among cytologically negative women and
among women who were 30
⫹
years of age. Among the
cyto-logically negative women aged 30
⫹
years, the improved
accu-racy of HC3 positivity (
ⱖ
0.6 RLU/PC) compared to HC2
pos-itivity (
ⱖ
1.0 RLU/PC) was significant (
P
⫽
0.006).
The exact agreement and kappa value for HC3 positivity
(
ⱖ
0.6 RLU/PC) and HC2 positivity (
ⱖ
1.0 RLU/PC) were
76.6% and 0.53 (95% CI
⫽
0.51 to 0.56), respectively, with
specimens more likely to be HC2 positive (
ⱖ
1.0 RLU/PC) for
the 4,345 specimens tested by both assays (
P
⬍
0.0001,
McNe-mar’s
2). A subset of 1,247 specimens also had MY09/11 PCR
test results, and we examined the interassay agreement of the
three HPV DNA assays for the 13 HPV types targeted by
hybrid capture assays (Tables 3 and 4). Overall, in this subset
of specimens selected for high HPV DNA prevalence, there
was 66.4% HC2 positivity (
ⱖ
1.0 RLU/PC), 58.5% HC3
posi-tivity (
ⱖ
0.6 RLU/PC), and 59.5% PCR positivity for the
tar-geted types (all type PCR test positivity was 79.1%). The exact
agreement and kappa value for HC3 positivity (
ⱖ
0.6 RLU/PC)
versus HC2 positivity (
ⱖ
1.0 RLU/PC) were 84.8% and 0.68
(95% CI
⫽
0.62 to 0.73), respectively, with specimens more
likely to be test positive by HC2 (
P
⬍
0.0001, McNemar’s
2).
For HC2 positivity (
ⱖ
1.0 RLU/PC) versus PCR positivity, the
exact agreement and kappa value were 69.1% and 0.39 (95%
CI
⫽
0.34 to 0.44), respectively, with specimens more likely to
be test positive by HC2 (
P
⬍
0.0001, McNemar’s
2). For HC3
positivity (
ⱖ
0.6 RLU/PC) versus PCR positivity, the exact
agreement and kappa value were 79.0% and 0.58 (95% CI
⫽
0.53 to 0.64), respectively, and there was no difference in the
positivity between the two tests (
P
⫽
0.4, McNemar’s
2). The
OR values for the association of test positivity with CIN3
⫹
, as
detected by each method, indicated that each method tested
positive for a similar proportion of HPV in cases compared to
HPV noncases, although HC2 detection had consistently but
nonsignificantly lower OR than detection by other methods
(Table 5).
We next compared the paired test results of HC3 (
ⱖ
0.6
RLU/PC) and HC2 (
ⱖ
1.0 RLU/PC) to the referent MY09/
MY11 PCR test results categorized as negative, untargeted
types, and targeted types to evaluate the discordant test results
(HC2
⫹
/HC3
⫺
and HC2
⫺
/HC3
⫹
). As shown in Table 6 and
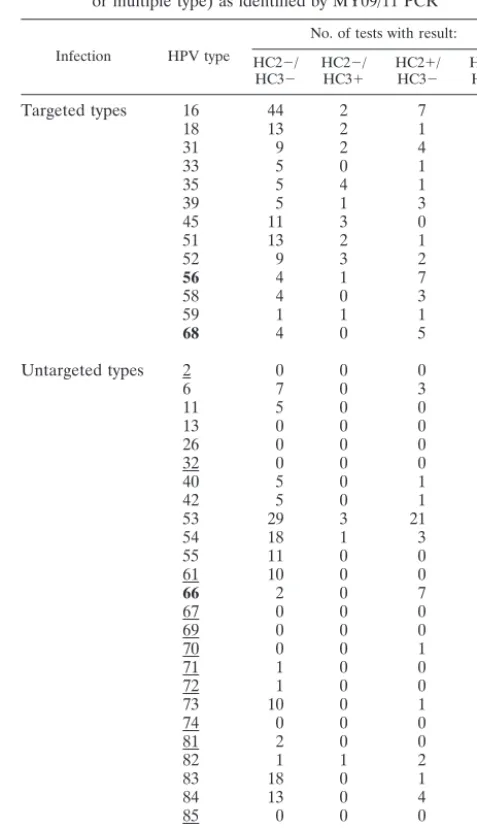
Appendix 1 (Tables A1 and A2), a greater proportion of
imens classified by PCR as either negative specimens or
spec-imens with untargeted types were HC2
⫹
/HC3
⫺
than were
HC2
⫺
/HC3
⫹
(
P
⬍
0.0001, Pearson
2). HC3 (
ⱖ
0.6 RLU/PC)
was slightly more likely than HC2 (
ⱖ
1.0 RLU/PC) to test
positive for specimens that tested positive by PCR for single
type infections HPV18 (
P
⫽
0.08, McNemar’s
2), HPV45 (
P
⫽
0.08, McNemar’s
2), HPV51 (
P
⫽
0.08, McNemar’s
2),
and HC2 was marginally more likely than HC3 to test positive
for specimens that tested positive by PCR for single type
in-fections HPV56 (
P
⫽
0.1, McNemar’s
2). There were no
differences between HC2 positivity (
ⱖ
1.0 RLU/PC) and HC3
positivity (
ⱖ
0.6 RLU/PC) for specimens that tested positive by
PCR for HPV16 (
P
⫽
0.7). Restricting to single PCR-positive
types not targeted by hybrid capture assays, HC2 was more
likely than HC3 to test positive for HPV53 (
P
⫽
0.001,
McNe-mar’s
2) and HPV66 (
P
⫽
0.01, McNemar’s
2) (Table A2).
[image:6.603.302.543.108.179.2]We also compared the test positivity by individual HC3
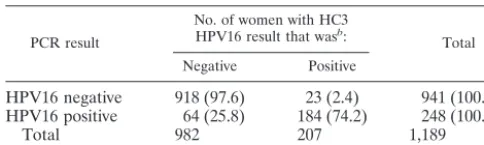
TABLE 7. Comparison of type-specific detection of HPV16 by an
HC3 HPV16 probe (0.6 pg/ml) to detection by MY09/11 L1
consensus primer PCR for 1,189 women with valid PCR results and
type-specific HC3 data
aPCR result
No. of women with HC3 HPV16 result that wasb:
Total Negative Positive
HPV16 negative
918 (97.6)
23 (2.4)
941 (100.0)
HPV16 positive
64 (25.8)
184 (74.2)
248 (100.0)
Total
982
207
1,189
aExact agreement⫽92.6%, ⫽0.76 (95% CI⫽0.71–0.82), McNemar’s2
⬍0.001.
[image:6.603.42.284.109.181.2]bValues in parentheses are raw percentages.
TABLE 8. Comparison of type-specific detection of HPV18 by an
HC3 HPV18 probe (0.6 pg/ml) to detection by MY09/11 L1
consensus primer PCR for 1,189 women with valid PCR results and
HC3 data
aPCR result
No. of women with HC3 HPV18 result that wasb:
Total Negative Positive
HPV18 negative
1.091 (98.8)
13 (1.2)
1,104 (100.0)
HPV18 positive
26 (30.6)
59 (69.4)
85 (100.0)
Total
1,232
75
1,189
aExact agreement⫽96.8%, ⫽0.73 (95% CI⫽0.68–0.79), McNemar’s2⫽
0.04.
bValues in parentheses are raw percentages.
on May 15, 2020 by guest
http://jcm.asm.org/
probes (
ⱖ
0.6 RLU/PC) for HPV16 and HPV18 to that of PCR
positivity for these types (Table 7). For HPV16, there was an
exact agreement of 92.6% and a kappa value of 0.75 (95% CI
⫽
0.69 to 0.80), with specimens more likely to be test positive
by PCR (
P
⬍
0.001, McNemar’s
2) (Table 7). For HPV18,
there was an exact agreement of 96.8% and a kappa value of
0.72 (95% CI
⫽
0.67 to 0.77), with specimens marginally more
likely to be test positive by PCR (
P
⫽
0.04, McNemar’s
2)
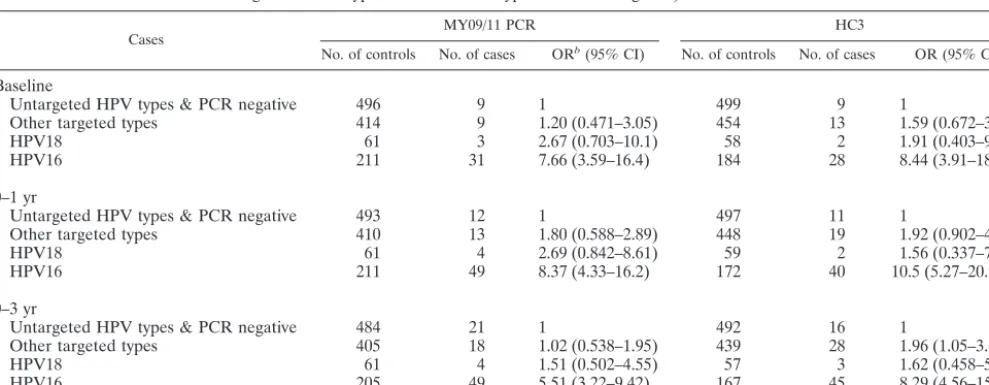
(Table 8). Finally, there was a nonsignificant but consistent
lesser tendency for HC3 HPV16 positivity (
ⱖ
0.6 RLU/PC) in
controls than PCR detection as reflected in the slightly higher
OR values shown in Table 9.
DISCUSSION
We present the first data on the performance of a prototype
version of HC3, possibly the next generation of hybrid capture
test for targeting the 13 HPV types most strongly associated
with cervical cancer. Based on these analyses, the optimal cut
point for HC3, 0.6 RLU/PC, was lower than the optimal cut
point of the HC2 test, 1.0 RLU/PC. HC3 at this cut point had
very similar performance to HC2 for detection of enrollment
cases. However, HC3 was nonsignificantly more sensitive than
and equally specific as HC2 for detection of CIN3
⫹
when both
enrollment and early follow-up cases were included in the
analysis, particularly in women who were 30 years and older
and were cytologically negative by conventional Pap, perhaps
as the result of using a lower threshold for a positive test. Since
the interval for diagnosing of CIN3 from the initial HPV
in-fection averages 5 years (7) or more, the inclusion of CIN3
⫹
during follow-up of 1 or 3 years most likely represents missed
detection by standard Pap screening but could also represent
enrollment HPV infection that has not yet (rapidly) progressed
to recognizable CIN3
⫹
.
HC3 was designed to minimize cross-reactivity with
untar-geted, generally low-risk HPV types that HC2 occasionally
detects. We examined the fidelity of these two tests by
com-paring test results to PCR test results, our referent standard, in
a subset of specimens with very high HPV “prevalence,” a
choice which would emphasize the phenomenon of
cross-reac-tivity. The overall test positivity for targeted types was higher
for HC2 than for HC3 or PCR (Table 3), but comparison of
discordant test results (HC2 versus HC3) (Table 6) reveals that
many of the additional test positives for HC2 were classified as
untargeted (nononcogenic) types. Thus, discrepancies in
sen-sitivity between HC2 and the other assays for the targeted
types appear to be the result of cross-reactivity (false positivity)
with untargeted types rather than true greater sensitivity by
HC2. We also note that the overall agreement test positivity
between PCR and HC3 (0.6 RLU/PC) for targeted types was
better than the agreement between PCR and HC2 (1.0 RLU/
PC), suggesting that HC3 was performing more like PCR in
terms of type fidelity.
[image:7.603.48.543.88.280.2]Systematic studies comparing HC2 testing to type-specific
PCR data demonstrated test positivity for untargeted HPV
types 53, 66, 67, and 71 as well as occasional test positivity to
other untargeted HPV types (3, 11, 19); the impact of the test
positivity for untargeted HPV types on screening performance
will depend on the prevalence of these types in different
pop-ulations. In our analyses, we found that the test positivity for
untargeted HPV types 53 and 66 was significantly less with
HC3 (0.6 RLU/PC) than with HC2 (1.0 RLU/PC). No
infec-tions of type 67 and one infection of type 71 were identified by
PCR in this set of specimens, and thus HC2 and HC3 could not
be evaluated for these types. It is of note that there is now
evidence to suggest that type 66 and a few other questionably
high-risk HPV types confer appreciable risk of cervical cancer
(9), and therefore the inclusion of additional probes for these
types may theoretically improve the performance of
subse-quent versions of HC3. Since test positivity in HC3 can be
TABLE 9. Comparison of odds ratio and 95% CI for the association of hierarchical HPV risk groups (HPV16
⬎
HPV18
⬎
other targeted
high-risk HPV types
a⬎
other HPV types and HPV negative) with CIN3
⫹
Cases MY09/11 PCR HC3
No. of controls No. of cases ORb(95% CI) No. of controls No. of cases OR (95% CI)
Baseline
Untargeted HPV types & PCR negative
496
9
1
499
9
1
Other targeted types
414
9
1.20 (0.471–3.05)
454
13
1.59 (0.672–3.75)
HPV18
61
3
2.67 (0.703–10.1)
58
2
1.91 (0.403–9.06)
HPV16
211
31
7.66 (3.59–16.4)
184
28
8.44 (3.91–18.2)
0–1 yr
Untargeted HPV types & PCR negative
493
12
1
497
11
1
Other targeted types
410
13
1.80 (0.588–2.89)
448
19
1.92 (0.902–4.07)
HPV18
61
4
2.69 (0.842–8.61)
59
2
1.56 (0.337–7.20)
HPV16
211
49
8.37 (4.33–16.2)
172
40
10.5 (5.27–20.9)
0–3 yr
Untargeted HPV types & PCR negative
484
21
1
492
16
1
Other targeted types
405
18
1.02 (0.538–1.95)
439
28
1.96 (1.05–3.67)
HPV18
61
4
1.51 (0.502–4.55)
57
3
1.62 (0.458–5.72)
HPV16
205
49
5.51 (3.22–9.42)
167
45
8.29 (4.56–15.1)
aHPV types 31, 33, 35, 39, 45, 51, 52, 56, 58, 59, and 68. bOR, odds ratio.
on May 15, 2020 by guest
http://jcm.asm.org/
tightly controlled by the design of the capture oligonucleotides
and the temperature of the hybridization reaction, future work
may investigate if the reintroduction of a small degree of
re-activity for these types may benefit the clinical performance of
the test.
One limitation of this study is the use of cervicovaginal
lavage specimens, which are neither the standard nor optimal
specimens for the hybrid capture tests and not the standard
collection as part of regular cytology screening. To overcome
this limitation, we included parallel ROC analyses of HC2 for
the purpose of comparison. Although the overall performance
of HC2 testing was lower than what has been observed in other
studies of HC2 (9), we note that the optimal cut point for HC2
was again 1.0 RLU/PC, as had been observed with directly
sampled cervical specimens (13), suggesting that conclusions
about the relative performance of HC3 (
ⱖ
0.6 RLU/PC) are
valid. However, we cannot rule out that the use of
cervicovagi-nal lavage samples may have differentially affected the
perfor-mance of the assays. A second consideration may be that the
specimens used are
⬎
10 years old, and it is possible that there
was some specimen degradation over time. Given the
afore-mentioned differences in the performance of HC2 (
ⱖ
1.0 RLU/
PC) likely attributable to the method of cervical sampling, we
suggest that the performance of HC3 (
ⱖ
0.6 RLU/PC) may be
enhanced with the use of fresh, swab- or brush-collected
spec-imens for testing, but this awaits confirmation.
The reasons for the increased positivity of HC3 (
ⱖ
0.6 RLU/
PC) compared to HC2 (
ⱖ
1.0 RLU/PC) associated with CIN3
⫹
during follow-up are unclear. Given the small number of cases
detected by HC3 and not by HC2 during the early follow-up of
all women (
n
⫽
5), we cannot rule out a chance finding.
Alternatively, the lower cut point for HC3 compared to HC2
may permit the detection of some lower viral load HPV
infec-tions associated with either missed prevalent CIN3
⫹
or
CIN3
⫹
that developed rapidly into overt disease during the
3-year follow-up. This optimal lower threshold for positivity for
the HC3 assay may reflect its greater ability to distinguish
between targeted hybrids and competing nonspecific hybrids.
It is noteworthy that HC3 was a more sensitive and equally
specific test for CIN3
⫹
compared to HC2 among women who
were cytologically negative, a cytologic interpretation that is
consistent with lower viral loads (13).
As a proof of principle, we demonstrated typing with HPV16
and HPV18 with single HC3 probes with a cut point of 0.6
RLU/PC. The test positivity of HPV16 and HPV18 probes in
HC3 was consistent with detection of these types by PCR, but
in contrast to detection of the 13 types with the HC3 probe set,
single-type detection by HC3 had a somewhat lower analytical
sensitivity than PCR.
For targeted screening of women in some geographic
re-gions, it may be worth considering a higher cut point for HC3
(or HC2) to reduce referral rates as the result of increased
specificity while maintaining high sensitivity. For example,
HC3 at a cut point of 0.8 RLU/PC would result in sensitivities,
specificities, and Youden’s indices of 74.2%, 87.4%, and
61.7%, respectively, for enrollment CIN3
⫹
and 76.3%, 87.6%
and 63.9%, respectively, for 0- to 3-year CIN3
⫹
, with a referral
rate of 12.8%. Such trade-offs may be worth examining in a
formal cost-to-benefit analysis.
In conclusion, we suggest that HC3 (
ⱖ
0.6 RLU/PC) may be
a slightly more sensitive, equally specific test for the detection
of CIN3
⫹
over the duration of typical screening intervals
com-pared to its predecessor, HC2 (
ⱖ
1.0 RLU/PC). The increased
sensitivity of HC3 (
ⱖ
0.6 RLU/PC) compared to HC2 (
ⱖ
1.0
RLU/PC) appears to be the result of increased detection of
CIN3
⫹
in women who were 30 years of age or older and were
cytologically negative. We emphasize that further validation
studies of HC3 are needed with more clinically relevant
cervi-cal specimens.
APPENDIX
[image:8.603.300.539.278.692.2]Tables A1 and A2 present HC2 and HC3 positivity and
cross-reactivity identified by MY09/11 PCR.
TABLE A1. HC2 and HC3 positivity for any HPV infection (single
or multiple type) as identified by MY09/11 PCR
aInfection HPV type
No. of tests with result: HC2⫺/
HC3⫺ HC2HC3⫺⫹/ HC2HC3⫹⫺/ HC2HC3⫹⫹/
Targeted types
16
44
2
7
201
18
13
2
1
69
31
9
2
4
75
33
5
0
1
38
35
5
4
1
40
39
5
1
3
53
45
11
3
0
43
51
13
2
1
74
52
9
3
2
61
56
4
1
7
72
58
4
0
3
52
59
1
1
1
36
68
4
0
5
17
Untargeted types
2
0
0
0
0
6
7
0
3
3
11
5
0
0
0
13
0
0
0
0
26
0
0
0
1
32
0
0
0
0
40
5
0
1
0
42
5
0
1
0
53
29
3
21
1
54
18
1
3
1
55
11
0
0
0
61
10
0
0
1
66
2
0
7
2
67
0
0
0
0
69
0
0
0
0
70
0
0
1
0
71
1
0
0
0
72
1
0
0
0
73
10
0
1
3
74
0
0
0
0
81
2
0
0
1
82
1
1
2
2
83
18
0
1
0
84
13
0
4
3
85
0
0
0
0
82v
0
0
1
1
AE6
0
0
2
1
aFor untargeted (nononcogenic) HPV type infections, multitype infections that included targeted (oncogenic) types were excluded. Underlining indicates that only one laboratory (R.D.B.) tested for these types. Boldfacing indicate a significant difference (McNemar’s2test) in detection between the two tests.
on May 15, 2020 by guest
http://jcm.asm.org/
ACKNOWLEDGMENTS
We gratefully acknowledge Patricia Lawler, Chris Eddy, Leilani
Wilson, and the clinicians at Kaiser Permanente, Diane Cadell at
Westat, Inc. (Rockville, Md.), and Julie Buckland at Information
Man-agement Services for their dedication and support in the completion of
this 10-year study.
Phil Castle was supported by a Cancer Prevention Fellowship from
the Office of Preventive Oncology at the National Cancer Institute.
Attila Lorincz is the Chief Scientific Officer of Digene and holds
Digene stock and stock options. David Scott and Robert Burk hold
Digene stock. This study was supported by a series of NCI contracts
with Kaiser Permanente in Portland, Oreg. Digene assumed the costs
of testing by hybrid capture assays, and the Cetus laboratory (M. M.
Manos) PCR assays were supported by the Cetus Corporation.
REFERENCES
1. Bosch, F. X., M. M. Manos, N. Munoz, M. Sherman, A. M. Jansen, J. Peto, M. H. Schiffman, V. Moreno, R. Kurman, and K. V. Shah.1995. Prevalence of human papillomavirus in cervical cancer: a worldwide perspective. Inter-national Biological Study on Cervical Cancer (IBSCC) Study Group. J. Natl. Cancer Inst.87:796–802.
2. Bozzetti, M., B. Nonnenmacher, I. I. Mielzinska, L. Villa, A. Lorincz, V. V. Breitenbach, and J. Prolla.2000. Comparison between hybrid capture II and
polymerase chain reaction results among women at low risk for cervical cancer. Ann. Epidemiol.10:466.
3. Castle, P. E., M. Schiffman, R. D. Burk, A. Hildesheim, R. Herrero, M. C. Bratti, M. E. Sherman, J. E. Schussler, and A. T. Lorincz.2002. Restricted cross-reactivity of hybrid capture 2 Test with low-risk human papillomavirus types. Cancer Epidemiol. Biomark. Prev.11:1394–1399.
4. Clavel, C., M. Masure, I. Putaud, K. Thomas, J. P. Bory, R. Gabriel, C. Quereux, and P. Birembaut.1998. Hybrid capture II, a new sensitive test for human papillomavirus detection. Comparison with hybrid capture I and PCR results in cervical lesions. J. Clin. Pathol.51:737–740.
5. Goldie, S. J., L. Kuhn, L. Denny, A. Pollack, and T. C. Wright.2001. Policy analysis of cervical cancer screening strategies in low-resource settings: clin-ical benefits and cost-effectiveness. JAMA285:3107–3115.
6. Herrero, R., A. Hildesheim, C., S Bratti, M. E. herman, M. Hutchinson, J. Morales, I. Balmaceda, M. D. Greenberg, M. Alfaro, R. D. Burk, S. Wacholder, M. Plummer, and M. Schiffman.2000. Population-based study of human papillomavirus infection and cervical neoplasia in rural Costa Rica. J. Natl. Cancer Inst.92:464–474.
7. Liaw, K. L., A. G. Glass, M. M. Manos, C. E. Greer, D. R. Scott, M. Sherman, R. Burk, R. J. Kurman, S. Wacholder, B. B. Rush, D. M. Cadell, P. Lawler, D. Tabor, and M. Schiffman.1999. Detection of human papillomavirus DNA in cytologically normal women and subsequent cervical squamous intraepi-thelial lesions. J. Natl. Cancer Inst.91:954–960.
8. Lorincz, A., and J. Anthony.2001. hybrid capture method of detection of human papillomavirus DNA in clinical specimens. Papillomavirus Rep.12:
145–154.
9. Munoz, N., F. X. Bosch, de Sanjose, S., R. Herrero, X. Castellsague, K. V. Shah, P. J. Snijders, and C. J. Meijer, and the International Agency for Research on Cancer Multicenter Cervical Cancer Study Group.2003. Hu-man papillomavirus and cancer: the epidemiological evidence. N. Engl. J. Med.348:518–527.
10. Peyton, C. L., M. Schiffman, A. T. Lorincz, et al.1998. Comparison of PCR-and hybrid capture-based human papillomavirus detection systems with mul-tiple cervical specimen collection strategies. J. Clin. Microbiol.36:3248– 3254.
11. Schiffman, M. H., H. M. Bauer, R. N. Hoover, et al.1993. Epidemiologic evidence showing that human papillomavirus infection causes most cervical intraepithelial neoplasia. J. Natl. Cancer Inst.85:958–964.
12. Schiffman, M., R. Herrero, A. Hildesheim, M. E. Sherman, M. Bratti, S. Wacholder, M. Alfaro, M. Hutchinson, J. Morales, M. D. Greenberg, and A. T. Lorincz.2000. HPV DNA testing in cervical cancer screening: results from women in a high risk providence of Costa Rica. JAMA283:87–93. 13. Sherman, M. E., A. T. Lorincz, D. R. Scott, S. Wacholder, P. E. Castle, A. G.
Glass, I. Mielzynska, B. B. Rush, and M. Schiffman.2003. Cytology and human papillomavirus testing to determine risk for cervical neoplasia: a ten-year cohort analysis of 20,810 women. J. Natl. Cancer Inst.95:46–52. 14. Skendzel, L. P., and W. J. Youden.1970. Systematic versus random error in
laboratory surveys. Am. J. Clin. Pathol.54:448–450.
15. Solomon, D., D. Davey, R. Kurman, A. Moriarty, D. O’Connor, M. Prey, S. Raab, M. Sherman, D. Wilbur, T. Wright, Jr., N. Young and the Forum Group Members; The Bethesda 2001 Workshop.2002. The 2001 Bethesda System: terminology for reporting results of cervical cytology. JAMA287:
2114–2119.
16. Solomon, D., M. Schiffman, R. Tarone, and the ALTS Study Group.2001. Comparison of three management strategies for patients with atypical squa-mous cells of undetermined significance: enrollment results from a random-ized trial. J. Natl. Cancer Inst.93:293–299.
17. Terry, G., L. Ho, P. Londesborough, J. Cuzick, I. Mielzynska-Lohnas, and A. Lorincz.2001. Detection of high risk HPV types by the hybrid capture 2 test. J. Med. Virol.65:155–162.
18. Walboomers, J. M., M. V. Jacobs, M. M. Manos, F. X. Bosch, J. A. Kummer, K. V. Shah, P. J. Snijders, J. Peto, C. J. Meijer, and N. Munoz.1999. Human papillomavirus is a necessary cause of invasive cervical cancer worldwide. J. Pathol.189:12–19.
19. Wright, T. C., Jr., J. T. Cox, L. S. Massad, L. B. Twiggs, E. J. Wilkinson, and the ASCCP-Sponsored Consensus Conference.2002. 2001 consensus guide-lines for the management of women with cervical cytological abnormalities. JAMA287:2120–2129.
[image:9.603.46.283.90.378.2]20. Zweig, M. H., and G. Campbell.1993. Receiver-operating characteristic (ROC) plots. Clin. Chem.39:561–577.
TABLE A2. Cross-reactivity of HC2 and HC3 with single
nononcogenic HPV infections as identified by MY09/11 PCR
aHPV type
No. of tests with result:
HC2⫹ HC3⫹ HC2HC3⫺⫺/ HC2HC3⫺⫹/ HC2HC3⫹⫺/ HC2HC3⫹⫹/
2
0
0
0
0
0
0
6
4
2
3
0
2
2
11
0
0
4
0
0
0
13
0
0
0
0
0
0
26
0
0
0
0
0
0
32
0
0
0
0
0
0
40
0
0
3
0
0
0
42
1
0
4
0
1
0
53
20
4
22
3
19
1
54
3
1
12
1
3
0
55
0
0
9
0
0
0
61
0
0
10
0
0
0
66
7
1
2
0
6
1
67
0
0
0
0
0
0
69
0
0
0
0
0
0
70
1
0
0
0
1
0
71
0
0
1
0
0
0
72
0
0
1
0
0
0
73
3
3
7
0
0
3
74
0
0
0
0
0
0
81
0
0
1
0
0
0
82
3
2
0
1
2
1
83
1
0
14
0
1
0
84
3
2
9
0
1
2
85
0
0
0
0
0
0
82v
2
1
0
0
1
1
AE6
2
0
0
0
2
0
aSee Table A1, footnoteafor further details.
![TABLE 5. Association of CIN3� (odds ratios [OR] and 95% CI) with the HPV types listed for Tables 3 and 4 as detected by thethree methods](https://thumb-us.123doks.com/thumbv2/123dok_us/8243421.831529/5.603.43.539.621.690/table-association-ratios-listed-tables-detected-thethree-methods.webp)