http://dx.doi.org/10.4236/ojas.2014.44023
How to cite this paper: Salawu, E.O., Abdulraheem, M., Shoyombo, A., Adepeju, A., Davies, S., Akinsola, O. and Nwagu, B. (2014) Using Artificial Neural Network to Predict Body Weights of Rabbits. Open Journal of Animal Sciences, 4, 182-186. http://dx.doi.org/10.4236/ojas.2014.44023
Using Artificial Neural Network to Predict
Body Weights of Rabbits
Emmanuel O. Salawu
1,2,3*, Musa Abdulraheem
4, Ayoola Shoyombo
5, Ayo Adepeju
6,
Sunday Davies
7, Oludayo Akinsola
5*, Barthlomew Nwagu
81Life Science College, National Tsing Hua University, Hsinchu, Taiwan 2Institute of Information Sciences, Academia Sinica, Taipei, Taiwan 3School of Computer Science, University of Hertfordshire, Hertfordshire, UK
4Department of Animal Science, Faculty of Agriculture, Kogi State University, Ayangba, Nigeria 5Department of Animal Science, Faculty of Agriculture, Ahmadu Bello University, Zaria, Nigeria 6Department of Mathematics, Lagos State University, Lagos, Nigeria
7Institute of Ecology and Environmental Studies, Obafemi Awolowo University, Ife, Nigeria 8National Animal Production Research Institute, Shika, Nigeria
Email: *[email protected], *[email protected]
Received 12 May 2014; revised 25 June 2014; accepted 9 July 2014
Copyright © 2014 by authors and Scientific Research Publishing Inc.
This work is licensed under the Creative Commons Attribution International License (CC BY). http://creativecommons.org/licenses/by/4.0/
Abstract
In this (modest) study, we developed artificial neural network (ANN) models for predicting body weight using various independent (input) variables in eight-week old New Zealand white pure-bred and crosspure-bred rabbits. From the whole data sets of similar age groups, 75 percent were used to train the neural network model and 25 percent were used to test the effectiveness of the model. Five predictor variables were used viz, breed, sex, heart girth, body length and height at wither as input variables and body weight was considered as dependent variable from the model. The ANN used was multilayer feed forward network with back propagation of error for efficient learning. Our ANN models (with R2 = 0.68 at ten thousand iterations, and R2 = 0.71 one million iterations) performed better than traditional multivariate linear regression (MLR) models (R2 = 0.66) indi-cating that the ANN models were able to more accurately capture how the variations in input va-riables explained the variations in body weight. It is concluded that ANN models are more power-ful than MLR models in predicting animals’ body weight. Nonetheless, we recognize that fitting an ANN model requires more computation resources than fitting a tradition MLR model but the bene-fits of its accuracy outweigh any demerit from the associated computation overhead.
Keywords
Artificial Neural Network, New Zealand Rabbits, Multivariate Linear Regression
1. Introduction
Traditional statistical prediction and classification methods (such as linear regression, logistic regression, prin-cipal component analysis, discriminant analysis, k-nearest neighbor classification, etc.) have a number of limita-tions (such as the assumplimita-tions upon which they are based [1]) and results from them are often not the best poss-ible. Artificial neural networks (ANNs), on the other hand, adapt to changes in non-restricted manners and are based on much fewer assumptions. ANNs provide a single tool for solving many problems in which traditionally statistical methods can or cannot provide acceptable solutions for. ANNs have been applied to a huge amount of fields in the past years [2]. However, the number of the use of ANNs is still few in animal science (and a num-ber of other fields). This limited use of ANN in animal science is paradoxical as data analyses are often done in this field despite that a few studies [3], etc. have shown ANNs to be more powerful than most traditional statis-tical prediction methods. Unlike traditional statisstatis-tical methods, ANNs attempt to solve problems through explicit learning [4] [5]. This often makes it more computationally intensive. However, its strengths transcend this mild limitation and we were excited by the results we obtained from using ANN models in this study.
2. Materials and Methods
2.1. Study Location and Experimental Animals
We used 144 F1 eight-week-old rabbits (74 New Zealand White purebred and 70 New Zealand White × Califor-nia rabbits, crossbred in rabbit unit of National Animal Production Research Institute (NAPRI), Shika, Kaduna State, Nigeria) in this study. The animals were intensively managed under air conditioned building to minimize heat stress. They were fed a pelletized diet in the mornings and green grasses such as guinea grass (Panicum maximum) were given in the evenings.
2.2. Body Parts Measured
Body weight was taken by digital weighing scale (Mettler Toledo, Top Pan Sensitive Balance, J. Liang Int. Ltd. UK). The measurements were taken while the animals were held in a standing position. Three biometric traits were determined using a tape measure on each animal. The anatomical reference points were in accordance with standard zoometrical procedures [6]. The body components measured were:
Body length (BL): Diagonal distance from the points of shoulder to points of hip or first thoracic vertebrae to base of tail or to hip bone. This is also described as the distance between the most cranial palpable spinosus process of the thoracic vertebrae and either sciatic tubers or distance between the tops of the pelvic bone.
Heart girth (HG): This refers to the body circumference and was measured just behind the fore-legs. Height at withers (HW): This was taken using a graduated measuring stick.
All biometric traits were measured in centimetres.
2.3. Forecasting/Prediction Model
We implemented a three-layer ANN with backpropagation in Python programming language (Figure 1). The input layer had five nodes—Breed, Sex, HG, BL, and HW; and the output layer had one node—body weight, while the hidden layer was made to contain five nodes (for simplicity and easy training of the model). We did not include age in the model since the animals were of the same age (8 weeks).
The entire dataset was randomly divided into two subset viz, the training set (consisting of 75 percent of the entire dataset) and testing subset (comprising of 25 percent of the entire dataset). The network was tested in 1 and 2 hidden layers with 3 to 25 neurons in each hidden layer. Initial weights and bias matrix were randomly in-itialized between −1 to 1. A nonlinear transformation (or activation) function tangent sigmoid (Equation (1)) were used to compute the output from summation of weighted inputs of neurons in each hidden layer. A pure li-near transformation functions were used as output layer for getting network response.
( ) 1
1 x
αx
f =
+ e−
Figure 1. Neural network showing input nodes (breed, sex, HG, BL, and HW) at the input layer, hidden nodes at the hidden layer, and output node (body weight) at the output layer.
To have a fine training of the artificial neural network model, we set the learning rate to as low as 0.005 and the momentum factor to as low as 0.001. We first ran 10 thousand iterations of training, using the obtained model (i.e. the neural network weights) for predicting the body weights, and saved the results. For the sake of comparison, we fitted a multivariate linear regression (MLR) model (and made sure the model passed various model diagnoses such as normal distribution of regression residuals shown in Figure 1) after we confirmed that the model is statistically significant at p < 0.0001 (see Table 1). We then compared the results from the artificial neural network with that of the fitted multivariate linear regression model. The results were encouraging. Therefore, we went further to run one million iterations of training to further improve the ANN’s weights. R2
was determined using the following stated formula:
2
exp 2
1 exp2
1 N cal Q Q R = Q − −
∑
Qexp = Observed value. Qcal = Predicted value. N = Number of observation.
3. Result and Discussions
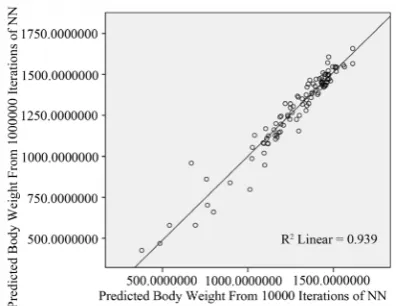
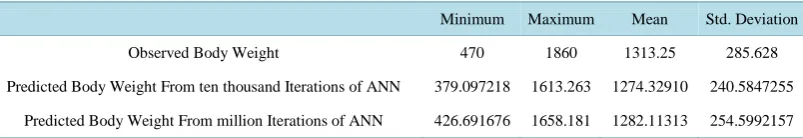
We show the summary statistics of the observed weights and the predicted weights at ten thousand, and at one million training iterations of the ANN in Table 1. Exact figures (un-summarized statistics) are presented in Ta-ble 2 in the supplementary material. Correlation (Pearson correlation) between the observed weights and the predicted weights at ten thousand, and at one million training iterations of the ANN are shown in Table 2; and correlation between the predicted weights at ten thousand, and the predicted weights at one million training ite-rations of the ANN are shown in Table 3.
Figure 2. ANN satisfactorily (R2= 0.679) predicted the observed weight after ten thousand training iterations.
Figure 3. This figure shows how well the ANN predicted the observed weight after one million training iterations. Note that the R2(0.71) shows an improvement over ten thousand training iterations (shown in Figure 2).
[image:4.595.200.399.510.663.2]Table 1. Summary statistics of the observed weights and the predicted weights at ten thousand, and at one million training iterations of the ANN.
Minimum Maximum Mean Std. Deviation
Observed Body Weight 470 1860 1313.25 285.628
Predicted Body Weight From ten thousand Iterations of ANN 379.097218 1613.263 1274.32910 240.5847255
Predicted Body Weight From million Iterations of ANN 426.691676 1658.181 1282.11313 254.5992157
Table 2. Comparison of ANN (at ten thousand, and at one million training iterations) and MLR of the observed weights and predicted weights.
MLR ANN after 10,000 training iterations ANN after 1,000,000 training iterations
Coefficient of determination (R2) 0.659 0.679 0.710
Pearson correlation between observed and predicted weights 0.812
*** 0.824*** 0.843***
Prediction sum of squares 5536677.167 5833084.503 6309725.164
[image:5.595.100.502.111.180.2]*** p < 0.001.
Table 3.Pearson correlation between the predicted weights at ten thousand, and the predicted weights at one mil-lion training iterations of the ANN.
Predicted body weight from one million iterations of ANN
Predicted body weight from ten thousand iterations of ANN
Pearson correlation 0.969***
Sum of squares and cross-products 6114879.253
Covariance 59367.760
*** p < 0.001.
4. Conclusion
Overall, our artificial neural network (even with just ten thousand iterations) considerably outperforms a multi-variate linear regression model (Table 2). Hence, we conclude that ANN is more robust and could be used in predicting the bodyweights of animals more accurately than MLR.
References
[1] Myers, J.L., Well, A.D. and Lorch, R.F. (2010) Research Design and Statistical Analysis. Routledge, London.
[2] Ay, N., Flack, J. and Krakauer D.C. (2007) Robustness and Complexity Co-Constructed in Multimodal Signaling Networks. Philosophical Transactions of the Royal Society B, 362, 441-447. http://dx.doi.org/10.1098/rstb.2006.1971 [3] Gandhi, R.S., Raja, T.V., Ruhil, A.P. and Kumar, A. (2010). Artificial Neural Network versus Multiple Regression
Analysis for Prediction of Lifetime Milk Production in Sahiwal Cattle. Journal of Applied Animal Research, 38, 233-237. http://www.tandfonline.com/doi/abs/10.1080/09712119.2010.10539517#.U71h6x_vZ9s
[4] Hill, T., Marquez, L., O’Connor, M. and Remus, W. (1994) Artificial Neural Network Models for Forecasting and De- cision Making. International Journal of Forecasting, 10, 5-15. http://dx.doi.org/10.1016/0169-2070(94)90045-0 [5] Tadeusiewicz, R. (1993) Neural Networks. AOW, Warsaw.
[6] Teguia, A., Ngandjou, H.M., Defang, S. and Tchoumboue, T. (2008) Study of the Live Body Weight and Body Cha- racteristics of the African Muscovy Duck (Cairina moschata). Tropical Animal Health Production, 40, 5-10.
http://dx.doi.org/10.1007/s11250-007-9030-4
currently publishing more than 200 open access, online, peer-reviewed journals covering a wide range of academic disciplines. SCIRP serves the worldwide academic communities and contributes to the progress and application of science with its publication.
Other selected journals from SCIRP are listed as below. Submit your manuscript to us via either