Copyright © 2001, American Society for Microbiology. All Rights Reserved.
Identification of
Enterococcus, Streptococcus
, and
Staphylococcus
by
Multivariate Analysis of Proton Magnetic Resonance
Spectroscopic Data from Plate Cultures
ROGER BOURNE,1UWE HIMMELREICH,1ANSUIYA SHARMA,2 CAROLYN MOUNTFORD,1ANDTANIA SORRELL1,3*
Institute for Magnetic Resonance Research and Department of Magnetic Resonance in Medicine, University of Sydney,
St Leonards 2065,1and Centre for Infectious Diseases and Microbiology (CIDM) Laboratory Services, Institute for
Clinical Pathology and Medical Research,2and CIDM,3University of Sydney at Westmead Hospital,
Sydney 2145, Australia
Received 14 February 2001/Returned for modification 22 April 2001/Accepted 26 May 2001
A new fingerprinting technique with the potential for rapid identification of bacteria was developed by combining proton magnetic resonance spectroscopy (1H MRS) with multivariate statistical analysis. This resulted in an objective identification strategy for common clinical isolates belonging to the bacterial species Staphylococcus aureus, Staphylococcus epidermidis, Enterococcus faecalis, Streptococcus pneumoniae, Streptococcus pyogenes, Streptococcus agalactiae, and theStreptococcus millerigroup. Duplicate cultures of 104 different isolates were examined one or more times using1H MRS. A total of 312 cultures were examined. An optimized classifier was developed using a bootstrapping process and a seven-group linear discriminant analysis to provide ob-jective classification of the spectra. Identification of isolates was based on consistent high-probability classi-fication of spectra from duplicate cultures and achieved 92% agreement with conventional methods of iden-tification. Fewer than 1% of isolates were identified incorrectly. Identification of the remaining 7% of isolates was defined as indeterminate.
In both clinical and industrial laboratories, methods for identification of microorganisms have historically been based on multiple phenotypic characters, including morphological features and a range of biochemical reactions. These tests are often time-consuming and/or relatively expensive in their ap-plication, and some are imprecise. Recently, alternative meth-ods have been investigated in an attempt to develop a single, rapid method for characterization and identification of micro-organisms. These have included Fourier transform infrared spectroscopy (11, 14), pyrolysis mass spectrometry (12), elec-trospray ionization mass spectrometry (7), UV resonance Ra-man spectroscopy (15), and protein electrophoresis (16). While reports of these techniques suggest the possibility of rapid and reliable identification of some groups of microor-ganisms, most have been tested with small data sets. With the exception of Fourier transform infrared spectroscopy, they are destructive techniques which analyze cellular decomposition products. All have the limitation that they do not directly yield information about the biochemistry of the intact viable organ-ism.
In contrast, magnetic resonance spectroscopy (MRS) of vi-able cells can provide information on a large range of metab-olites. Biological applications of MRS most commonly exploit the noninvasive nature of the technique to study aspects of cellular biochemistry in living systems (6). However, not all applications of MRS require or include identification of the
metabolites contributing to the MR spectrum. Pattern recog-nition techniques, which detect gross spectral characteristics associated with a priori-defined classes (such as pathological conditions), have been successfully applied to MRS of both tissues and body fluids. Accurate and reliable classifiers based on multivariate analyses of 1H MR spectroscopic data have been developed and validated for objective diagnosis of thyroid (21), ovarian (22), prostate (9), breast (13), and brain (20) tumors. In some pathologies, MRS is able to detect malignancy before morphological manifestations are visible by light mi-croscopy (17).
A one-dimensional1H MR spectrum of a bacterial cell sus-pension provides an overview of hydrogen-containing com-pounds that are tumbling rapidly on the MR timescale. Con-sequently, the1H MR spectrum will be more representative of the physiology of the cell (metabolite pools) than of its struc-ture (comprising immobile components such as the cell wall). While many different bacterial groups may express and utilize essentially identical metabolic pathways, it might reasonably be expected that differing levels of enzyme expression and activity in different groups would give rise to distinctly different levels of particular metabolites when dissimilar groups are grown in similar environments. We therefore proposed that significantly different metabolite pool sizes would be detected as differences between the1H MR spectra of the different bacterial groups. This was suggested in a previous study comparing selected bacterial 1H MR spectra (5); however, the small number of isolates examined and the qualitative identification methods described in that study did not permit automation or quanti-tative comparison of the species groups.
We show here that it is possible, using simple linear discrimi-nant analysis (LDA) on 312 cultures of 104 different isolates, to * Corresponding author. Mailing address: Centre for Infectious
Dis-eases and Microbiology, The University of Sydney at Westmead Hos-pital, Rm. 3114, Level 3, ICPMR, Westmead HosHos-pital, Darcy Rd., Westmead, New South Wales 2145, Australia. Phone: 61-2-9845-6012. Fax: 61-2-9891-5317. E-mail: [email protected].
2916
on May 15, 2020 by guest
http://jcm.asm.org/
make reliable automated identifications of bacteria on the ba-sis of their1H MR spectra.
MATERIALS AND METHODS
Storage and culture of bacteria.Isolates were obtained from the collection of the Centre for Infectious Diseases and Microbiology Laboratory Services, Insti-tute of Clinical Pathology and Medical Research, Sydney, Australia and the American Type Culture Collection, or were recent clinical isolates from the clinical identification laboratory of the Centre for Infectious Diseases and Mi-crobiology Laboratory Services. Stored isolates were suspended in 10% glycerol in nutrient broth at⫺70°C. Horse blood agar (HBA) was prepared by addition of sterile horse blood to autoclaved blood agar base (Oxoid, Basingstoke, United Kingdom or Amyl Media, Sydney, Australia). Isolates retrieved from storage were subcultured onto 5% horse blood agar and incubated in 5% CO2for 18 to 24 h at 37°C. New isolates and isolates subcultured on HBA after storage were streaked onto duplicate HBA plates, incubated at 37°C for 18 to 24 h, and then stored at ambient temperature (20 to 30°C) for 3 to 9 h before being subjected to spectroscopy.
To test for short-term method variability, we examined duplicate cultures of all isolates. To test for long-term culture and method variability, we recultured a number of isolates up to six times over an 8-month period. Included in the analysis were spectra of three isolates ofEnterococcus gallinarumand three isolates ofE. casseliflavus, which are closely related toE. faecalis(10) (Table 1). The number of distinct isolates examined from each species group and the number of times the isolate was recultured and reexamined can be determined from Table 1.
Conventional identification of bacteria.Staphylococcus aureuswas identified on the basis of positive coagulase (using rabbit or human plasma) and DNase tests.Staphylococcus epidermidiswas identified using the API ID32 staph test (BioMe´rieux, Marcy l’Etoile, France).StreptococcusandEnterococcusspecies were identified by conventional methods, i.e., optochin sensitivity (Streptococcus pneumoniae), salt tolerance and bile-esculin positivity (Enterococcusspp.), latex agglutination (Streptococcus agalactiae), and by the API ID32 strep test (Bio-Me´rieux). All tests were carried out as specified by the manufacturers. In general, isolates were identified only once, upon receipt in the microbiology laboratory and prior to storage. Some isolates retrieved from storage were reidentified by conventional tests.
1H MRS.Bacterial colonies (2 to 200 mg [wet weight]) were gently removed
from the HBA plate with a plastic inoculating loop and suspended by vortexing in 0.3 ml of phosphate-buffered saline (pH 7.2, room temperature) made up in D2O (PBS-D2O). For most cultures,⬎80% of cells were scraped off the plate. In cases of heavy growth, ⬍10% of cells were harvested, usually from the first quadrant. The suspension was immediately transferred to a 5-mm-diameter susceptibility-matched MR sample tube (Shigemi).1H MRS measurements were performed at 37°C on a Bruker Avance 360 MHz MR spectrometer using a 1H/13C 5-mm probe head. One-dimensional (1D) spectra were acquired with
acquisition parameters as follows: frequency, 360.13 MHz; pulse angle, 90° (6 to 7s), repetition time, 1s; 8k data points, 256 or 512 transients; spectral width, 3600 Hz; total acquisition time, 10 or 20 min. The field was locked to D2O. Water suppression was effected by a selective excitation field gradient method (double-pulsed field gradient spin echo [DPFGSE]) (3). The spectra of cells suspended in PBS-D2O were stable for at least 2 h at 37°C.
Signal assignment.2D homo- and heteronuclear correlation spectra were acquired for at least two isolates per species to assign 1D MR resonances to specific compounds. {1H,1H} gradient correlation spectroscopy (COSY) exper-iments were performed in magnitude mode. The acquisition parameters were as follows: sweep width int2, 3,600 Hz;t2time domain, 2K; 256 increments of 32 or 48 acquisitions each; repetition time, 1 s. Sine bell window functions were applied in thet1dimension, and Gaussian-Lorentzian window functions were applied in thet2dimension. Zero filling was used to expand the data matrix to 1K in thet1 dimension. Total correlation spectroscopy (TOCSY) spectra with mixing times of 40 and 150 ms were acquired with 256 increments of 2K data points and 32 acquisitions (1). {1H,13C} one-bond shift correlation spectra were obtained in the1H detection mode using a gradient heteronuclear single quantum coherence (HSQC) pulse sequence (23). The1H MR spectral width was 3,600 Hz, and the 13C MR spectral width was 15,000 Hz.13C MR decoupling during acquisition was
achieved by using globally optimized alternating phase rectangular pulses (GARP) (18). The evolution time (t1) was incremented to obtain 400 FIDs, each of 40 to 64 acquisitions and consisting of 2K data points. The repetition time was 1 s. A sine bell window function was applied in thet2dimension, and a Gaussian-Lorentzian function was applied in thet1dimension. Zero filling to 1 K was used in thet1dimension prior to Fourier transformation. {1H,13C} gradient
hetero-nuclear multiple-bond correlation (HMBC) spectra were acquired without pro-ton decoupling using the same parameters as for the HSQC experiments, except for a13C MR spectral width of 20 kHz (23). One-bond and long-range correla-tion experiments were usually optimized for1J
C,Hof 140 Hz andnJC,Hof 7 Hz, respectively. 1D1H MR spectra were acquired before and after the 2D experi-ments to verify absence of metabolic changes.
Data processing.Spectra were processed using BrukerXWINNMRspectrometer software. Zero filling was performed to extend the free induction decay data set to 16K. An exponential window function was applied before Fourier transfor-mation, yielding a line broadening of 1 Hz. Chemical shift calibration was performed by setting the center of the spectrum to 4.64 ppm (the nominal position of the water resonance with respect to tetramethylsilane in PBS-D2O at 37°C). Spectra were manually phase corrected to achieve a linear and flat base-line. Sixteen contiguous fixed integration regions were subjectively chosen on the basis of major peaks present in the representative spectra (see Fig. 1). The individual integrals were normalized to the total intensity of the 16 integrals.
LDA.The table of integrals was imported from Microsoft Excel intoSTATISTICA (StatSoft Pacific P/L) for LDA. Each of the first 15 of 16 chosen integral regions (see Results) formed one independent variable in the seven-group LDA (stan-dard method, tolerance 0.01, a priori classification probability proportional to group size). The 16th region (arbitrary choice) was omitted from the LDA because, in a normalized data set, one region is redundant for discriminant analysis. Information from the omitted region is “embedded” in the remaining regions. Classification functions and classification probabilities were calculated withSTATISTICA.
Classification of spectra and identification of isolates.In this paper we use the following definitions. The term “classification” refers to assignment of an indi-vidual spectrum from a bacterial culture to a species group. “Identification” refers to assignment of an isolate to a species group (on the basis of classification of two independent spectra derived from duplicate cultures of the isolate). “Correct classification” refers to assignment of a spectrum to the same species group as conventional classification with a percent classification probability of
ⱖ85%. The chosen percentage is arbitrary but is considered a reasonably high probability for confident assignment. “Misclassification” refers to assignment of a spectrum to a species group different from conventional classification with a percent classification probability ofⱖ85%. “Indeterminate classification” refers to assignment of a spectrum to any species group with percent classification probability of⬍85%. “Correct identification” refers to assignment of both spec-tra of duplicate cultures according to conventional identification and with an average percent classification probability ofⱖ85%. “Misidentification” refers to assignment of both spectra of duplicate cultures to the same species group but different from conventional identification and with an average percent classifi-cation probability ofⱖ85%. “Indeterminate identification” refers to assignment of spectra of duplicate cultures to different groups or the same group with an average classification probability of⬍85%.
An optimized seven-group classifier was developed based on the bootstrap method (2) modified and renamed the robust bootstrap method by Somorjai et al. (19). Starting with all 312 spectra, we randomly selected half the spectra from each species group and used this training set to train the seven-group classifier (LDA). The resulting classifier was then used to validate the remaining spectra (the test set). This process was repeatedBtimes (with replacement), and every time the optimized LDA coefficients were saved. The weighted average of these
Bsets of LDA coefficients produces the final classifier (B⫽1,000). The weight for themth set isWm⫽KmCm1/2(m⫽1,. . .,B), where 0ⱕCmⱕ1 is the crispness (defined as the fraction of test samples assigned to a class with a percent probability ofⱖ75%) and 0ⱕKmⱕ1 is Cohen’s chance-corrected measure of agreement (4), withKm⫽1 signifying the perfect classification of a test set. The weightsWmwere obtained not for the bootstrap training sets but for the less optimistic test sets. The optimized classifier was then used to classify all 312 spectra. Classifier outcome is reported as a normalized percent class prob-ability.
The Robust BootStrap classification software was written in-house usingSTA -TISTICA, MicrosoftEXCEL, and MicrosoftVISUAL BASIC FOR APPLICATIONSand run on a Pentium-based personal computer. TheVISUAL BASIC FOR APPLICATIONScode is available from the authors.
RESULTS
1H MR spectra.Representative spectra of each of the seven species groups and the 16 integration regions chosen for anal-ysis are shown in Fig. 1. Spectra of ATCC type strains are
on May 15, 2020 by guest
http://jcm.asm.org/
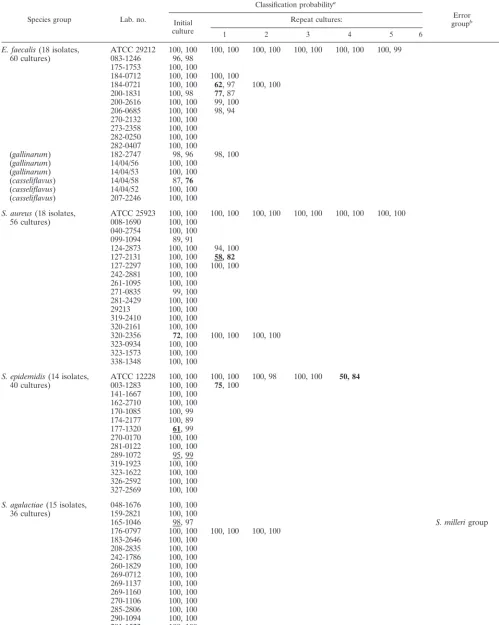
TABLE 1. Classification and identification results with optimized classifier
Species group Lab. no.
Classification probabilitya
Error
groupb resultIDc Initial
culture
Repeat cultures:
1 2 3 4 5 6
E. faecalis(18 isolates,
60 cultures) ATCC 29212083-1246 100, 10096, 98 100, 100 100, 100 100, 100 100, 100 100, 99 cc
175-1753 100, 100 c
184-0712 100, 100 100, 100 c
184-0721 100, 100 62, 97 100, 100 c
200-1831 100, 98 77, 87 i
200-2616 100, 100 99, 100 c
206-0685 100, 100 98, 94 c
270-2132 100, 100 c
273-2358 100, 100 c
282-0250 100, 100 c
282-0407 100, 100 c
(gallinarum) 182-2747 98, 96 98, 100 c
(gallinarum) 14/04/56 100, 100 c
(gallinarum) 14/04/53 100, 100 c
(casseliflavus) 14/04/58 87,76 i
(casseliflavus) 14/04/52 100, 100 c
(casseliflavus) 207-2246 100, 100 c
S. aureus(18 isolates,
56 cultures) ATCC 25923008-1690 100, 100100, 100 100, 100 100, 100 100, 100 100, 100 100, 100 cc
040-2754 100, 100 c
099-1094 89, 91 c
124-2873 100, 100 94, 100 c
127-2131 100, 100 58, 82 i
127-2297 100, 100 100, 100 c
242-2881 100, 100 c
261-1095 100, 100 c
271-0835 99, 100 c
281-2429 100, 100 c
29213 100, 100 c
319-2410 100, 100 c
320-2161 100, 100 c
320-2356 72, 100 100, 100 100, 100 c
323-0934 100, 100 c
323-1573 100, 100 c
338-1348 100, 100 c
S. epidemidis(14 isolates,
40 cultures) ATCC 12228003-1283 100, 100100, 100 100, 10075, 100 100, 98 100, 100 50, 84 ic
141-1667 100, 100 c
162-2710 100, 100 c
170-1085 100, 99 c
174-2177 100, 89 c
177-1320 61, 99 i
270-0170 100, 100 c
281-0122 100, 100 c
289-1072 95, 99 c
319-1923 100, 100 c
323-1622 100, 100 c
326-2592 100, 100 c
327-2569 100, 100 c
S. agalactiae(15 isolates,
36 cultures) 048-1676159-2821 100, 100100, 100 cc
165-1046 98, 97 S. millerigroup i
176-0797 100, 100 100, 100 100, 100 c
183-2646 100, 100 c
208-2835 100, 100 c
242-1786 100, 100 c
260-1829 100, 100 c
269-0712 100, 100 c
269-1137 100, 100 c
269-1160 100, 100 c
270-1106 100, 100 c
285-2806 100, 100 c
290-1094 100, 100 c
291-1523 100, 100 c
S. milleri(group 11 isolates,
30 cultures) 073-0596097-1166 100, 100100, 100 cc Continued on following page
on May 15, 2020 by guest
http://jcm.asm.org/
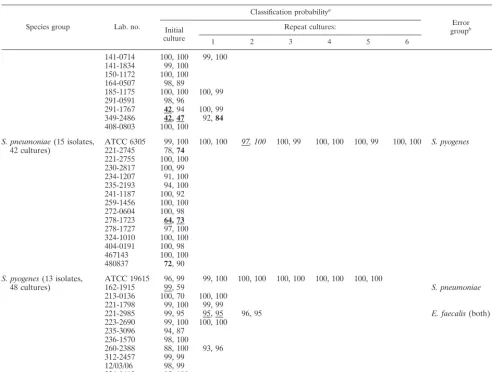
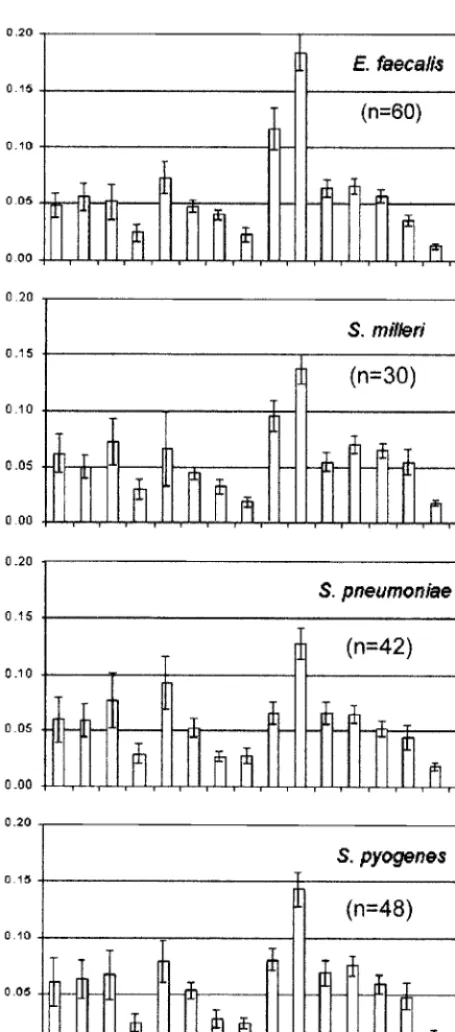
shown where available; otherwise spectra of isolates close to the group centroid (based on integral intensities) of all spectra are shown. The most significant contributing metabolites iden-tified for each integration region and used for the statistical analyses are listed in Table 2. Since it is not possible to show the range of spectral patterns found in the 30 to 60 spectra examined from each species group, we show in Fig. 2 the range of normalized integral intensities (mean⫾standard deviation SD) measured for each species group.
Classification of spectra and identification of isolates.The results of the classification of 312 spectra and identification of 104 isolates from the seven species groups based on the opti-mized classifier are shown in Table 1. A summary of results in terms of classification and identification performance is shown in Table 3. Less than 2% of spectra were misclassified, and less than 1% of isolates were misidentified. Nineteen spectra had a classification of indeterminate.
Reproducibility of spectra.Independent analysis of spectra from concurrent, duplicate cultures and of isolates retrieved
repeatedly from storage over a 1 to 8-month period confirmed that the classification method is robust and is not affected by short- or long-term procedural variability due to factors such as minor changes in culture conditions, number of organisms, or storage of isolates (Table 1).
DISCUSSION
1H MRS and selection of independent variables for
multi-variate analysis.Visible differences between typical spectra of some species are readily observed, as seen in Fig. 1. However, differences between spectra of species such asS. pyogenesand
S. pneumoniae are not obvious by visual inspection, and the
only possibility of reliably distinguishing between such similar groups lies in a multivariate analysis of the data. The initial step in such an analysis is the extraction from the spectra, which are composed of many thousands of data points, of a manageable set of independent variables in which any signifi-cant group differences are manifest. While sophisticated meth-TABLE 1—Continued
Species group Lab. no.
Classification probabilitya
Error
groupb resultIDc Initial
culture
Repeat cultures:
1 2 3 4 5 6
141-0714 100, 100 99, 100 c
141-1834 99, 100 c
150-1172 100, 100 c
164-0507 98, 89 c
185-1175 100, 100 100, 99 c
291-0591 98, 96 c
291-1767 42, 94 100, 99 i
349-2486 42, 47 92,84 i
408-0803 100, 100 c
S. pneumoniae(15 isolates,
42 cultures) ATCC 6305221-2745 99, 10078,74 100, 100 97, 100 100, 99 100, 100 100, 99 100, 100 S. pyogenes ic
221-2755 100, 100 c
230-2817 100, 99 c
234-1207 91, 100 c
235-2193 94, 100 c
241-1187 100, 92 c
259-1456 100, 100 c
272-0604 100, 98 c
278-1723 64, 73 i
278-1727 97, 100 c
324-1010 100, 100 c
404-0191 100, 98 c
467143 100, 100 c
480837 72, 90 c
S. pyogenes(13 isolates,
48 cultures) ATCC 19615162-1915 96, 9999, 59 99, 100 100, 100 100, 100 100, 100 100, 100 S. pneumoniae ci
213-0136 100, 70 100, 100 c
221-1798 99, 100 99, 99 c
221-2985 99, 95 95, 95 96, 95 E. faecalis(both) m
223-2690 99, 100 100, 100 c
235-3096 94, 87 c
236-1570 98, 100 c
260-2388 88, 100 93, 96 c
312-2457 99, 99 c
12/03/06 98, 99 c
326-0413 95, 100 c
3-61-70 89, 90 c
aNumbers show percent classification probabilities for each spectrum of duplicate cultures. Classification probabilities less than 85% are shown in bold typeface. Misclassifications are underlined.
bThe error group is the species to which a spectrum was incorrectly assigned. cIsolate identification result. c, correct, i, indeterminate; m, misidentification.
on May 15, 2020 by guest
http://jcm.asm.org/
[image:4.612.54.547.83.455.2]ods have been described for the selection of optimally discrim-inating spectral regions (21), we chose a simple division of all spectra into 16 contiguous regions visually selected on the basis of peaks present in the spectra illustrated in Fig. 1. The ad-vantage of this procedure is that the resultant independent variables may be assigned a specific biochemical significance (i.e., an independent variable may be associated with a partic-ular metabolite or group of metabolites) if the metabolites contributing to the signal in each integration region can be identified. Although we have identified in Table 2 some of the major metabolites contributing to the spectra in Fig. 1, the bacterial identification method applied here does not depend on identification or quantitation of the metabolites contribut-ing to the MR signal. It is, however, important to note that the measured cellular characteristics on which the classification is based are substantially different from those detected during routine identification and are also different from those mea-sured by other whole-organism fingerprinting techniques. It was not our intention in this study to identify metabolites which distinguish the species groups or to construct
dendro-grams of group relationships. These will be addressed in a separate report.
Classification and identification strategy. Classification based on LDA requires that a set of functions derived by LDA of a training set of data be used to classify a test set of data, which is preferably independent of the training set (cross-validation). The function of the training set is to describe, in terms of then independent variables derived from the MR spectra, the region ofn-dimensional data space occupied by each of the a priori defined groups. If the defined groups in the training set are well separated in data space, the LDA will produce classification functions which assign every member of the training set to its a priori defined group. The region of data space associated with a particular group will increase with phenotype variation between the members of a particular spe-cies group and also with procedural (environmental, biochem-ical, and methodological) variations associated with repeated culture and classification of spectra of a specific member of a group. A training set comprising only a small number of ran-domly selected members of a particular group is therefore FIG. 1. (A) Representative1H MR spectra ofE. faecalis, S. milleri, S. pneumoniae, andS. pyogenesisolates. Refer to Table 2 for the identity
of the major metabolites contributing to the spectra in each integration region. (B) Representative1H MR spectra ofS. epidermidis, S. aureus, and S. agalactiae isolates.The intense betaine peaks in the spectra ofS. aureusandS. epidermidisand the glycerol phosphocholine (GPC) peak ofS. agalactiaehave been truncated to show details of the less intense peaks. The relative intensities of the betaine and glycerol phosphocholine peaks can be seen in Fig. 2. Refer to Table 2 for the identity of the major metabolites contributing to the spectra in each integration region.
on May 15, 2020 by guest
http://jcm.asm.org/
[image:5.612.59.551.71.426.2]unlikely to accurately represent the data space (phenotype range) occupied by all members of that species group. If the training set contains only a single measurement of each isolate member, it may also not account for procedural variability. Consequently, it is to be expected that some misclassifications will occur when a classification function based on a training subset of a group is used to classify group members which are not members of the training set.
For classifier robustness and reliability, it is desirable that the number of spectra per species group in the training set be 5 to 10 times larger than the number of independent variables (19). Such large data sets are rare in the published literature and usually difficult to acquire, especially if the derived classi-fier is to be validated against a test set independent of the training set. The Robust BootStrap method attenuates this problem by allowing cross-validated classifier development with all of the available data (19).
In an attempt to reduce the number of independent vari-ables, we applied the forward stepwise method of seven-group LDA and limited the number of independent variables. There was a progressive decrease in overall classification accuracy as the number of independent variables was decreased. In contrast, pairwise LDA between any of the species groups required only two to four independent variables for 100% dis-crimination between any pair of species groups. We are pres-ently developing software to classify multiple groups based on a set of classifiers derived from pairwise LDA.
The ease of preparation and examination of duplicate or even triplicate cultures of a particular clinical isolate, as used in this study, has the advantage that a consensus identification of the isolate based on multiple independent analyses is obtained. This feature of our isolate identification strategy has not been applied in other microbial whole-organism fingerprinting stud-ies (5, 8), in which, at best, only instrument duplicates were acquired. We have demonstrated that in a few cases the du-plicates may be classified as different species. Consequently, identification based on analysis of a single subculture of an
isolate cannot be assigned the same confidence level as an identification based on classification of independent duplicate cultures. When using conventional methods, which report an identification probability based on analysis of a single culture of an isolate, it is common practice to reexamine isolates for which the identification probability is⬍85%. Analysis is re-peated until a single test returns an identification probability of
⬎85%. By this method, it is possible that the average identi-fication probability of all tests on an isolate will be⬍85% at the conclusion of testing. Our method of testing duplicate cultures and requiring that correct identification be based on an aver-age probability of⬎85% imposes a more rigorous and reliable identification constraint than would be the case with single cultures. However, in Table 3 it can be seen that the accuracy of identification based on classification of spectra from single cultures would, in fact, have been similar to that based on duplicate cultures.
Phenotypic variability within species groups was addressed by examination of at least 11 isolates from each species group. The general success of the classification method used indicates that between the species groups there are significant and con-sistent spectral differences, which are larger than the typical range of variation within species due to procedure or pheno-type.
Classification and identification results. The very small number of misclassifications of spectra could not be attributed to any specific steps of the method. Potential problems with reproducibility due to short- and long-term procedural vari-ability (use of different batches of culture medium, storage of isolates, etc.) were excluded by undertaking (i) separate anal-ysis of spectra from duplicate cultures of all isolates and (ii) repeated culture of 25 isolates, at times up to 8 months after original culture and spectroscopy. The single instance of mis-identification (S. pyogenesLab. No. 221-2985) may have been the result of contamination.
We did not examine a sufficient number of isolates in theS.
milleri group to attempt an MRS-based assignment of the
isolates to one of the three species within the group (S.
angi-nosus, S. constellatus, andS. intermedius). However, our results
[image:6.612.55.293.90.277.2]demonstrate that on the basis of the nonroutine metabolites measured, the group is physiologically homogeneous relative to the diversity of the seven species groups examined. Al-though not surprising, this result is consistent with group sim-ilarities defined by other biochemical tests. Similarly, our data confirm that the E. casseliflavus and E. gallinarum isolates TABLE 2. Integral regions and most significant
contributing metabolites
Region Range(ppm) Metabolites with resonancesin regiona
1 4.00–3.81 AA, betaine, GPC, GPE, EA 2 3.81–3.70 AA, glycerol, G3P
3 3.70–3.50 AA, GPC, glycine, choline, inositol 4 3.50–3.34 Taurine, GPE, tryptophan
5 3.34–3.10 Histidine, tyrosine, taurine, phenylalanine, betaine, GPC, choline, inositol, PA, EA 6 3.10–2.88 Lysine, histidine, tyrosine, asparagine, PA 7 2.88–2.61 Aspartate, asparagine, methionine 8 2.61–2.42 Succinate
9 2.42–2.22 Valine, glutamine, glutamate, succinate 10 2.22–1.95 Isoleucine, glutamine, glutamate,
methio-nine, PA, N-acetyl compounds 11 1.95–1.80 Acetate, lysine, isoleucine 12 1.80–1.58 Leucine, lysine
13 1.58–1.40 Lysine, alanine
14 1.40–1.23 Lactate, isoleucine, threonine 15 1.23–1.08 None identified
16 1.08–0.75 Valine, leucine, isoleucine
aAbbreviations: AA, amino acid (nonspecific); PA, polyamine; GPC, glycerol phosphocholine; GPE, glycerol phosphoethanolamine; EA, ethanolamine; G3P, glycerol-3-phosphate.
TABLE 3. Summary of classification and identification results
Classification or
identification type Count % of total
Classification type
Correct 288 92.3
Indeterminate 19 6.1
Misclassification 5 1.6
Total 312 100.0
Identification type
Correct 144 92.3
Indeterminate 11 7.1
Misidentification 1 0.6
Total 156 100.0
on May 15, 2020 by guest
http://jcm.asm.org/
[image:6.612.311.550.598.727.2]examined are physiologically more similar toE. faecalisthan to
theStreptococcusandStaphylococcusspecies tested.
Choice of growth medium.In selecting the most appropriate medium for use in a clinical diagnostic or reference laboratory, we reasoned that choice of a universal growth substrate and ease of sample preparation were of prime importance. Since HBA is a common medium in use in diagnostic microbiology laboratories in Australia and since bacterial cells could be easily harvested directly from HBA plates without the need for washing, we chose this growth medium as best satisfying our
objectives. It is of note that there were differences between our spectra and those published forS. aureusandE. faecalisgrown on Trypticase soy sheep blood agar (5). In the latter study, interpretation of spectral patterns was reportedly not affected by the choice of growth medium, possibly because spectral patterns were inspected visually and distinguished by peak positions rather than peak intensities. We found previously that growth on or in different media (HBA versus brain heart infusion broth) affected the relative peak intensities (due to changes in metabolite pool sizes) much more significantly than it affected peak positions, which may be slightly affected by factors such as intracellular pH (R. Bourne, unpublished data). These differences suggest that the analysis is dependent on the constraint that all cultures must be grown on the same me-dium.
Clinical application.There are several characteristics of the method used in this study which point to the robust nature of the identification. First, the growth conditions for the samples are not strictly controlled. For example, the precise constitu-FIG. 2. Range of measured integral intensities for each species group. The means (bars) and standard deviations (error bars) are shown.
on May 15, 2020 by guest
http://jcm.asm.org/
[image:7.612.57.285.62.578.2]tion of the growth medium may vary from batch to batch (base media from two different manufacturers and multiple batches of horse blood were used). The size of the inoculum may vary from plate to plate. Growth of bacteria on an agar plate is inherently inhomogeneous, due to crowding and slow diffusion of oxygen and other nutrients through colonies and agar. Our early experiments with triplicate cultures of all isolates dem-onstrated a lack of variation in spectra from cells grown on single batches of medium. Due to large variations between species in the amount of growth obtained overnight on HBA plates (the growth ofS. milleriwas usually very poor), the wet weight of cells resuspended varied from 2 to 200 mg. Since the MR signal is directly proportional to the sample concentration, there is no need to standardize the sample density. Poor bac-terial growth required only an extended number of transients to achieve an adequate signal-to-noise ratio.
The phase correction and integration steps of spectrum pro-cessing, as implemented, required some subjective operator input. These deficiencies in the method will introduce some ex-tra variance into the data. They may be overcome by procedures not presently available in our laboratory (use of magnitude spectra and automated integration [22]). Other whole-organism fingerprinting techniques are reported to require strict control of growth media and repeated standardization with control cultures (11, 12).
The nondestructive nature of the method enables retention of viable organisms postanalysis for subsequent checking of contamination or methodological errors.
The use of more sophisticated pattern recognition methods than those used in our study (19) may further improve discrim-ination and allow separate classification within the species groups, albeit at the possible expense of easily interpreted biochemical information. For an application dedicated to iden-tification rather than characterization, this would be an accept-able compromise.
We have demonstrated that, in principle, MRS may be com-bined with automated pattern recognition techniques to iden-tify bacteria to the species level. We have recently achieved identification results of similar accuracy for six gram-negative species and for two Cryptococuccus neoformansvarieties (un-published results). The extreme ease of sample preparation, biochemically informative results, rapid automated identifica-tion, and the robust nature of the method are attractive for clin-ical and industrial applications. In practice, MR-based identi-fication may be of most value for bacterial species which are relatively slow growing or difficult to identify by conventional methods.
ACKNOWLEDGMENTS
We are grateful to Sue Gordon and Scott McDonald for technical assistance, to Lyn Gilbert for critical reading of the manuscript, and to Ray Somorjai, for advice on the Robust BootStrap method.
This research was supported by the Australian National Health and Medical Research Council (grant 980116). A provisional patent has been granted (U.S. patent 60/270,367, February 2001).
REFERENCES
1.Bax, A., and D. Davis.1986. MLEV-17-based two-dimensional homonuclear magnetization transfer spectroscopy. J. Magn. Reson.65:355–360. 2.Bradley, E., and R. Tibshirani.1993. An introduction to the bootstrap.
Chapman & Hall, London, United Kingdom.
3.Braun, S., H.-O. Kalinowski, and S. Berger.1998. 150 and more basic NMR experiments. Wiley-VCH, New York, New York.
4.Cohen, J.1968. Weighted Kappa: Nominal scale agreement with provision for scaled disagreement or partial credit. Psychol Bull.70:213–218. 5.Delpassand, E. S., M. V. Chari, C. E. Stager, J. D. Morrisett, J. J. Ford, and
M. Romazi.1995. Rapid identification of common human pathogens by high-resolution proton magnetic resonance spectroscopy. J. Clin. Microbiol.
33:1258–1262.
6.Gadian, D. G.1995. NMR and its applications to living systems. Oxford University Press, Oxford, United Kingdom.
7.Goodacre, R., J. K. Heald, and D. B. Kell.1999. Characterisation of intact microorganisms using electrospray ionisation mass spectrometry. FEMS Mi-crobiol. Lett.176:17–24.
8.Goodacre, R., E. M. Timmins, P. J. Rooney, J. J. Rowland, and D. B. Kell.
1996. Rapid identification ofStreptococcusandEnterococcusspecies using diffuse reflectance-absorbance Fourier transform infrared spectroscopy and artificial neural networks. FEMS Microbiol. Lett.140:233–239.
9.Hahn, P., I. C. P. Smith, L. Leboldus, C. Littman, R. L. Somorjai, and T. Bezabeh.1997. The classification of benign and malignant human prostate tissue by multivariate analysis of1H magnetic resonance spectra. Cancer Res.57:3398–3401.
10. Hardie, J. M., and R. A. Whiley.1997. Classification and overview of the generaStreptococcusandEnterococcus. J. Appl. Microbiol.83(Suppl. S):S1– S11.
11. Kummerle, M., S. Scherer, and H. Seiler.1998. Rapid and reliable identi-fication of food-borne yeasts By Fourier-transform infrared spectroscopy. Appl. Environ. Microbiol.64:2207–2214.
12. Magee, J.1993. Whole-organism fingerprinting, p. 383–427.InM. Goodfel-low and A. G. O’Donnell (ed.), Handbook of new bacterial systematics. Harcourt Brace, New York, N.Y.
13. Mountford, C., R. Somorjai, L. Gluch, P. Malycha, C. Lean, P. Russell, M. Bilous, B. Barraclough, D. Gillett, U. Himmelreich, B. Dolenko, A. Nikulin, and I. Smith.MRS on breast fine needle aspirate biopsy determines pathol-ogy, vascularization and nodal involvement. Br. J. Surg. in press. 14. Naumann, D., V. Fijala, H. Labischinski, and G. Giebrecht.1988. The rapid
differentiation and identification of pathogenic bacteria using Fourier trans-form infrared spectroscopy. J. Mol. Struct.174:165–170.
15. Nelson, W., R. Manoharan, and J. Sperry.1992. UV Resonance Raman studies of bacteria. Appl. Spectrosc. Rev.27:67–124.
16. Pot, B., P. Vandamme, and K. Kersters.1994. Analysis of electrophoretic whole-organism protein fingerprints, p. 493–521.InM. Goodfellow and A. O’Donnell (ed.), Chemical methods in prokaryotic systematics. John Wiley & Sons, Chichester, United Kingdom.
17. Russell, P., C. Lean, L. Delbridge, G. May, S. Dowd, and C. Mountford.
1994. Proton magnetic resonance and human thyroid neoplasia. I. Discrim-ination between benign and malignant neoplasms. Am. J. Med.96:383–388. 18. Shaka, A., P. Barker, and R. Freeman.1985. Computer-optimized decou-pling scheme for wideband applications and low level operation. J. Magn. Reson.64:547–552.
19. Somorjai, R., B. Dolenko, A. Nikulin, P. Nickerson, D. Rush, A. Shaw, M. Glogowski, J. Rendell, and R. Deslauriers.Distinguishing normal from re-jecting renal allografts: application of a three-stage classification strategy to MR and IR of urine. Vibr. Spectrosc., in press.
20. Somorjai, R. L., B. Dolenko, A. K. Nikulin, N. Pizzi, G. Scarth, P. Zhilkin, W. Halliday, D. Fewer, N. Hill, I. Ross, M. West, I. C. P. Smith, S. M. Donnelly, A. C. Kuesel, and K. M. Briere.1996. Classification of1H MR spectra of human brain neoplasms: the influence of preprocessing and com-puterized consensus diagnosis on classification accuracy. J. Magn. Reson. Imaging6:437–444.
21.Somorjai, R. L., A. E. Nikulin, N. Pizzi, D. Jackson, G. Scarth, B. Dolenko, H. Gordon, P. Russell, C. L. Lean, and L. Delbridge.1995. Computerized consensus diagnosis: a classification strategy for the robust analysis of MR spectra. I. Application to1H spectra of thyroid neoplasms. Magn. Reson. Med.33:257–263.
22. Wallace, J. C., G. P. Raaphorst, R. L. Somorjai, C. E. Ng, M. Fung Kee Fung, M. Senterman, and I. C. P. Smith.1997. Classification of1H MR spectra of biopsies from untreated and recurrent ovarian cancer using linear discrimi-nant analysis. Magn. Reson. Med.38:569–576.
23. Willker, W., D. Leibfritz, R. Kerssebaum, and W. Bermel.1993. Gradient selection in inverse heteronuclear correlation spectroscopy. Magn. Reson. Chem.31:287–292.