IMPLEMENTATION FOR BRAIN TUMOR DETECTION AND THREE
DIMENSIONAL VISUALIZATION MODEL DEVELOPMENT FOR
RECONSTRUCTION
Sunil L. Bangare
1, G. Pradeepini
1and Shrishailappa T. Patil
21
Department of Computer Science and Engineering, Koneru Lakshmaiah University, Guntur, Andhra Pradesh, India
2
Department of Computer Engineering, Vellor Institute of Technology, Pune, India E-Mail: [email protected]
ABSTRACT
This work has been proposed to detect the brain tumor using various preprocessing techniques like grayscale, thresholding, edge detection and 3D model development and reconstruction is done on the detected tumor. The tumor is further categorized in three types and is viewed in 3 dimensional. This idea has been initiated as an assessment tool for the diagnosis of brain tumors. Earlier methods used by doctors may raise human mistakes. Hence, a tool is required to collect, classify and analyse the medical data automatically to reduce human mistakes that may lead to fatal errors. The tumors in different MRI are compared to examine the difference in stages of tumor or two patient’s tumor. This paper comes up with a two dimensional view of all stages of the tumor of a patient. The OTSU’s algorithm has been used for calculating threshold, as it’s fast and computes an optimized threshold value. The Sobel edge detection technique is used to expose the drastic change. Finally, function is carried out to calculate the severe blocks and the less severe blocks in the tumor. Results for the brain tumor MRI have been disposed. Three dimensional view is generated.
Keywords: grayscale, thresholding, edge detection, reconstruction, 3D visualization, OTSU’s algorithm, MRI image.
INTRODUCTION
Brain has a very complex structure and is considered as a kernel part of the body. Human brain acts like an sensor which controls all our activities like our muscle movements, the body part movements etc. Brain creates thought, emotions and plan etc. The neurons present in brain are recording the memory of our day to day activities. The Image reconstruction or visualization of medical images captured using MRI, PET, CT, EEG etc are very important for the medical practitioners fro effective diagnosis of brain related diseases. These reconstructed images can be processed using medical image processing [1] [2]. Reconstruction of brain images is a vast field in dealing with these images which is not only useful for diagnosis but also for the training for new Doctors [3] [4]. Radiation oncologists spend a substantial portion of their time performing the segmentation task manually, using one of the available visualization and segmentation tools. Also, there may be cases where the automatic methods fail or perform poorly. Another consideration is that medical doctors must always have final control over the segmentation [5] [6]. The most common primary brain Tumors are gliomas, wherein 70% are in the group of malignant gliomas (anaplastic astrocytoma World Health Organization (WHO) grade III), glioblastoma multiform (GBM) WHO grade IV) [7]. The GBM is one of the highest malignant human neoplasms. Due to the biological behaviour, gliomas of WHO grade II to IV cannot be cured with surgery alone. The multimodal rapeutical concept involves maximum safe resection followed by radiation and chemotherapy, depending on the patient’s functional impairment scale. The survival rate is still only approximately 15 months, despite new technical and medical accomplishments such as multimodal navigation during micro-surgery,
stereotactic radiation or the implementation of alkylating substances [8].
EXISTINGSYSTEM
In this section, we are discussing briefly about the earlier approaches which have been carried out in the field of brain tumor detection. K Narayanan and Yogesh Karunakar [6] have considered the following actions to build a 3D image based on acquisition of 2D slices. Reading and structuring the initial data (MRI slices) in order to be memorized in their natural sequence, the input data are represented on the slices taken as a result of MR investigations. Image segmentation and identification of zones of interest from the diagnosis point of view; this action is taken into account because it is enough strong and flexible even if the proposed method does not involve a beforehand in identification of the different surfaces with certain density.
Rajesh C. Patil et al [9] has discussed Watershed segmentation a grey-level image where the grey level of a pixel is interpreted as its altitude. Just like the drop of water falling on a topographic relief and reaching towards a local minimum. The watershed of a relief behaves similarly. Different watershed can be used in the Image processing.
PROPOSEDSYSTEM
The proposed system is designed to accept MRI image and convert it to grayscale for further processing. The MRI images consist of some green and blue shades and hence it has to be converted to grayscale before applying thresholding technique on the original MRI image. The grayscale image is given as input to histogram as well as sobel edge detection technique as the proposed block diagram follows a parallel flow, one separates the tumor from the brain and the other separates the brain from the skull. The tumor is called the foreground, object or region of interest i:e the area the algorithm works on. The remaining part of image is the background which is removed by using various techniques like thresholding, sobel edge detection, segmentation and boundary detection. Once the region of interest i.e. brain tumor is detected and separated from the remaining part of the brain image categorization is performed on it. The tumor is categorized in three type’s first non tumor, second less severe and last Tumor detected. The non tumor states that the object detected is not a tumor actually.
On categorizing the tumor, the tumor is reconstructed in 3-Dimensional view to enable the doctors to diagnose it without manual errors and with less effort and hence this system can be referred as a “Assessment Tool for diagnosing Brain Tumor using MRI image”.
Figure-1. Block diagram of proposed system.
Figure-2. Detailed block diagram of proposed system.
Pre-processing
The carried out work mainly focuses on gray scaling, Sobel edge detection, thresholding. System takes digital 2-D image as an input then we perform grayscale. Sobel edge detection is used to detect drastic change in color of pixel. Sobel edge detection requires less execution time than other techniques so we are using this method in our system. At last we are performing thresholding to get binary image because we need binary image to perform various operations in image processing. This step increases the reliability of an image for the next process. Filter’s are used for image quality improvement.
The process is as follows:
Multiple functions used for image processing
Contrast adjustment by static or dynamic binarisation, look-up tables or image plane separation
Reduction of resolution via binning Rotation of images
Conversion of images from color to gray value images
Preprocessing as a first step need to improve the quality of the image being processed. It makes the task of other steps easier. In this work S. L. Bangare et al [10] has proposed research work is referred.
In this project, pre-processing is mainly divided into three techniques:
Figure-3. Flow of pre processing in proposed system.
Grayscale
Grayscale image consists of average of R-G-B at each pixel. Most of the people think that grayscale converts colored image to image composed exclusively of shades of grey i.e. it removes color property of image. But in some cases we have to perform various operations on each pixel of an image such as edge detection, thresholding where if there are different values of color at each pixel then it becomes more complicated. So we perform grayscale operation. Grayscale images are having are images with only the two colors, black, and white.
Grayscale is having a range of shades of gray and the darkest possible shade is black, which is the total absence of transmitted or reflected light. The lightest possible shade is white, where there is the total transmission or reflection of light. For every pixel in a red-green-blue (RGB) grayscale image, RR = GG = BB. Where RR = RED, GG = GREEN, BB = BLUE. The lightness of the gray is directly proportional to the number representing the brightness levels of the primary colors. Black is represented by RR = GG = BB = 0 or RR = GG = BB = 00000000, and white is represented by RR = GG = BB = 255 or RR = GG = BB = 11111111. Because of the 8 bit’s in the binary representation of the gray level, this imaging method is called 8-bit grayscale.
Algorithm
Two dimensional image is used as an input array. Fetch pixel color value (24-bit) individually.
Break down the value of the color of each pixel into separate RR, GG and BB, 8-bit values.
Finding out the grayscale (8-bit) component for RR, GG and BB pixels using a conversion formula. Compute a value of 24-bit pixel from value of 8-bit
grayscale.
Final value calculated at same location in output image.
Extract 8-bit RR, GG and BB values from 24-bit color value
bb = pix & 0xff; gg = (pix >> 8) & 0xff; rr = (pix >> 16) & 0xff;
E.g. Assume PIXEL value is 0x435A56 where 0x43 is red, 0x5A is green and 0x56 is blue component. Now to separate blue we can use the LOGICAL AND operator to mask or filter the blue component from the rest. Since AND’ing with 1 makes no difference where as AND’ing with 0 will force the bit to 0.
435A56 AND 0000FF
--- 0x000056 - blue separated
For Green we shall first right shift the pixel value by 8 bits so that green component is now at LSB position. And then repeat the masking
process.
435A56 >> 8 = 435A 0x435A
AND 0x00FF
--- 0x005A - green separated
Similarly we shall right shift by 16 bits so that red component will be at the LSB position and then do the masking.
Calculate grayscale component
gs = (rr + gg + bb) / 3;
There are various ways to convert color values to grayscale. Anyone can be used depending on the user’s needs.
RGB averaging formula
gs = (rr+gg+bb) / 3;
Here averages of all three colors are calculated and saved in output image.
Above formula can also be written as gs = rr * 0.33 + gg * 0.33 + bb * 0.33;
I.e. 33% of all colors is used to compose final 100% grayscale component.
NTSC formula
gs = rr * 0.33 + gg * 0.56 + bb * 0.11;
The NTSC formula takes 56% of green where as only 11% of blue since green color has more luminescence or brightness than blue.
Thresholding
Thresholding is the simplest method of image segmentation. The pixels are partitioned depending on their intensity value. Thresholding can be used to create binary images i.e. image with only black or white colors from grayscale image. It is generally used for feature extraction where required features of image are converted to white and everything else to black or vice-versa.
Thresholding is a process of converting a grayscale input image to a bi-level image. The main role of thresholding is for the extraction of desired object from image. The extracted information is binary where the pixels represent a range of intensities. Thus the objective of binarization is to mark pixels that belong to true foreground regions with a single intensity and background Input 2D
Image
regions with different intensities. S. L. Bangare et al [10] [11] have proposed few algorithms which are reused here.
Algorithm
Step 1: Compute histogram for a 2D image.
Step 2: Calculate foreground and background variances (measure of spread) for a single threshold.
2)
a) Calculate weight of background pixels and foreground pixels.
b) Calculate mean of background pixels and foreground pixels.
c) Calculate variance of background pixels and foreground pixels.
Step 3: Calculate “within class variance”
Logic Assumptions
To simplify the explanation consider only 6 grayscale levels are used.
Consider threshold value 3 for 6grayscale levels.
Calculate weight for background and foreground pixels
Calculate mean
Histogram value =h
Calculate variance
Calculate within class variance
I:e sum of two variances multiplied by their associated weights.
Within class variance = Wb*Vb+Wf*Vf
Sobel edge detection
Work done in our previous paper; S. L. Bangare
et al [14] is referred for the proposed work here. The
Sobel operator or Sobel Filter used in image processing for edge detection algorithms, and creates an image which
emphasizes edges and transitions. Edge detection with two types’ gradient and Laplacian are popular. The gradient method detects the edges by looking for the maximum and minimum in the first derivative of the image. The Laplacian method searches for zero crossings in the second derivative of the image to find edges [14]. Edge detection used to provide meaningful features and useful information. It reduces the image size and brings out information that may be regarded as less relevant. Also redundancy in the image is removed. For capturing th important events the sharp changes in image brightness are studied. Edge detection methods work on the assumption that the edge occurs where there whenever there is a discontinuity in the intensity function then the edges get detected.
Sobel operator
Here a pair of 3×3 convolution matrix is representing the sobel operator as shown in Figure-1. One matrix is simply the other rotated by 90° [14].
Figure-4. Convolution matrix.
Generally these matrices are helpful to respond maximally to edges running vertically and horizontally relative to the pixel grid, one matrix for each of the two perpendicular orientations. The matrices are used when applied separately to the input image, to calculate separate measurements of the gradient component in each orientation i.e. Gx and Gy. Their combination is used to find the absolute magnitude of the gradient at each point and the orientation of that gradient [14]. The gradient magnitude is calculated as:
For the approximate magnitude calculation following formula is used:
This is much faster to compute. The angle of orientation of the edge (relative to the pixel grid) giving rise to the spatial gradient is given by the formula:
Algorithm
Input 2D image.
Use Sobel edge detection algorithm and the gradient
Gx, Gy.
Manipulate Gx, Gy separately on the input image.
Combine the results to calculate the absolute magnitude of the gradient.
The absolute magnitude is the output edges that we required [14].
EXPERIMENTALRESULTS
Tumor detection
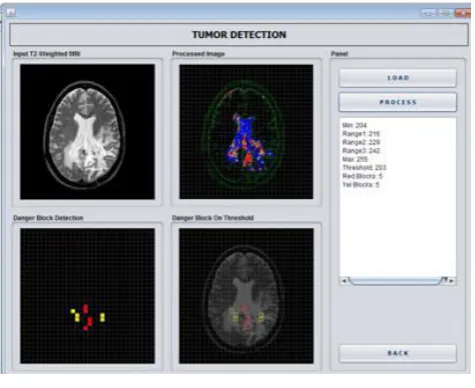
[image:5.595.316.537.322.502.2]Magnetic Resonance Imaging (MRI) is used for the project out of many options to capture image. All of the information obtained will be useful for the effective treatment of the patient. MRI is an efficient medical imaging tool that has different methods (T1,T2, etc) having each particular property and an effective way that enables to identify or classify the various tissues and also to obtain a 2D, 3D and even 4D sight (3D+T) of a part of the body, in particular of the brain. It’s based on the principal of nuclear magnetic resonance (NMR). Due to various sequences various tissues with high contrast can be observed. Actually, many medical imagery diagnosis systems have to face the problem of cells and their nuclei separation from the rest of the image content. As the process of separation is very important, much attention in the construction of the expert diagnosis system has to be paid to the segmentation stage.
Figure-5. Tumor detection.
Segmentation is a crucial step in image processing tasks. In literature, there are different definitions of segmentation Haralick, Zhang and Freixenet summarize the segmentation definitions found in literature. From general point of view segmentation is the partitioning of an image into a set of homogeneous and significant regions having a single label and common or similar properties. Many algorithms were thus proposed
during the last decades. They are based on various approaches: contour, region and texture. In the image processing analysis, segmentation is preceded by a pre-treatment step called enhancement. In fact the enhancement step is needed to improve the quality of images since the majority of images dealt with have low contrast. For every color channel contrast correction is done which later given to hybrid segmentation methods.
The segmentation phase is also followed by a post treatment step known as classification which ensures the tumor extraction. The classification of medical images is a fundamental step in different applications such as psychology, biology, medicine. Due to the high variability of medical image data it’s important to use appropriate models in the classification process. A large variety of methods for classification of medical images is discussed in the literature.
Tumor comparison
Figure-6. Tumor comparison.
The tumor is compared on the number or count of the severe and less severe blocks. This assists in the diagnosis of two tumor images. The earlier stage image is compared with the next stage of tumor image. The count of severe and less severe blocks enables the doctor to Figure out the changes in the growth of tumor.
2D visualization and 3D visualization
2D visualization
[image:5.595.52.290.468.662.2]Figure-7. 2D visualization.
3D visualization
Figure-8. 3D visualization.
Three dimensional (3D) reconstruction of the tumor from medical images is an important operation in the medical field as it helps the radiologist in the diagnosis, surgical planning and biological research.
Brain tumor is inherently serious and life-threatening because of its invasive and infiltrative character in the limited space of the intracranial cavity. Hence determining its pathology, volume and complexities is crucial for surgical planning and knowing the stage of cancer. Magnetic resonance imaging (MRI) is the commonly used imaging modality for non-invasive analysis of the brain tumor. MRI uses radio waves and magnetic fields to acquire a set of cross sectional images of the brain. That is anatomic details of the 3D tumor are presented as a set of 2D parallel cross sectional images. Representation of a 3D data in the form of 2D projected slices does result in loss of information and may lead to erroneous interpretation of results [11]. Also, 2D images cannot accurately convey the complexities of human anatomy and hence interpretation of complex anatomy in
2D images requires special training. Although radiologists are trained to interpret these images, they often find difficulty in communicating their interpretations to a physician, who may have difficulty in imagining the 3D anatomy. Hence, there is a need for 3D reconstruction of the tumor from a set of 2D parallel cross sectional images of the tumor. 3D visualization enables better understanding of the topology and shape of the tumor, and enables measurements of its geometrical characteristics. The extracted information is helpful in staging of tumor, surgical planning, and biological research [12]. Therefore, how to reconstruct a trustworthy surface from the sequential parallel 2D cross sections becomes a crucial issue in biomedical 3D visualization.
CONCLUSIONS
In this research work User friendly algorithm for processing the MRI image slices for the reconstruction of Tumors was developed. The algorithm was tested and calibrated using real MRI data. In the application of the algorithm the real data was enhanced and the tumor was extracted from the images in a user friendly way. The 2D extracted tumor images were reconstructed into 3D volumetric data and the volume of the tumor was also calculated. In future further implementation of this project can be done for various parts of the body like throat, pelvic and lungs for understanding cancer. The developed method can be optimizing, in terms of speed of the algorithm for processing larger images.
ACKNOWLEDGEMENT
We are thankful to the BCUD, Savitribai Phule Pune University, Pune for funding this research work. We are thankful to the Department of Computer Science & Engineering, K. L. University, A. P., India for providing the research facilities, Sinhgad Academy of Engineering, Pune for providing the support and guidance for this Research work. We are thankful to Dr. K. P. Patil, Principal and Prof. A. N. Adapanawar, HOD-IT from Sinhgad Academy of Engineering, Pune.
REFERENCES
[1] Kavita A. Ugale and S. T. Patil. 2015. 3D Reconstruction of Brain MRI using Support Vector Machine. International Journal of Advanced Research in Computer Science and Software Engineering. 5(7), ISSN: 2277 128X.
[2] Birkbeck, Neil, Dana Cobzas, Martin Jagersand, Albert Murtha and Tibor Kesztyues. 2009. An interactive graph cut method for brain tumor segmentation. In Applications of Computer Vision (WACV), 2009 Workshop on, pp. 1-7. IEEE.
Brain image enhancement-A survey. World Applied Sciences Journal. 17(9): 1192-1204.
[4] Yasmin, Mussarat, Muhammad Sharif, Saleha Masood, Mudassar Raza, and Sajjad Mohsin. "Brain image reconstruction: A short survey. World Applied Sciences Journal 19, no. 1 (2012): 52-62.
[5] Sindhushree. K. S, Mrs. Manjula and T. R, K. Ramesha. 2013. Detection and 3d Reconstruction of Brain Tumor from Brain. International Journal of Engineering Research & Technology (IJERT). 2(8), ISSN: 2278-0181, pp. 528-534.
[6] K Narayanan and Yogesh Karunakar. 2011. 3D reconstruction of tumors in MRI images. International Journal on Research and Reviews in Signal Acquisition and Processing. 1(2), ISSN: 2046-617X.
[7] Panos D. Kotasa and Tony Dodd. 2011. A Review of Methods for 2D/3D Registration. Journal of World Academy of Science, Engineering and Technology. (59): 606-609.
[8] Resmi S. and Thomas T. 2012. A Semi-automatic method for segmentation and 3D modeling of glioma tumors from brain MRI. Journal of Biomedical Science and Engineering, 5, 378-383. doi: 10.4236/jbise.2012.57048.
[9] Rajesh C. Patil and A. S. Bhalchandra. 2013. Brain Tumor Extraction from MRI Images using MATLAB. International Journal of Electronics Communication & Soft Computing Science and Engineering, ISSN: 2277-9477. 2(1).
[10]S.L. Bangare, A.Dubal, P.S. Bangare, S.T. Patil. Reviewing Otsu’s Method for Image Thresholding. International Journal of Applied Engineering Research (IJAER), ISSN 1087-1090.
[11]S. L. Bangare, S. T. Patil et al. 2015. Implementing Tumor Detection and Area Calculation in MRI Image of Human Brain Using Image Processing Techniques. Int. Journal of Engineering Research and Applications, ISSN: 2248-9622, 5(4), (Part -6). pp. 60-65.
[12]Kharrat, Ahmed, Nacéra Benamrane, Mohamed Ben Messaoud, and Mohamed Abid. 2009. Detection of brain tumor in medical images. In Signals, Circuits and Systems (SCS), 2009 3rd International Conference on, pp. 1-6. IEEE.
[13]Kharrat, Ahmed, Mohamed Ben Messaoud, Mohamed Abid, Karim Gasmi, and Nacéra Benamrane. 2010. Automated classification of magnetic resonance brain images using wavelet genetic algorithm and support vector machine. In Cognitive Informatics (ICCI), 2010 9th IEEE International Conference on, pp. 369-374. IEEE.