Modeling correlates of depression among in-school
adolescents using multilevel models
Ojo Femi OGUNBOYO
Department of Statistics, Ekiti State University, Ado Ekiti, Nigeria
DOI: 10.29322/IJSRP.8.6.2018.p7826
http://dx.doi.org/10.29322/IJSRP.8.6.2018.p7826
Abstract- Introduction: Depression is a mood disorder that affects people across ages. It is estimated that more than 300mllion people have depression worldwide and the unset is usually at mid-to-late adolescence. However, local data on depression among in-school adolescents in Nigeria is scanty in the literature. The present study assesses individual and compositional level factors associated with depression in the population.
Method: The study population was in-school adolescents in
Ikere-Ekiti, Ekiti state Nigeria. Six schools were purposively selected and 490 consenting students were interviewed with a study instrument consisting of three segments i.e. Demographic section, Rosenberg Self-esteem Scale and CES-DC Scale. Data was analyzed using descriptive statistics, Pearson’s moment correlation analysis and Multilevel Linear Regression using MLwiN package at 5% level of significance.
Results: Participants comprised of more females (59.1%) and
majorly from monogamous families (77.5%). A prevalence of 25.5% for mild to moderate and 14.9% for severe depression was reported and males scored higher on all the depressive symptoms than the females. Polygamous family background, low self-esteem, single sex only school and private school were shown to be positively related to depression. Interestingly, a unit increase in self-esteem decreases depressive mean score by 0.76unit while between school variations contributed more than 10% of the total variations.
Conclusion: The present study reveals a striking prevalence of
depression among the setting which could serve as an indicator to policy makers. Also, it is necessary for mental health issue to be taken seriously among male adolescents just like their female counterparts.
Index Terms- Adolescence, Depression, Multilevel Modeling, Prevalence, Self-esteem
I. INTRODUCTION
epression is a psychosocial illness in which the sufferer has feelings of sadness, instability, loneliness, hopelessness, worthlessness, and guilt (Ahangar et al, 2012). Its symptoms are commonly grouped into four categories: somatic and retarded activity, depressive affect, interpersonal problem and positive affect (Bettge et al, 2008). Recent findings show that depression is a leading cause of disability worldwide and more than 300million people are reported to be living with the disease
lives in developing countries and sub-Saharan countries where the Global Burden of the Disease is very high (21.4%) (Suliman et al, 2010). Unfortunately, It has also been predicted that the burden from depression alone is likely to increase to a single biggest burden of all health conditions by 2030 (WHO, 2004). Although prevalence of depression has been reported to vary across the globe (WHO, 2017), the situation was reported to be higher in America than some African countries, particularly Nigeria (Tomlinson et al, 2009). A prevalence of about 25% for mild to moderate depression and below 10% for definite depression have been reported somewhere in Nigeria (Adeniyi et al, 2011; Pengpid et al, 2013). Despite that the rate seems to be higher among adults, the onset of depression is typically around mid-to-late adolescence (Serani, 2016). Though an average of mid-twenties (26years) has been reported elsewhere (Zisook et al, 2007). Older children and adolescents with depression may be silent, sad, refuse to participate in family and social activities, get into trouble at school, use alcohol or other drugs, or stop paying attention in class and even to their appearances (Zisook et al, 2007; Smith et al, 2018). They may also become negative, restless, grouchy, aggressive, or feel that no one understands them (Healy, 2013; Hurley, 2018).
complexity in the relationship between self-esteem and depression as high self-esteem correlated with low depressive disorder and vice versa. (Manna et al, 2016)
Therefore, examining the predictors and the prevalence of depression among adolescents in Ikere LGA could serve as a pointer and provide aids for easy counseling, prevention and rehabilitation policies both locally and in the state at large. The aim of this study is to examine predictors of depression among in-school adolescents and also to evaluate the prevalence and to investigate interrelationship between depressive symptoms and self-esteem among the participants.
II. METHODS
Study design
This study was a cross-sectional research on Nigerian in-school adolescents within Ikere Local Government Area of Ekiti State, South-west Nigeria.
Participants
The sample comprised 490 secondary school adolescents between age 11 and 19 randomly drawn from 6 secondary schools within 11 political wards in Ikere-Ekiti. Two of the schools are boys only and girls only schools and there were 5 public and 1 private.
Data collection and procedures
A sample size of 486 was estimated with a precision of 0.05 at 95% significance level and power component (1-β) of 80% with a prevalence of 18% (Cortina et al, 2012). Attrition rate of 10% was considered. Six schools (both private and public) were purposively selected and the questionnaires were administered to those who consented to the privy of the research after illustration had been given on the nitty-gritty of the study. It was as well emphasized that participation was voluntary and participants were at liberty to withdraw if they so wish. However, approval was sought from the Ethic Committee, Ekiti State Teaching Hospital as well as the principals in the selected schools.
Assessment of Depression and self-esteem
The instrument comprises of two scales: The Center for Epidemiological Studies Depression Scale for Children (CES-DC), a 20-item self-report depression inventory with possible scores ranging from 0 to 60 in 4 sub-scales namely; somatic symptoms and retarded activity, depressed affect, positive affect and interpersonal problems. Each response to an item was scored as follows: 0 = “Not At All”; 1 = “A Little”; 2 = “Some”; 3 = “A Lot” except where reversal is inevitable according to the user’s recommendation. Higher CES-DC score indicates high risk level of depression (Weissman et al, 1980). In this study, the scores were categorized into two groups: depressed and non-depressed, based on a cut off of 22 as used in a similar study (Trangkasombat and Rujiradarporn, 2012).
Also, the Rosenberg self-esteem scale was scored, analyzed and computed as the total scores for the 10 items. To buffer the effect of nonresponse, average values were used in the analysis. Meanwhile, the higher the score value, the better the self-esteem while the possible values range from 0 to 30.
Model specification
Multilevel linear regression model
In this study we adopted multilevel modeling considering the advantage of hierarchical structure of the sample (i.e. students were nested within classes and classes nested within schools), a multilevel level regression was considered suitable for our modelling. Of course, the choice of linear multilevel was conceived in order to avoid loss of information that could be incurred from categorization of the depression score which was measured on an interval scale.
Model stages
Model1 is an empty model i.e. it contains no explanatory variable with class as the subject while model 2 contains all the individual level predictors i.e. Self-esteem, Age, Sex, Family type, location, Being disappointed by friend of opposite sex (BDFOS). Moreover, the full model (Model 3) contains school level variables [i.e. School type(private or public) and school category(single only school or mixed)] in addition to model 2. Mathematically, we have: Multilevel model has both fixed and random components. Random effects are useful for modeling intra cluster correlation i.e. degree of similarity between observations in the same cluster when they are perceived to share the same cluster-level characteristics. Therefore, a three-level random intercept characteristic was initiated thus:
Where is the response for student i in class j nested within
school k while , , & are the fixed effect parameters associated with individuals, class & school level respectively. The random variables are assumed to be independent of one another and normally distributed with zero mean and constant variances which can be derived as follow:
Var( = Var( (2)
= Var( (3)
= + + (4)
However, no variable was considered at class level and from our preliminary analysis, between class variations was redundant and its inclusion became needless and non-informative. Consequently, a 2-level model was set up.
M I: Unconditional model
MII: MI + Individual level variables
+
(9)
MIII: MII+ School Level variables
+
(10)
MIII could also be expressed with matrix notation
. (11)
Where Z is an nxq matrix of random effect regressor. Here, Y is an nx1 vector of responses. X is n x p matrix containing the effect regressors. Beta (β) is a px1 vector of fixed effect parameters and μ is a qx1 vector of random effects and is an nx1 vector of errors or residuals.
Parameters estimation: We have only six schools, reweighted iterative generalized least square (RIGLS) estimation method which provides less biased estimates of the variance than IGLS when the number of higher-level units is small was used.
Intra-class correlation coefficient (ICC)
The ICC describes the level of dependency in the data i.e. it measures the extent to which individuals within the same group are more similar or correlated to one another other than they are
to individuals in different groups. Thus, (12)
Where represents the individual level variance and represents between school variance. Also, ICC is the proportion of between group variance to the total variance.
Data Management and Statistical Analysis
Data were extracted and entered into IBM SPSS version 20. It (data) was explored for easy detection of outliers while cases where important variable was missing were deleted. However, 490 out 500cases scaled to the final analysis. Normality of the depression mean scores was tested with P-Plot and it conformed to normal distribution. Also, Cronbach alpha value (0.79) for the CES-DC scale indicates a high reliability of the scale. Multilevel analyses were carried out using MLwiN trial version 2.36 (University of Bristol, Bristol, UK). However, Multilevel Linear Regression (MLR) was deliberately conceived due to the within-school clustered nature of the data in our study. The area level variables were school category and the school type: These were dichotomized as single only school or mixed school and private or public respectively. Meanwhile, Chi-Square Statistic was used to test the association between the potential categorical predictors and the response variable(depressed or non-depressed group). Consequently, those that show significance at 90% confidence level were recruited into the multilevel regression analysis.
III. RESULT
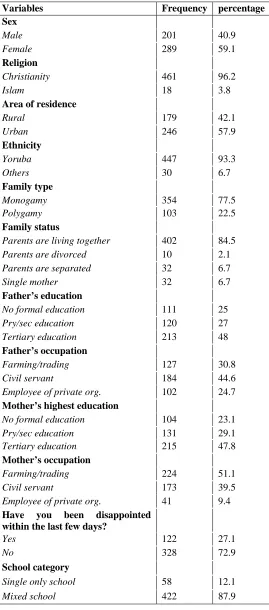
Table 1: Demographic Variables
Table2 shows that higher means scores on somatic and retarded activities, interpersonal problem, and depressive symptoms strongly correlated with higher mean scores on depression scale whereas higher score on positive affect only correlated with lower score on depression. Age has no substantial relationship with depression sub-scales except with the positive affect which decreases (r = -0.117, p<0.05) as age increases. However, higher scores on Somatic symptoms, Depressive Affect, and Interpersonal Problem significantly correlated (r = -0.808, r = -0.867, r = -0.670 respectively) with lower scores on self-esteem while positive affect was in contrast (r = 0.163, p<0.001).
Variables Frequency percentage
Sex
Male 201 40.9
Female 289 59.1
Religion
Christianity 461 96.2
Islam 18 3.8
Area of residence
Rural 179 42.1
Urban 246 57.9
Ethnicity
Yoruba 447 93.3
Others 30 6.7
Family type
Monogamy 354 77.5
Polygamy 103 22.5
Family status
Parents are living together 402 84.5
Parents are divorced 10 2.1
Parents are separated 32 6.7
Single mother 32 6.7
Father’s education
No formal education 111 25
Pry/sec education 120 27
Tertiary education 213 48
Father’s occupation
Farming/trading 127 30.8
Civil servant 184 44.6
Employee of private org. 102 24.7
Mother’s highest education
No formal education 104 23.1
Pry/sec education 131 29.1
Tertiary education 215 47.8
Mother’s occupation
Farming/trading 224 51.1
Civil servant 173 39.5
Employee of private org. 41 9.4
Have you been disappointed within the last few days?
Yes 122 27.1
No 328 72.9
School category
Single only school 58 12.1
Table 2: Interrelationship between age, self-esteem, and depression symptoms
Variables 1 2 3 4 5 6 7
1. Age 1
2. Self-esteem 0.048 1
3. Depression score 0.032 -0.278*** 1
4. Somatic problem -0.034 -0.170*** 0.808*** 1
5. Depressive affect 0.049 -0.250*** 0.867*** 0.617*** 1
6. Interpersonal problem -0.055 -0.174*** 0.670*** 0.490*** 0.525*** 1 7. Positive affect -0.117* 0.163** -0.225*** 0.163** -0.051 0.034 1 *P<0.05, **P<0.01, ***P<0.001
Prevalence of depression
Among overall participants, prevalence of mild to moderate depression was 25.5% and severe depression was 14.9%. Higher proportion (29.2%) of depressive symptoms was observed among boys than girls (23.8%). Similarly, students from polygamous families and participants that ticked yes to being disappointed by friends of opposite sex within the last six
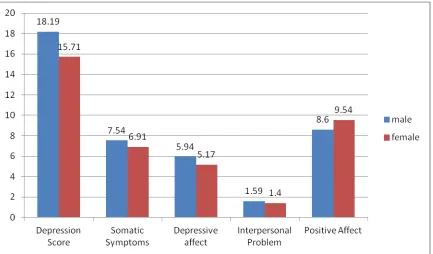
days prior the study show higher prevalence of depression. Moreover, rural dwellers also displayed a greater (20.3%) risk compared to (11.6%) their colleagues residing within the urban areas. Surprisingly, Figure1 shows that male participants scored higher on total depression mean scores and other depressive symptoms except Positive Affect scale as rated by CES-DC.
Figure1. Depressive symptoms mean scores by genders
Mixed Model Result
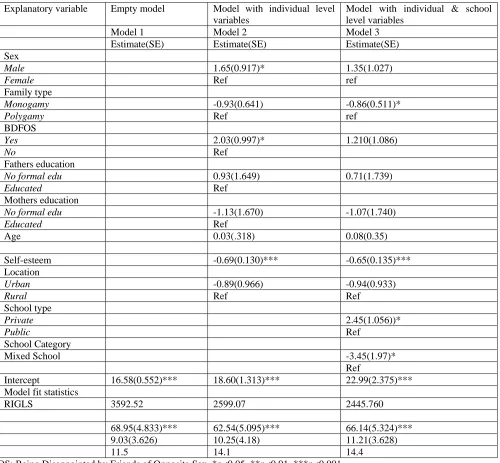
Displayed in Table 3 is the result of the mixed models where the intercept of the unconditional model (Model 1) is 16.58 (p<0.001). This conveys the grand mean of the depression score without the effect of any explanatory variable. That is, the depression score for a female adolescent, from polygamous family, with cordial relationship with friends, living in an urban location with average age and self-esteem score. Also the residual was almost 8times the variation in intercept. That is, the main variation was due to individual differences rather than between-school difference. Intra-class correlation is 11.5 (considering equation 12). Meaning 11.5% of the total variation
is evident that self-esteem is protective against depression and its symptoms. However, those in private schools are expected to have 2.45(1.056) more depression mean score than their counterparts in public school. It can be deduced from the table that the differences observed among those that ticked ‘Yes’ against ‘No’ to ever being disappointed by friend(s) within the
[image:6.612.58.558.159.622.2]previous few days and that of respondents place of residence might have resulted by chance. Those attending boys or girls’ only schools may be more vulnerable as shown in Table 3. Also, age difference cannot significantly predict/explain depression mean score.
Table 3: Multilevel Models of Depression Score and its Explanatory Variables
Explanatory variable Empty model Model with individual level variables
Model with individual & school level variables
Model 1 Model 2 Model 3
Estimate(SE) Estimate(SE) Estimate(SE) Sex
Male 1.65(0.917)* 1.35(1.027)
Female Ref ref Family type
Monogamy -0.93(0.641) -0.86(0.511)*
Polygamy Ref ref BDFOS
Yes 2.03(0.997)* 1.210(1.086)
No Ref
Fathers education
No formal edu 0.93(1.649) 0.71(1.739)
Educated Ref Mothers education
No formal edu -1.13(1.670) -1.07(1.740)
Educated Ref
Age 0.03(.318) 0.08(0.35)
Self-esteem -0.69(0.130)*** -0.65(0.135)***
Location
Urban -0.89(0.966) -0.94(0.933)
Rural Ref Ref School type
Private 2.45(1.056))*
Public Ref
School Category
Mixed School -3.45(1.97)*
Ref
Intercept 16.58(0.552)*** 18.60(1.313)*** 22.99(2.375)*** Model fit statistics
RIGLS 3592.52 2599.07 2445.760
68.95(4.833)*** 62.54(5.095)*** 66.14(5.324)*** 9.03(3.626) 10.25(4.18) 11.21(3.628)
11.5 14.1 14.4
BDFOS: Being Disappointed by Friends of Opposite Sex, *p<0.05, **p<0.01, ***p<0.001
IV. DISCUSSION
The main focus of this study was to examine the prevalence and the predictors of depression among the study population. However, more than fourteen percent of the participants scored above cut-off on the depression scale (CES-DC). Actually, this finding is very high compared to what was found in some previous studies (Adeniyi et al, 2011; Ahangar et
common reports that girls are prone to emotional and depressive symptoms (Ahangar et al, 2012 Chinawa et al, 2015; Massip et al, 2010; Bettge et al, 2008; Keller, 2010). Reasons for this disparity might not be far from the socio-cultural differences as expectations are known to be too high for boys than girls in most Nigerian communities, particularly within Yoruba settings. Most parents believed that boys are more important and they are expected to perform better in all, even academically. Failure to meet up with this demand might consequently result in fear and hence, depression.
Also, boys scored higher in all the depressive symptoms sub-scales except positive affect sub-scale. Similarly, our result was in concordance to what was found in a study among in-school adolescents in the south-eastern part of Nigeria where depression was more prevalent among adolescents from families whose parents are separated but least among those whose parents are together (Chinawa et al, 2015). It could be suggested that parental care has a role to play in preventing depression because the burden due to parental separation could clamp down on children hence leading to psychological trauma.
Positive affect and self-esteem consistently played a protective role against psychosocial internalizing symptoms, just like other previous studies position that an increase in self-esteem equally increases ones happiness perhaps, reduces depression (Ahangar et al, 2012;Barnow et al, 2005; Bettge et al, 2008; Manning, 2007; Yaacob et al, 2009). Therefore, emphasis should be laid on how these attributes could be enhanced in order to minimize depression among adolescents.
As shown in Table3, family type, school type, school category and self-esteem are significantly associated with depression among adolescents.
Moreover, the statistical method adopted in this research work was judiciously used and very appropriate since the effect of clusters uniqueness in the regression analysis was observed and ICC is greater than 0.1. Also, multilevel regression has been identified to be more conservative and efficient than the classical regression (Yusuf et al, 2011). Nevertheless, using multilevel regression analysis in this study would definitely present a more accurate and conservative result considering the nature of the study where there are nested group structures due to within school connectedness and collegiate activities that could influence students’ psychological well-being as a result their day-to-day interactions.
In conclusion, the present study identified family type and self-esteem at individual level and school type and school category at area level determinants of depression. Gender and age couldn’t significantly predict depression.
V. RECOMMENDATION
Striking prevalence of this menace is a wakeup call for policy makers to encourage and establish school-based mental health programs in Ekiti and Nigerian schools at large. Effort should be made to improve students’ wellbeing by enhancing protective factors like self-esteem. Nigeria regular and special educational institutions for children and adolescents lack school-based mental health programs. Programs that can boost self-esteem and positive affection among adolescents should be encouraged for its protective effect on depression. More
disorders as depression among adolescents in Ekiti state and Nigeria at large should be intensified by mental health researchers. Also, application of multilevel regression analyses in public health research should be encouraged where suitable.
REFERENCES
[1] Barnow, S., Lucht, M and Freyberger. H.J. (2005). Correlate of Aggressive and Delinquent Conduct problems in Adolescent: Aggressive Behaviour(31), pages 24-39.
[2] Bettge S., Wille N., Barkmann C., Schult-Markwort M., Raven-Sieberer U. (2008). Depressive Symptoms of Children and Adolescents in a German representative sample: Results of the BELLA study: European Child and psychiatry Vol. 17(1).
[3] Josephat M Chinawa and Pius C Manyike et al(2015): Depression among adolescents attending secondary schools in South East Nigeria; DOI: 10.4103/1596-3519.148737
[4] Katayoon Ahangar, Mariani Mansor, and Rumaya Juhari (2012). Interpersonal relationships and depression among adolescents living in Tehran’s Shelters: International Journal of Child Youth and family studies. (1)112-123
[5] Massip A.F., Campos J.A., Benito J.G and Gradara B.V. (2000). Psychometric Preperties of the children depression inventory in a community and clinical sample: the Journal of psychology,:ol. 13 No2, 990-999.
[6] Melissa A. Cortina, Anisha Sodha, Fazel, D.M and Paul G. Ramchandani (2012). Prevalence of child mental Health Problems in Sub-Saharan Africa: Arch PediatrAdolesec. Med., 166(3)276-281.
[7] Muareen A. Manning (2007): Self-Concept and Self-Esteem in Adolescents. http://www.acupuncture-monterey.com/well-being.html [8] Suliman S, Stein DJ, Myer L, William D R, & Seedat S. (2010): Disability
and Treatment of Psychiatric and Physical Disorders in south Africa. Journal of Nervous and Mental Disease. Volume 198, No 1.
[9] Tamas Keller (2010), Self-confidence and earning inequalities: A test on Hungarian data Sociologickyrasopis/Czech Sociological Review, DOl. 46, No. 3:401-425.
[10] Tomlinson M, Grimsrud AT, Stein DJ & Myer L (2009): The epidemiology of major depression in South Africa: results from the South African stress and health study. S Afr Med J. 2009 May; 99(5 Pt 2):367‐73.
[11] Trangkasombat U. and Rujradarporn N. (2012). Gender differences in depressive symptoms in Thai Adolescents: Asian Biomedicine Vol. 6, No 5; 737-745.
[12] Ulrike Ravens-Sieberer, Nora Wille, Michael Erhart and Susanne Bettge et al (2009). Prevalence of mental health problems among children and adolescents in Germany: results of the BELLA study within the National Health Interview and Examination Survey European Child Adolescent psychiatry. Suppl1:22-33. Doi.: 10.1007/s00787-008-1003-2.
[13] Weissman et al (1980): Center for Epidemiological Studies Depression Scale for Children (CES-DC).
[14] World Health Organization (2010). Report “Mental Health and Development: Targeting People with Mental Health Conditions as a Vulnerable Group.” Geneva.
[15] World Health Organization (2017). Depression: Media center Fact Sheets. WHO 2017.
[16] Yaacob, S.N., Juhari, R. Talib, M.A., Uba I. (2009). Loneliness, Stress, Self-esteem and Depression Among Malaysian Adoliscents: JurnalKemanusiaanBil: (14) 84-95.
[17] Yusuf B., Omigbogun O., Adedokun B. and Akinyemi O. (2011). Identifying predictors of violent behaviour among students using the convectional logistic and multilevel logistic models: Journal of Applied Statistics, First article.
[19] Adewuya A. O. (2006). Prevalence of major depressive disorder in Nigerian college students with alcohol-related problems. General Hospital Psychiatry, 28(2), 169–173.
[20] Ibrahim, A. K., Kelly, S. J., & Glazebrook, C. (2013). Socioeconomic status and the risk of depression among UK higher education students. Social Psychiatry Psychiatric Epidemiology. Retrieved from http://www.ncbi.nlm.nih.gov/pubmed/23412652
[21] LI Khasakhala, DM Ndetei, V Mutiso, AW Mbwayo, M Mathai (2012). The prevalence of depressive symptoms among adolescents in Nairobi public secondary schools: association with perceived maladaptive parental behaviour. Afr J Psychiatry 2012;15:106-113
[22] Al-Krenawi, A. & Slonim-Nevo, V. (2008). The Psychological Profile of Bedouin Arab Women Living in Polygamous and Monogamous Marriages, 89 FAM. SOC’Y: J. CONTEMP. SOC. SCI. 139, 145-46.
[23] Deborah Serani (2016). The Difference between early onset vs late onset depression. Psychology Today. http://www.psychologytoday.com
[24] Sidney Zisook, Ira Lesser, Jonathan W Stewart et al (2007). Effect of age at onset on the course of major depression disorder. Am J Psychiatry; 164.1539-1546.
[25] Melinda Smith, Lawrence Robinson, Jeanne segal (2008): Parent’s Guige to teen depression. Helpguide.org
[26] Melisa Healy (2013): Grouchy, angry, irritability & depression: The hard cases. Latimes.com/2013.oct/
[27] Katie Hurley (2018). Seven surprising symptoms of depression. (Feb., 2018). www.psychom.net
[28] Vikram Patel and Arthur Kleinman (2003). Poverty and common mental disorder in developing countries.. Bulletin, WHO 20, 81(8)
[29] Malik M, Khanna P, Rohilla R, Mehta B, Goyal A (2015). Prevalence of depression among school going adolescents in an urban area of Haryana, india. Int J community Med Public Health. 2: 624-6
[30] Naushad S, Farooqui W, Sharma S, Rani M, Singh R & Verma S (2014). Study of Proportion and determinants of depression among college students in Mangalore. Niger Med J. 55:156-60. [PMC free article] [PubMed] [31] Adeniyi A.F, Okafor N.C and Adeniyi C.Y (2011). Depression and physical
activity in a sample of Nigeria adolescents: levels, relationships and predictors. Child and adolescent psychiatry and mental health.5:16. www.capmh.com/contents/5/1/16
[32] Peltzer K, Pengpid S and Oluwu S (2013). Depression and associated factors among university students in Western Nigeria. Journal of Psychology in Africa, 23(3), 459-466.
AUTHORS
First Author – Ojo Femi OGUNBOYO, Department of
Statistics, Ekiti State University, Ado Ekiti, Nigeria
Corresponding Author: E-mail: [email protected]