Application of Data Mining Technique for Wheat
Crop Yield Forecasting for Districts of Gujarat State
Shital H. Bhojani1, Dr. Nirav Bhatt2
*
Assistant Professor-AAU-Anand – PHD Scholar RK University, Rajkot **
Assistant Professor – RK University, Rajkot – Gujarat DOI: 10.29322/IJSRP.8.7.2018.p7948
http://dx.doi.org/10.29322/IJSRP.8.7.2018.p7948
Abstract- Objectives: The main objective of this research is to forecast the wheat crop yield for the different districts of Gujarat state.
Methods/Statistical analysis: To predict the wheat crop yield, data mining classification algorithms and step-wise linear regression method were used. Weighted and unweighted weather indices were calculated using the weekly weather data as suggested by the crop yield forecasting model by IASIR, New Delhi. The actual yield data is used from 1985 to 2012 years as training set and from 2013 to 2015 as validation years.
Findings: The result was studied for both the techniques and result shows that various districts coefficient of determination (R2) was ranged between 64% for Valsad to 97% for Bharuch using crop yield forecasting model. By using the WEKA classification MLP algorithm, the coefficient of determination (R2) was found 92% for Valsad, 98% for Ahmedabad and for the rest of the districts it’s 100%. The result of actual and predicted wheat yield from 2012-13 to 2014-15 was studied for yield forecast model and found that error percents were underestimated and overestimated predictions for the different districts. Study shows that the results of MLP and AR algorithms were better compare to other algorithms.
Application/Improvements: Use of data mining techniques for the agriculture sector is a new research filed. Application of agriculture using Data mining techniques can be generated for the different crop yield forecasting.
Index Terms- Yield, Forecast, Data Mining, Gujarat, Classification
I. INTRODUCTION
griculture data are highly extended in provisions of nature, interdependencies and resources region- wise. Wheat is grown more or less in all the districts in the state but north Gujarat covers large area of wheat crop. The productivity of Gujarat is equal to national average but lower as compare to Punjab, Haryana and Uttar Pradesh. Gujarat contributes about 4.627% of total Wheat production in the country. Predicting the potential effects of rainfall and weather on crop yields requires a model of how crops respond to weather. This paper discusses the statistical forecasting model and data mining classification algorithms for wheat crop yield forecasting. Data mining techniques can facilitate discovery of rules and patterns in sets of data and provides a good result as compared to statistical model.
The techniques of data mining are very popular in the area of agriculture and relatively it’s a young research field. Data mining functionalities include the discovery of concept/class descriptions, associations and correlations, classification, prediction, etc.
II. RELATEDWORK
Many researchers have used the crop yield forecasting model for different crops of different regions to predict the crop yield at district and state level. Yunous Vagh studied the effect of rainfall on crop yield in South Western Australia using the classification techniques of data mining1. He used the data from 2001-2006 and split the data into training set and test set and applied different classification algorithm of WEKA tool. He concluded that the GP algorithm showed the strong positive relationship between annual rain fall and wheat yield. He said that the performance of the WEKA tool algorithms could be improved by increasing the sample size1. Author focused on WEKA algorithm for cotton crop yield forecasting2. Authors conducted the experiment on field and studied the effects of weather variables on wheat yield for Anand district of Gujarat state3. A. K. Giri, M. Bhan And K.K. Agrawa forecasted wheat and rice yield in eastern Madhya Pradesh for 7 districts using the 30 years of weather data and validates the generated model for 2 years. They concluded that the difference between actual and predicted yield was less than 15% and further refinement needed to make it 10%5. R.S. Singh and his team forecasted wheat and rice yield in eastern Uttar Pradesh for 9 districts using the 18 years of weather data and validates the generated model for 2 years. They concluded that the developed models were validated with ±10% error6. Smita Gupta and other co-authors forecasted mustard and wheat yield in western Uttar Pradesh for 10 districts and used weather data from 1992-2015. They discussed that for both the crop the difference between observed and predicted yield were less than 10%7.
III. MATERIALANDMETHODS
The actual yield data for the wheat crop was collected from Directorate of Agriculture, Gandhinagar and weather data from the Agro-meteorology department, Anand Agricultural University, Anand. Statistical regression methodology and different data mining algorithm were used for yield prediction.
For the analysis of data SPSS “Statistical Package for Social Science” and WEKA “Waikato Environment for Knowledge Analysis” tools were used. Weekly data were calculated as per the SMW “Standard Meteorological Week”. Weighted and unweighted weather indices were calculated using the weekly weather data as suggested by the crop yield forecasting model by IASIR, New Delhi (Agrawal et al 1980; 1983; Jain et al1980). These Weighted and unweighted values are used in SPSS tool and multiple linear stepwise regression technique has been applied to generate the model for crop yield prediction at district level.
a. Selection of districts and data
In Gujarat state there are eight agroclimatic zones namely South Gujarat (heavy rainfall area), South Gujarat, Middle Gujarat, North Gujarat, North West Zone, North Saurashtra, South Saurashtra, Bhal and Costal area. One district from each zone is selected for the research purpose; these are Valsad, Bharuch, Anand, Sabarkantha, Banaskantha, Bhavnagar, Junagadh and Ahmedabad. Agrometeorology observatories for the selected districts are Navsari, Bharuch, Anand, Khedbrahma, Sardarkrushinagar, Mahuva, Junagadh and Arnej respectively. Weather data used from 1985 to 2015 for Valsad, Anand, Sabarkantha, Banaskantha and Junagadh districts and from 1990 to 2015 for Bharuch, Bhavnagar and Ahmedabad districts. Weekly weather variables used in this study for seven districts
except Junagadh district were basic sun shine hours(BSS), maximum(MAXT) and minimum(MINT) temperature(0C), morning (RH1) and afternoon (RH2) relative humidity (%), morning (VP1) and afternoon (VP2) vapour pressure. Due to unavailability of vapour pressure data for Junagadh district, it was not considered in the research work. The period selected for sowing to harvest of wheat i.e. from 44th to 52nd SMW of selected year to 11th SMW of next year. Weather data and actual yield data are used for the analysis. The actual yield data is used from 1985/1990 to 2012 years as training set and from 2013 to 2015 as validation years.
b. Forecast for wheat – using step wise linear regression
For wheat crop yield forecast linear stepwise regression model was developed by using the methodology described by Ghosh et al., (2014). In 1924 Fisher suggested the crop yield forecast model using composite weather variables. In 1943 Hendrick and Scholl modified the Fisher’s technique and suggested modified model that was extended to study combined effects of weather variables and added time trend variable T. IASRI modified the model of Hendricks and Scholl and suggested modified model (Agrawal et al. 1980, 1983; Jain et al. 1980, Agrawal et al. 1986). The modified model formula was applied for this research purpose and crop yield forecast modes were generated at district level for Gujarat state.
c. Classification Algorithms of WEKA tool
Different classification algorithms applied on weather data using the training set and test set and cross validation options of WEKA. The classifiers in WEKA are calculated to be trained to forecast a single ‘class’ attribute, which is the target for forecast. In this research the target variable is ‘Yield’. Different classification algorithms within WEKA were applied on selected data and algorithms namely Gaussian Processes (GP), Multilayer Perceptron (MLP), Kstar, Sequential Minimal Optimization (SMO), M5Rules and Additive Regression (AR) were selected in this study. These classification algorithms use the different regression techniques and are used for the prediction and forecasting continuous values. GP is a probabilistic method for regression and classification where the distribution is over mean and covariance functions without hyper parameter tuning for the classifier function (C. E. Rasmussen et al. 2004). MLP is a feed forward multi-layer neural network classifier that uses the supervised learning technique of back propagation to classify instances (J. M. Nazzal et al. 2008). MLPs are widely used for classification, pattern recognition, prediction and estimate. SMOreg algorithm implements the Support Vector Machine (SVM) for regression. SVM finds a line that best separates the training data into classes. Additive regression (AR) is a Meta classifier that enhances the performance of a regression base classifier. It’s relying on an underlying Bayesian probability model rather than a pure algorithm.
IV. RESULTANDDISCUSSION
Figure1: Actual and predicted wheat yield from 2012-13 to 2014-15 for selected districts of Gujarat state using step wise regression method
The result from WEKA classification technique algorithm was also studied. For training set the value of R2 ranges from 0.75 to 0.88 for GP, 0.92 to 1.00 for ML, 0.79 to 0.91 for SMOReg, 0.61 to 0.91 for M5Rule and 0.96 to 1.00 for AR algorithms. Algorithms with the higher RMSE for the cross validation result will be ruled out in first instance. RMSE of training set found low compare to cross validation. For most of the districts SMOReg, M5Rule algorithms were ruled out due to
high RMSE. The result of training set shows that the RMSE for GP is higher than the AR and MLP thus GP was also rule out in second instance. MLP and AR have the lowest RMSE and co-relation coefficient is positively correlated with other parameters. Figure 2 shows the R2 of different classification algorithms for selected districts.
Figure2: R2 using WEKA classification algorithms for districts of Gujarat state
Model** - Values predicted using the stepwise regression method The result of actual and predicted wheat yield from
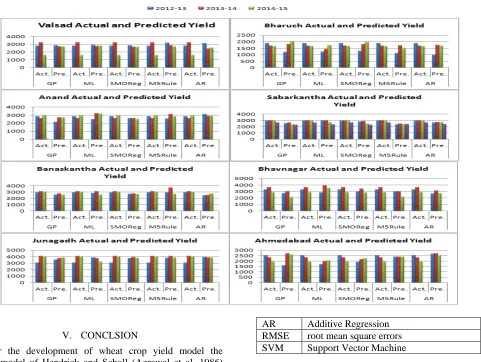
2012-13 to 2014-15 was studied for WEKA classification technique and error percent for MLP algorithm ranges from -75.4 to 15.03% for Valsad, -4.77 to 34.66% for Bharuch, -23.74 to 12.67% for Anand, 0.58 to 11% for Sabarkantha, -3.73 to 14.45
Figure 3: Actual and predicted wheat yield from 2012-13 to 2014-15 for selected districts of Gujarat state using WEKA Algorithms
V. CONCLSION
For the development of wheat crop yield model the modified model of Hendrick and Scholl (Agrawal et al. 1986) has been used for this research work for selected districts of Gujarat state. Different classification algorithms of data mining were applied on the weather data using WEKA tool for crop yield forecast. The performance of different algorithms and statistical forecast model is studied and it is found that the performance of the statistical model and MLP and AR algorithms model was quite better than the other algorithms. Better results can be generated by changing the training and validation year for both statistical model and data mining classification technique.
ABBREVIATIONSANDACRONYMS DM Data Mining
IASRI Indian Agricultural Statistical Research Institute
SMW Standard Meteorological Week SPSS Statistical Package for Social Sciences WEKA Waikato Environment for Knowledge
Analysis
GP Gaussian Processes
AR Additive Regression RMSE root mean square errors SVM Support Vector Machine
REFERENCES
[1] Yunous Vagh. An Investigation into the Effect Of Stochastic Annual Rainfall on Crop Yields in South Western Australia. International Journal of Information and Education Technolog., 2012, Vol. 2, No. 3
[2] S. K. MISHRA, VYAS PANDEY, A. M. SHEKH, S. B. YADAV and H. R. PATEL. Influence of prevailing weather conditions on yield and yield attributes of wheat at Anand. Journal of Agrometeorology. 2014 - 16 (Special Issue-I) : 66-71
[3] Patel Amiksha, Kathiriya Dhaval .R. A data mining perspective of the dual effect of rainfall and temperature on cotton crop yield prediction. International Journal of Advance Research, Ideas and Innovations in Technology. 2018 (Volume 4, Issue 2) : 1252-1259
[4] K. Ghosh, R. Balasubramanian, S. Bandopadhyay, N. Chattopadhyay, K.K. Singh and L.S. Rathore. Development of crop yield forecast models under FASAL- a case study of kharif rice in West Bengal. Journal of Agrometeorology. 2014, 16 (1)m, pp. 1-8
[5] A. K. Giri, M. Bhan and K.K. Agraw. District wise wheat and rice yield predictions using meteorological variables in eastern Madhya Pradesh.
Journal of Agrometeorology. 2017, 19 (4), pp. 366-368.
[6] R.S. Singh, Chandrabhan Patel, M.K. Yadav and K.K. Singh (2014). Yield forecasting of rice and wheat crops for eastern Uttar Pradesh. Journal of Agrometeorology 16 (2): 199-202
[8] C. E. Rasmussen. Gaussian Processes in Machine Learning. Springer-Verlag Berlin 2004, Vol-2004, pp. 63-71
[9] J. M. Nazzal et al.. Multilayer Perceptron Neural Network (MLPs) For Analyzing the Properties of Jordan Oil Shale. World Applied Sciences. 2008, vol. 5, pp. 546-552
[10] Agrawal, Ranjana, Jain, R. C. and Singh, D.. Forecasting of rice yield using climatic variables. Ind. J. Agri. Sci.. 1980, 50(9), pp. 680-684. [11] Agrawal, Ranjana, Jain, R. C. and Jha, M.P.. Joint effects of weather
variables on rice yields. Mausa 1983. 34(2), pp. 177-181.
[12] Ranjana Agrawal. In: Weather based preharvest crop forecasting; weather indices based models; Ch – 5pp.
[13] How To Use Regression Machine Learning Algorithms in Weka? https://machinelearningmastery.com/use-regression-machine-learning-algorithms-weka/ - 05/04/2018
[14] Jiawei Han, Micheline Kamber, Jian Pei. Database Modeling and Design: Logical Design, 3rd edn. Elsevier 2011.
AUTHORS
First Author – Shital H. Bhojani, Assistant Professor-AAU-Anand – PHD Scholar RK University, Rajkot,