Concepts and Methods of Embedding Statistical Data
into Maps
Mohammad Liton Hossain*, Dr.-Ing. Holger Meyer**
*
Computational Science and Engineering, University of Rostock, Germany **Faculty of Computer Science and Electrical Engineering, University of Rostock, Germany
DOI: 10.29322/IJSRP.8.5.2018.p7706
http://dx.doi.org/10.29322/IJSRP.8.5.2018.p7706
Abstract- The main focus of this study is to find appropriate and stable solutions for representing the statistical data into map with some special features. This research also includes the comparison between different solutions for specific features. In this research I have found three solutions using three different technologies namely Oracle MapViewer, QGIS and AnyMap which are different solutions with different specialties. Each solution has its own specialty so we can choose any solution for representing the statistical data into maps depending on our criteria’s.
Index Terms- API, GIS, JDBC, NSDP, Oracle MapViewer,
I. INTRODUCTION
A
map is a very powerful way to present data. It is much more intuitive than presenting the same data in the form of coordinates or text. Using the functionalities of spatial databases, along with other Middleware tools, such spatial applications can be developed that is capable to represent the statistical data into maps in various ways. In this research work a spatial application of a specific country will be designed and developed and it will show statistical data on the map (Bar chart, Pie chart etc.) and also it will show the five different layers of addresses (District, county, sub-county, parish and villages) along with other features.We need to find out some useful and stable solutions for embedding statistical data into maps and Compare the solutions with specific features and finally implement the appropriate solution for the specific country.II. OVERVIEW OF DIFFERENT TECHNOLOGIES
A. Oracle MapViewer
Oracle MapViewer is a very powerful and specialized tool for rendering maps using spatial data managed by Oracle Spatial and Graph or Oracle Locator (also referred to as Locator).MapViewer offers tools that hide the difficulty of spatial data queries and cartographic rendering. It can also deploy in any Java EE container such as web logic server orglass fish or Tomcat [1].
The prime benefit of MapViewer is its incorporation with Oracle Spatial and Graph, Oracle Locator, and Oracle Fusion Middleware. MapViewer cares two-dimensional vector
[image:1.612.370.537.302.410.2]geometries stored in Oracle Spatial and Graph, as well as GeoRaster data and data in the Oracle Spatial and Graph topology and network data models. Oracle MapViewer is also an Open Geospatial Consortium (OGC)-compliant web map service (WMS) and web map tile service (WMTS) server [1].
Figure 1: Basic flow of action in MapViewer [2]
• A Map rendering engine running in Oracle application server: The rendering engine is visible as a servlet that processes requests sent by client demands, draws the proper data from spatial tables, and builds maps in a variety of graphical formats (GIF,PNG, JPEG, or SVG), which it then returns to the asking client. In addition to the core mapping servlet, the Mapviewer server also delivers a map cache server and a feature-of-interest (FOI) server [3].
• Metadata Definitions: The Map definitions/ Metadata are stored in the database. This is the place where we can describe our map such as which table to use, how maps should be rendered (Themes, Styles etc.) [3].
•
Oracle Maps Application Programming Interfaces(APIs): These APIs allow us to retrieve mapviewer features from many different application development environments. These APIs contain XML, Java, PL/SQL and JavaScript (AJAX) interfaces. The Java API also comprises JavaServer Pages (JSP) to ease the insertion of maps in JSP [3].
Oracle MapViewer is a part of Oracle Fusion Middleware. Oracle MapViewer is a complete package for map rendering and display statistical data on the map. The main benefit of Oracle MapViewer is that it can be used both as online as well as offline, because it has a suite of Application Programming Interfaces (API’s) and Oracle Map. Map builder tool is another excellent component of Oracle MapViewer which makes it easy to manage metadata (define styles, themes, base maps) in a spatial database. We can display statistical data in a various way from MapViewer. From map builder tool we can define different advanced styles (Bar chart, Pie chart, Bucket, Heat maps) and themes associated with those styles and then render them as a vector layer on the map. We do not need to depend on other service provider for map rendering because Oracle MapViewer has Oracle Map, which served cached map image tiles to the client. MapViewer provides a nice platform where we can easily define our own map rendering styles, themes etc. using map builder. Oracle MapViewer is not a commercial solution, so that we can use it without any cost.
B. QGIS
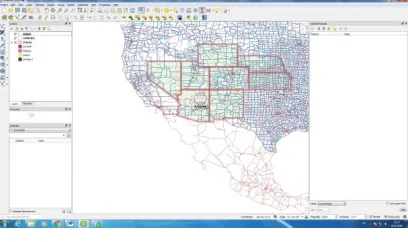
[image:2.612.361.573.407.525.2]QGIS is a software program with a graphical user interface to deploy the functionalities of Geographical Information System (GIS). The QGIS application provides several tools to provide an easy way to display map layers, map legends and so on. QGIS application is free cost tool to work with geospatial data and visualized the geospatial data according to our own requirements. Through QGIS application we are able to work with various spatial databases and display statistical data from database on the map. QGIS can load vector data from different data sources and also from shape files.
Figure 2: QGIS user interface
Geographical Information System (GIS):
Geographical Information System (GIS) is becoming an increasingly important tool in environmental management, retail, military, police, tourism and many other spheres of our daily lives [4]. GIS is more than just software, and it refers to all aspects of managing and using digital geographical data. A common feature of GIS is that they allow us to associate information (non-geographical data) with places (geographical data) [5]. GIS Systems work with many different types of data. Vector data is stored as a series of x,y coordinate pairs inside the computer’s memory and Raster data are stored as a grid of values [5].
A GIS consists of:
• Digital Data –– the geographical information that we will view and analyzed using computer hardware and software [5].
• Computer Hardware –– computers used for storing data, displaying graphics and processing data [5].
• Computer Software –– computer programs that run on the computer hardware and allow us to work with digital data. A software program that forms part of the GIS is called a GIS Application [5].
With QGIS we can use separate shape file to produce vector layers or we can access different spatial databases like PostGIS, SpatiaLite and MS SQL Spatial, Oracle Spatial etc. So it is a database independent solution for our case. We can add different layers for zooming capability with statistical data for each layer. If data is changed in the database then it will depicted within a few seconds in the QGIS browser. QGIS can be used as a WMS, WMTS, WMS-C or WFS and WFS-T client, and as a WMS, WCS or WFS server.
C. AnyMap
AnyMap is a powerful product from AnyChart. AnyChart is a flexible JavaScript (HTML5) based solution that allows developers to embed interactive and great looking charts and dashboards into any web, standalone or mobile project [6]. Whether we need to improve our website with better reporting, embed dashboards into our on-premises and SaaS systems, or build an entire new product, AnyChart covers all data visualization needs. AnyMap is a very useful tool for side-by-side reporting [6].
Figure 3: A simple Map Using AnyMap
[image:2.612.93.297.416.537.2]III. SOLUTIONS FOR EMBEDDING STATISTICAL DATA
A. Embedding and Evaluating Statistical Data into Map using Oracle MapViewer
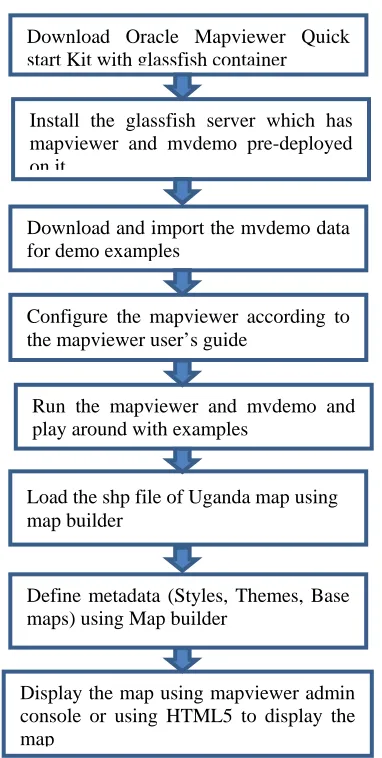
To use Oracle MapViewer we have used glassfish server for quick installation and use the pre deployed MapViewer and mvdemo data. For map rendering we need to create styles, themes and base maps using map builder which is used to define Meta data into database. In this solution we do not need to depend on third party map provider i.e. we can depend on our own data and also we can work offline as well as including our statistical data into map along with different features.
[image:3.612.323.555.75.203.2]A work flow that we have used here is given bellow:
Figure 4: Work flow of MapViewer implementation
To evaluate Oracle MapViewer with our requirements we will use the data set for and also use statistical data for USA states, cities. As we have prepared data and configured MapViewer, now we can use MapViewer to explore some key features from our requirements:
Display Map with Bar Chart
[image:3.612.43.234.215.594.2]To represent statistical data as Bar Chart into map I have used Non-Spatial Data Provider (NSDP) mechanism tojoin the results of a database query (i.e. a JDBCvector layer) with content in an xml document and display it.
Figure 5: Visualization of statistical data using NSDP mechanism
Display map with variable Buckets
[image:3.612.317.581.317.465.2]To display the variable buckets i.e. different county colors based on the total population of that county we need to create an advanced style (variable buckets) from map builder and then assign that style to a theme and then we can use it as a predefined vector layer.
Figure 6: Visualization of static data with variable range bucket
Reflecting the metadata changes into the map
The tile layers that we have created using map viewer admin console those tile layers are managed by the map tile server which is a part of Oracle MapViewer. When a client is requesting for a map then map tile server fetches the requested tile image and store them and returns to the client.
Oracle maps have three dissimilar choices for storage the map image tiles [7]:
• Store the tiles using the local file system
• Store the tiles in a database table. (currently not used)
• Stream the tiles directly without caching
I have used Stream without caching and it’s simply solved the update problems. That means if we change anything in the underlying database or metadata (Themes, base maps) then the change will be depicted in a minute.To do this task, we need to set the persistent_tiles attribute false in MapViewer while creating a new tile layer. After making the tile layer as stream without caching, now if we change anything in the database that related with this tile, the change will be depicted.
Download Oracle Mapviewer Quick start Kit with glassfish container
Install the glassfish server which has mapviewer and mvdemo pre-deployed on it
Configure the mapviewer according to the mapviewer user’s guide
Download and import the mvdemo data for demo examples
Run the mapviewer and mvdemo and play around with examples
Load the shp file of Uganda map using map builder
Define metadata (Styles, Themes, Base maps) using Map builder
Figure 7: After changing the state abbreviation
B. Embedding and Evaluating Statistical Data into Map using QGIS
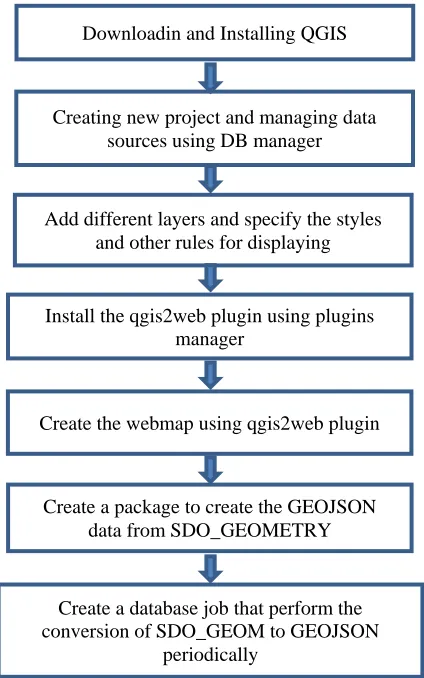
[image:4.612.375.573.118.233.2]To deploy our requirements with QGIS application we will follow the work flow diagram as bellow:
Figure 8: Work flow of QGIS implementation
Web map using qgis2web plugin
Qgis2web generates a web map from our current QGIS project so we can publish our project as a web map using qgis2web plugin. To publish a the layers as a web map we need to navigate:
Save current project click web menu
select qgis2web menu
select Create web mapselect the necessary properties from the
following wizard select update preview
select export
[image:4.612.55.267.279.618.2]When we have completed export successfully then the exported map is saved in the default location.
Figure 9: A web map using qgis2web plugin
Create a package to convert SDO_GEOMETRY into GEOJSON
So far we did not use any QGIS server or geoserver, we just simply create the map and used qgis2web plugin to published the map.qgis2web plugin create a folder and store all resources to generate the map separately so that this folder is isolated from QGIS and we can use that folder anywhere and run the html file to access the map. So if we change any data in the database then the change will not take effect until we create a new web map using qgis2web plugin manually. But one of our main requirements is to update the map automatically after any changes in the backend database. We have three JavaScript files which contain GEOJSON data. Our purpose is to update this data source if any changes happen in the database because we need to display the statistics data into map which are rendered from these data source and other rendering resources will remain the unchanged. To make these things happen we need to build a package which will be responsible for converting the SDO_GEOMETRY data into GEOJSON array from database along with statistical data as properties. To execute the package we need to run the following files [8]:
SQL>@ora2geojson.pkh SQL>@ora2geojson.pkb
After running these two files we can make a query to run the package and get the GEOJSON output from a specific table as follow [8]:
SELECT ora2geojson.sdo2geojson('select * from states',Rowid, GEOM) FROM states;
Where ‘states’ is the spatial table or view and GEOM is the name of the spatial column. The ROWID is needed to collect the attributes.
The output from the above query is looks like:
Figure 10: GEOJSON output from the package Downloadin and Installing QGIS
Creating new project and managing data sources using DB manager
Install the qgis2web plugin using plugins manager
Add different layers and specify the styles and other rules for displaying
Create the webmap using qgis2web plugin
Create a package to create the GEOJSON data from SDO_GEOMETRY
Create a database job that perform the conversion of SDO_GEOM to GEOJSON
C. Embedding and Evaluating Statistical Data into Map using AnyMap
To deploy our requirements using AnyMap we need to download AnyChart installation package from
https://www.anychart.com/download/products/ .
[image:5.612.347.555.123.240.2]We can also use AnyMap without downloading the installation package. To continue our work we have followed a working flow diagram as follow:
Figure 11: Work flow of AnyMap implementation
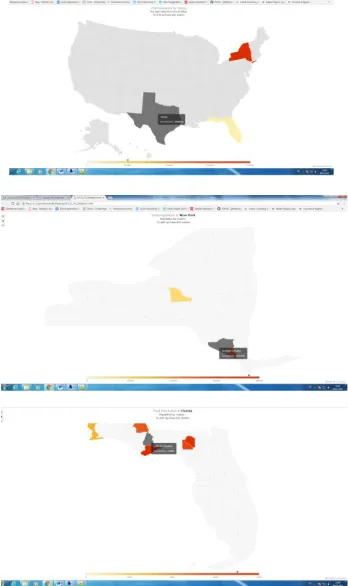
Drilldown Map
To achieve the zooming capability we have to use drilldown map in AnyMap. In our case we have used statistical data for three states and visualized them with drilldown capabilities from AnyMap. To do this we have created two JavaScript file that contains functions that returns the statistical data for that specific states and counties.
Figure 11: Different stages of Drilldown Map
Dashboard
To represent the statistical data into map using AnyMap we have to use dashboard technique which will display statistical data into map as a chart or combo box. We can achieve the output as follow [9]:
Figure 12: Dashboard in AnyMap
IV. CONCLUSION
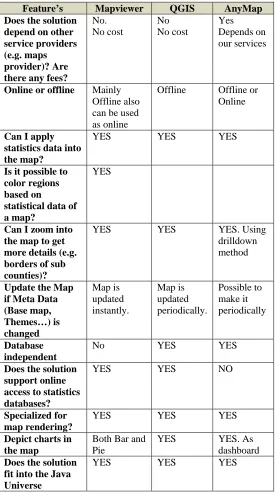
MapViewer is a very powerful and specialized solution for map rendering from Oracle spatial database with statistical data. QGIS is another GIS tool to make maps from different spatial databases or from single shape files with statistical data. AnyMap is a JavaScript solution to represent the map from data files not directly connected to the database. To determine the best solution I have compared every solutions with each other based on important criteria’s. I have described the comparison details in table no. I bellow. From the comparison I would like to prefer that the solution using Oracle MapViewer might be one of the best solutions depending on the features and special criteria’s. Compare with Oracle MapViewer the QGIS tool is easier to use and it’s relatively simple to handle. Oracle MapViewer is a specialized tool for representing statistical data into map and works with spatial data. One major disadvantage is that it is not database independent. More details for each solution is given in the table I.
Download AnyChart Installation Package
Create Data Sorces
Adding required JavaScript files for display a map
[image:5.612.48.248.158.297.2] [image:5.612.77.251.410.703.2]Table I: Comparison between three solutions based on important features
ACKNOWLEDGMENT
At first all thanks goes to almighty creator who gives me the opportunity, patients and energy to complete this study. I would like to give thanks to Dr.-Ing. Mayer of the Faculty for Informatics and Electrotechnic at University of Rostock and Mr. Schippmann of the Mühlbauer ID Services, I have found always immense support from them to keep my work on the right way.
Their doors were always open for me, when I have got myself in trouble.
I would also like to give thanks to Ulf who is a professionally adroit to guide me throughout my work. Without his passionate participation and input, my research could not have been successfully conducted.
Finally, I must express my very profound gratefulness to my parents and to my wife for providing me with constant support and encouragement during my years of study and through the process of researching and writing this paper. This accomplishment would not have been possible without them. Thank you.
REFERENCES
[1] Fusion Middleware User's Guide for Oracle MapViewer, “Introduction to MapViewer” available on-line at
https://docs.oracle.com/middleware/1213/core/JIMPV/ vis_start.htm#JIMPV1000
[2] Exploring Spatial, “MapViewer Componenets”, available on-line at
https://exploringspatial.wordpress.com/2014/05/25/is-oracle-mapviewer-a-fit-for-me/
[3] Ravi Kothuri, Albert Godfrind, Euro Beinat, Defining Maps Using MapViewer. In: Pro Oracle Spatial for Oracle Database 11g. Apress,
Apress, 2007,
ISBN: 978-1-59059-899-3
[4] A Gentle Introduction to GIS, “Preamble” , available on-line at
https://docs.qgis.org/2.18/en/docs/gentle_gis_introduction/preamble.html
[5] A Gentle Introduction to GIS, “Introducing GIS” , available on-line at
https://docs.qgis.org/2.18/en/docs/gentle_gis_introduction/introducing_gis.html
[6] AnyMap, “Overview”, available on-line at
https://www.anychart.com/products/anymap/overview/
[7] Fusion Middleware User's Guide for Oracle MapViewer, “Map Tile Server”, available on-line at
https://docs.oracle.com/middleware/1213/core/JIMPV/ vis_omaps.htm#BACJGEFA
[8] Mapoholic, “Convert Oracle Spatial data to geojson”, available on-line at
https://mapoholic.wordpress.com/2015/08/30/convert-oracle-spatial-data-to-geojson/
[9] AnyMap, “Maps Gallery”, available on-line at
https://www.anychart.com/products/anymap/gallery/Maps_in_Dashboard/St ates_of_United_States_Dashboard_with_MultiSelect.php
AUTHORS
Author – Mohammad Liton Hossain, M.Sc in Computational Science and Engineering in University of Rostock, Germany. Lecturer at Institute of Science and Technology (IST), Bangladesh. E-mail: [email protected]
Corresponding Author - Dr.-Ing. Holger Meyer is Chair of Database and Information Systems at University of Rostock. E-mail: [email protected]
Feature’s Mapviewer QGIS AnyMap
Does the solution depend on other service providers (e.g. maps provider)? Are there any fees?
No. No cost No No cost Yes Depends on our services
Online or offline Mainly Offline also can be used as online
Offline Offline or Online
Can I apply statistics data into the map?
YES YES YES
Is it possible to color regions based on
statistical data of a map?
YES
Can I zoom into the map to get more details (e.g. borders of sub counties)?
YES YES YES. Using
drilldown method
Update the Map if Meta Data (Base map, Themes…) is changed Map is updated instantly. Map is updated periodically. Possible to make it periodically Database independent
No YES YES
Does the solution support online access to statistics databases?
YES YES NO
Specialized for map rendering?
YES YES YES
Depict charts in the map
Both Bar and Pie
YES YES. As
dashboard
Does the solution fit into the Java Universe
![Figure 1: Basic flow of action in MapViewer [2]](https://thumb-us.123doks.com/thumbv2/123dok_us/9072590.979282/1.612.370.537.302.410/figure-basic-flow-action-mapviewer.webp)