OCT-NOV, 2012, Vol. – I, Issue-III www.srjis.com Page 329 CHALLENGES AND PROSPECTS IN ACCESS TO QUALITY BASIC EDUCATION BY
PHYSICALLY CHALLENGED PUPILS IN KENYA
Bota K. N,
Lecturer, Masinde Muliro University of Science and Technology, Kenya
Maiyo J. K .
Lecturer, Masinde Muliro University of Science and Technology, Kenya
Kunusia W
Lecturer, Teachers Service Commission, Kenya
Received: 24 October 2012 Accepted: 21 November 2012
One of the objectives hinged on and aimed to be achieved by the Special Needs Education (SNE) policy framework in Kenya is to promote quality, relevant and holistic education in ALL institutions for learners with Special Educational Needs (MoE, 2009). The study was aimed to investigate the emerging challenges and prospects of access to quality basic education by the physically challenged (PC) pupils in mainstream and special schools in the 21st century in Kenya. The study adapted the descriptive cross-sectional survey research design. The study population consisted of 6 Head teachers, 36 teachers and 109 non-disabled pupils. Simple random and purposive sampling methods were used to select the study sample. Questionnaires, observation schedule and document analyses were used for data collection. Data was analyzed by use of descriptive and inferential statistics. Data was presented using tables, bar graphs and charts. The significance of the study anchored on the Kenya Government goal on SNE and as entrenched in the vision 2030 of providing a globally competitive quality education. The study established that the emerging challenges that hamper provision of quality basic education to the PC included inadequate physical facilities, inadequate special education teachers, poor learning environment, inadequate teaching and learning resources particularly text books in mainstream schools and negative attitude towards the PC. In terms of curriculum implementation, the use of individualized education programmes (I.E.P) was never applied. Further evidence revealed that teachers never prepared adequately. Head teachers placed a lot of emphasis on academic performance in terms of mean scores. Finally, the attitude of non-disabled pupils towards integration with their PC peers was established to be positive. The study recommends that greater emphasis should be placed on programs which aid the pupils in the transition from school to the world of work. The physical, social and learning environment should be improved and sensitization for attitude change should further be enhanced. Gender disparity need to be further addressed to enhance equality in access to basic education.
OCT-NOV, 2012, Vol. – I, Issue-III www.srjis.com Page 330 Background of the study
Basic education is the primary object of any plan of development (Bishop, 1995).
Education is a basic human need (World Bank, 1980). Education is a strong tool through which
people acquire knowledge, enforce positive attitudes and perceptions, and help acquisition of
necessary skills, while at the same time maintaining cultural identity and dignity. In Kenya,
education is regarded as a critical human capital for national development. From a humanistic
point of view education is a valued goal which on the grounds of equity should not be withheld
from anyone (Sifuna and Karugu, 1998).
However, studies about the rates of enrollment in special schools and programmes hat
childrens indicate that children with disabilities are grossly under-enrolled (RoK, 1998). For
example, a Study by Every Child Counts (ECC) a non-governmental organization indicated that
even after the inception of Free Primary Education (FPE) programme in 2003 in Kenya only
22,332 out of 600,000 children with disabilities had access to primary education compared to
non-disabled. Accordingly the enrolment has risen only to about 36,239 (RoK, 2009). This
enrolment is still very low as the same source states.
The MOE (2008) cites a number of challenges it faces in its effort to address barriers to
education for children with special needs. These are issues relating to access, equity, quality,
relevancy, attitude among others (RoK, Ibid). Whereas this situation gives a general scenario of
SNE in Kenya, it is the assumption of the researcher that remarkable improvement should have
been made since the inception of FPE both in general education and SNE institutions. This is
premised on the fact that every pupil through the schools receives financial support from the
government (MEO, 2008). Western Province in Kenya has not been spared with the challenges
facing SNE. Some of the challenges may just be perceived to be so. More particularly the
challenges are assumed to affect all groups of learners with special needs in education. It is out
of this background that this study was developed to establish the factors that affect access to
quality primary education by the physically changed in mainstream schools and integrated
programmes in Kakamega and Bungoma Counties of Western Province.
The MOEST (2004) statistics just like the CESA report indicate that there are an
estimated 750,000 children with disabilities. An estimated 90,000 have been identified and
accessed according to the same source. It further states that only 14,614 are enrolled in
OCT-NOV, 2012, Vol. – I, Issue-III www.srjis.com Page 331 integrated in regular school. This implies that over 90 percent of handicapped children are either
at home or in regular schools with little or no specialized assistance as the same source further
notes.
Many factors and challenges do exist that relate to access, equity and quality in the
provision of Special Needs Education (RoK, 2005). These arise out of ignorance, attitudes,
culture and poverty. The report further states that lack of clear policies and legislation,
inadequate tools and skills for identification and assessment, inappropriate curriculum suitable
for special needs learners and inadequate teachers’ capacity are among other factors that affect
access. Besides, the situation is exacerbated by the inappropriate home and school environment,
poor co-ordination among service providers and inadequate and expensive teaching and learning
materials (RoK, 1999). The International Conference on Education (1990) held in Jomtien
(Thailand) identified resources for education both financial and human as being very essential
for development of basic education. Among the identified resources, the most critical are
finances.
Furthermore, the rigid curriculum characterized by the mean scores in examinations does
not take into consideration the needs of the learners in this category (RoK, 1999). Architectural
barriers also hinder and limit access. For many children, a disability leads to rejection, isolation
and discrimination, hindering their psychological development. This is an aspect of attitude
towards children with special needs (RoK, 2005). It is expected that the FPE programme has
helped to alleviate some of the problems that might hinder access to quality education. It is out of
this background that this study was developed to investigate factors that affect access to quality
primary education by the physically challenged in mainstream schools and integrated
programmes in Western Province of Kenya.
Objectives of the study
The study focused to achieve the following objectives:
i) To determine the enrolment of the PC pupils in the schools and integrated
programmes.
ii) To establish the emerging challenges of access to quality basic education by the
OCT-NOV, 2012, Vol. – I, Issue-III www.srjis.com Page 332 Research Design
The study adopted a descriptive cross sectional survey method. According to Cohen &
Lawrence (1995), a descriptive study gathers data at a particular point in time with an intention
of describing the nature of existing conditions or identifying standards against which existing
ones can be compared or determine relationships that exists between specific events.
Sampling techniques and research sample
The research sample was drawn from six schools. The schools were purposively selected
from the districts named. Three special schools for the PC and three mainstream schools that
have integrated units for PC. Respondents included head teachers, subject teachers (Maths,
English/Kiswahili and Physical education) and selected non-disabled PC pupils. A sample of
three subject teachers in class seven and eight were purposively selected from each school,
implying a total of thirty six (36) teachers.
[image:4.612.69.541.209.504.2]This is presented in table 1
Table 1: Target population
Categories Target Number Sample
Head teachers 6 6
Subject teachers 106 36
Pupils 404 120
Sample size 516 142
Simple random sampling method was used to select ten pupils from class seven and eight
in each school one hundred and twenty pupils were used for this study.
Instrumentation
The study used the following instruments for data collection: questionnaires, observation
schedule, and document analysis guide.
Results and Discussion
Enrolment of the PC pupils in special schools and integrated units
For the purpose of this study the schools were identified in each category as follows: Special
Schools A, B, and C; integrated units (programmes) D, E and F. The results are presented in
OCT-NOV, 2012, Vol. – I, Issue-III www.srjis.com Page 333 Table 2: Enrolment of pupils in special schools and integrated units
School type No. of boys
(F) %
No. of girls
(F) %
TOTAL
(F) %
Special A Special B Special C 42 73 56 24.6 42.7 32.7 36 67 47 24.0 44.7 31.3 78 140 103 24.0 44.7 31.3
Subtotal 171 100.0 150 100.0 319 100.0
Integrated D Integrated E Integrated F 18 08 12 47.7 21.0 31.6 10 16 08 29.4 47.1 23.5 28 24 20 38.9 33.3 27.8
Subtotal 38 100.0 34 100.0 72 100.0
Grand Total 209 53% 184 47% 393 100%
F - Frequency
From table 3 above, it can be observed that 209 (53%) of the total PC pupils enrolled in the
schools are boys, while 184 (47%) are girls. It may also be observed that a majority, 319 (81%)
of the total PC pupils are enrolled in special schools as compared to 72 (19%) PC pupils who are
enrolled in mainstream schools with integrated units or programmes. It can be noted from the
table that, generally, more boys than girls with PCs are enrolled in the schools. From these
findings, it seems parents with or of pupils with PCs and others with SEN prefers taking them to
special schools than mainstream schools with integrated units. This situation is evidently in
agreement with Muuya (2001) who posits that three quarters of Kenyan pupils with SEN are in
special schools with only a quarter in integrated special units within mainstream schools. Lynch
(2001) cites access and enrolment of pupils with SEN as among the challenges of developments
in theory, policy, and practice of integration.
Emerging challenges
School challenges that affect planning, management and provision of quality primary education to PCs.
This section presents findings under the following aspects and discussion: physical facilities,
integration, school environment, teachers’ preparation, para-professional support, curriculum and
other factors that affect provision of quality education to the PC.
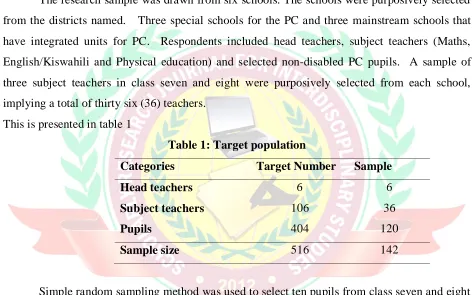
[image:5.612.67.548.97.573.2]OCT-NOV, 2012, Vol. – I, Issue-III www.srjis.com Page 334 Observations of the physical facilities were done. The findings are presented in figure 1
Figure 1: Physical facilities available and their conditions
One hundred and ten (100%) classroom observed were permanently built and have plastered
walls. One hundred and six classrooms (96.4%) are in good condition. One hundred and ten
(100%) classrooms have cemented floors. One hundred and ten (100%) classrooms have
adequate ventilation and furniture. Eighty (72.7%) classrooms have lockable windows and doors.
Furthermore, one hundred and nine (99.1%) classrooms have suitable furniture for use by the PC
pupils, except in one case (0.9%) in which one of the PC classroom was made to lie flat on the
floor due to her severe physical challenges. This is the position she remained in even while
writing.
All the six schools (100%) had suitable and enough toilets for use by both boys and girls. For
example they have wide doors which allow easy movement for those PC pupils who are wheel
-chair bound and have suitable apertures.
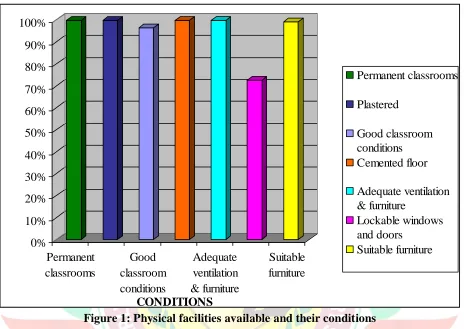
Observation of school playgrounds was also done. Four (66.67%) of the schools had enough
playgrounds which were suitable for use by the PC. However, two ( 33.33%) of the schools had 0%
10% 20% 30% 40% 50% 60% 70% 80% 90% 100%
Permanent classrooms
Good classroom conditions
Adequate ventilation & furniture
Suitable furniture
Permanent classrooms
Plastered
Good classroom conditions Cemented floor
Adequate ventilation & furniture
Lockable windows and doors
Suitable furniture
OCT-NOV, 2012, Vol. – I, Issue-III www.srjis.com Page 335 Holes in the pitch
PHYSICAL FACILITIES
0% 10% 20% 30% 40% 50% 60% 70% 80% 90% 100%
Psycho-motor Equipments
Orthopeadic Equipment
Hostels Dinning hall Workshop &
Library
Psycho-motor Equipments Orthopeadic Equipment Hostels
Dinning hall Workshop & Library
P
ER
C
EN
TA
G
E
playgrounds that were not suitable for use by the PC since they had deep holes and ragged
surfaces, a condition that was not only risky but also dangerous to the PC, see figure 2.
Figure 2: Playgrounds for School B
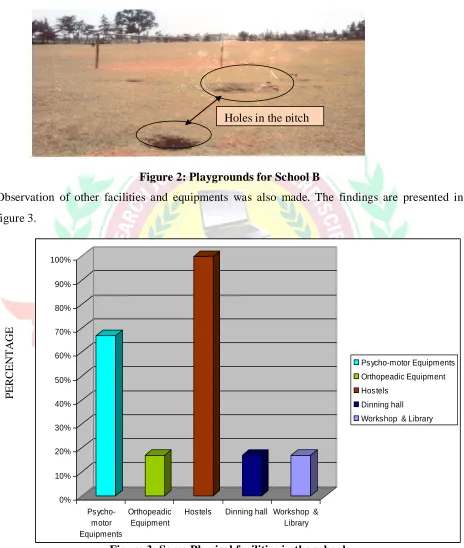
Observation of other facilities and equipments was also made. The findings are presented in
[image:7.612.76.540.115.663.2]figure 3.
OCT-NOV, 2012, Vol. – I, Issue-III www.srjis.com Page 336 As regards physical equipments, as can be observed in figure 3, four (66.67%) of the schools had
psycho-motor equipments available. These included comfort beds, swings, slides, parallel bars,
static bikes among others. One (16.67%) school had orthorpaedic equipments. Through
observation, all the six (100%) schools had hostels for both boys a nd girls. Each school has a
dining hall. One (16.67%) school had a workshop, library, resource room, computer room, and
dispensary and physiotherapy room. Five (83.33%) of the schools did not have these facilities.
The assessment of the physical facilities and learning resources, physical surrounding of the
school was also very important to the study because they have apart to play in the child’s
learning. Bennars, Otiende and Boisvert (1994) support this idea. They concur that the physical
facilities include where the school is build and also the lay out of the classrooms. If the school is
old and run down it will affect the pupil’s learning. For instance, if there are leaking roofs, the
pupils as well as the teacher are disturbed.
Additionally, learning facilities such as books, stationery, a library, workshop, equipments and
tools, must be available to facilitate the pupil’s learning. Bennars, Otiende and Boisvert (ibid)
conclusively are of the idea that pupils will be motivated to learn when these facilities are
satisfactorily provided.
One school (16.67%) had a resource room, library, physiotherapy room, computer room,
workshop and dispensary. The rest of the schools (83.33%) did not have these facilities.
The assessment of the physical facilities and learning resources, physical surroundings of the
school was also very important to the study because they have a part to play in the child’s
learning. Bennars, Otiende and Boisvert (1994) support this idea. They concur that the physical
facilities include where the school is built and also the lay out of the classrooms. If the school is
old and run down it will affect the child’s learning. For instance if there are leaking roofs, the
children as well as the teacher are disturbed.
Additionally, learning facilities such as books, stationary, a library, workshop, equipments and
tools. Must be available to facilitate the children’s’ learning. Bennars, Otiende and Boisvert
(Ibid) conclusively are of the idea that children will be motivated to learn when these facilities
are satisfactorily provided.
Integration
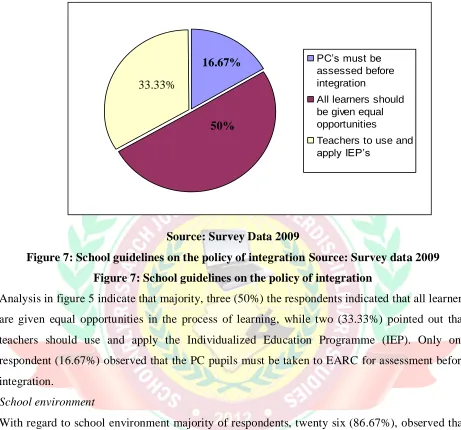
The school guidelines on the policy of integration were established. The data is presented in
OCT-NOV, 2012, Vol. – I, Issue-III www.srjis.com Page 337 Source: Survey Data 2009
Figure 7: School guidelines on the policy of integration Source: Survey data 2009 Figure 7: School guidelines on the policy of integration
Analysis in figure 5 indicate that majority, three (50%) the respondents indicated that all learners
are given equal opportunities in the process of learning, while two (33.33%) pointed out that
teachers should use and apply the Individualized Education Programme (IEP). Only one
respondent (16.67%) observed that the PC pupils must be taken to EARC for assessment before
integration.
School environment
With regard to school environment majority of respondents, twenty six (86.67%), observed that
the school environment is friendly and suitable for the learning of PC pupils. This was evident
from some of the physical facilities observed which were available like permanent classrooms;
dormitories for the case of boarding, dining halls, playgrounds, toilets among others. This may
be in recognition with Farrant’s (2002) assertion that a well built school is not a luxury but a
necessity because the school provides an environment for all who use it which affects positively
their tests morale and happiness. Tiedman and Faber (1990) as quoted in Bota (Ibid) agree that
the school environment is seen as a social setting, its general success is enabled through the
setting of sound learning aims, valuing of school performance, encouraging and guaranteeing
self reliance among learners and working in close cooperation with parents. It is in this regard
that the researcher also sought to investigate other aspects of school environment like teaching
PC’s must be assessed before integration
All learners should be given equal opportunities
Teachers to use and apply IEP’s
33.33%
OCT-NOV, 2012, Vol. – I, Issue-III www.srjis.com Page 338 strategies which directly affects the quality of education provided. Some of the teaching
strategies as eluded by teachers are presented in table 3.
Tables 3: Environmental factors that affect learning of PC pupils
Teaching Strategies Frequency Percent
Regular testing to determine academic performance
Encouraging learners to assist each other
Daily check up of pupils’ work
Regular remedial lessons
Using teaching learning aids
Use of IEP
7
5
5
2
3
8
23.33
16.67
16.67
6.67
10.00
26.66
TOTAL 30 100.00
From table 3, seven (23.33%) respondents indicated regular testing to determine academic
performance as their teaching strategy for the PC. Five (16.67%) indicated encouragement of all
pupils to assist one another as their strategy. Five (16.67%) indicated daily checking of the
pupil’s work. Two (6.67%) indicated regular remedial lessons as their strategy. Three (10%) of
the respondents indicated the use of teaching, learning aids while Eight (26.66%) indicated the
use of individualized education programme (IEP).
As regards general treatment of the PCs, twenty teachers (83.33%) observed that there is no staff
discrimination against PC children. However, four (16.7%) of the respondents claimed that there
is staff discrimination against PC children. This is because they are not provided with physical
education (PE) activities hence they remain as mere spectators during PE lessons. The
respondents further noted that they are not properly assessed and placed as one teacher retorted.
This was also noted from one of the teachers especially trained to handle the PC who said
whenever the pupils failed to accomplish any tasks successfully, notably academic based,
reference would be made to these pupils calling them “his pupils” had led them down again. In
relation to this perception by teachers it may be worth noting that quality of education and
enjoyment as a basic human right may be affected. Otiende and Njoroge (2001) agree with this
notion that quality of education falls in schools and enjoyment of the same is reduced.
Teachers’ preparation and teaching process
Another aspect of the environment which was very important to the study, was teachers
OCT-NOV, 2012, Vol. – I, Issue-III www.srjis.com Page 339 regarding these records, the researcher observed practical lessons presented in class by teachers,
with an aim of establishing how effective they were used and utilized. Data elicited from
document analysis guide showed that twenty three (76.67%) of the teachers had schemes of
work. Only one teacher (8.33%) out of the twelve teachers who taught physical education had
schemes of work for adapted physical education are regards lesson plans, it was revealed that
only six (20%) of the teachers had them and prepared them regularly for each lesson. Eighteen
teachers (60%) of the teachers indicated and used the blackboard, chalk, pens, text books, and
exercise books as their teaching aids.
It was evident from this scenario that teachers may have never thought of appropriate visual aids,
audio or audio visual aids for use during the lesson presentation. Although some of the teaching
aids displayed on the internal classroom walls they seemed not to be in use due to their bad
conditions.
This is in sharp contrast with Bennars, Otiende and Boisvert (Ibid) teachers should not rely on
the use of words only to explain ideas, facts and concepts. The use of teaching aids makes
teaching/learning both lively and interesting to the students as they further argue. Nceeri (1996),
Fuller (1992) and Atsenga (2002) agree that effective teaching methods impacts positively on
learning.
Para-professional support
Under the internal school factors that affect planning, management and provision of quality
primary school education, the study also sought to establish whether the schools had any para
-professionals available to offer their services to the PC children. Data elicited indicated that none
of the schools had any full time para-professionals. Only two schools (33.33%) had mobile
physiotherapists (PT) who visited the school twice a week. One school (16.67%) had a clinical
nurse employed by the MOEST. This happens to be the only school that had a dispensary as
noted during observation schedule. PC participation in non-academic areas is in line with the
state and federal special education laws that not only require students with disabilities to be
educated appropriately with their regular education peers, but also participate in non-academic
and extra curricular activities (Federal register, March 12, 1999). The same source agree with the
idea that use of a para-professional is one support or service that may permit a student to achieve
OCT-NOV, 2012, Vol. – I, Issue-III www.srjis.com Page 340 GOOD
AVERAGE
83.33% 16.67%
The aspect of curriculum implementation was also important to the study. As cited earlier in this
study, SNE involves more than the processes of teaching and learning (ROK, 1999). Data
accrued in the study from the teachers highly indicated that all teachers believed in regular
testing and examinations. This was aimed at academic perfection. In line with this four head
teachers (66.67%) had the respective schools mean scores in K.C.P.E displayed in their offices.
In some classes too, class mean scores for the various evaluation tests that had been done were
also indicated.
Academic performance, of PCs as is common practice in schools and institutions of learning was
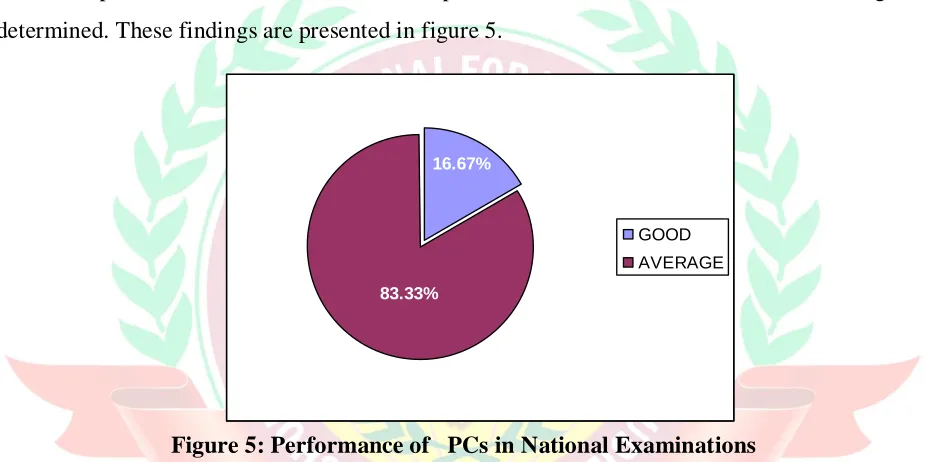
[image:12.612.74.537.235.466.2]determined. These findings are presented in figure 5.
Figure 5: Performance of PCs in National Examinations
From figure 5, it can be noted that, five head teachers (83.33%) averred that the performance of
PC pupils in national examinations in the past three years was average. One head teacher
(16.67%) said the performance was below average. The aspect of using examinations as a
measure of education quality is consistent with Muola (1990) who posits that examinations have
been accepted by educationist and other stakeholders as an important aspect of an educational
system. He further says that examinations have always been used as the main basis for judging
students ability also as a means of selection for educational advancement and employment.
As regards non-academic areas that the PC pupils are involved in, five (83.33%) head teachers
indicated that they do participate in co-curricular activities that majorly included ball games,
athletics and music. One respondent (16.65%) whose school happens to have a sheltered
workshop indicated that some of the PC pupils, who can fairly endure, are trained in carpentry,
OCT-NOV, 2012, Vol. – I, Issue-III www.srjis.com Page 341 education on electrical installations, wood work or metal work would be expected to fit into the
world of work upon completing school. However, the ministry reiterates that this can only
happen if the right “quality and quantity” of education has been offered to the learner. Practical
education offered in very little doses may not assist the pupil to acquire adequate skills to fully
participate in the world of work (MOE, 2004).
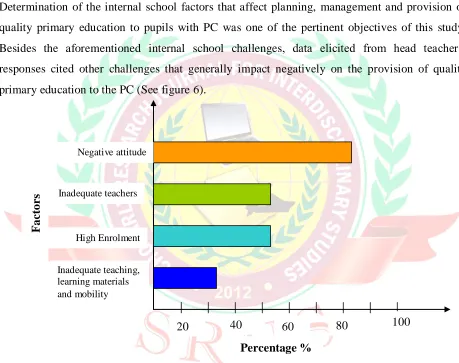
Other challenges that affect provision of quality education to the PC’s
Determination of the internal school factors that affect planning, management and provision of
quality primary education to pupils with PC was one of the pertinent objectives of this study.
Besides the aforementioned internal school challenges, data elicited from head teachers’
responses cited other challenges that generally impact negatively on the provision of quality
[image:13.612.73.532.202.565.2]primary education to the PC (See figure 6).
Figure 6: Other factors affecting provision of quality education to the PC
It can be observed from figure 6 that five head teachers (83.33%) believe that parents, teachers
and peers have negative attitude towards the PC. Three (50%) of the head teachers observed that
there is inadequate teaching staff in the schools. Three (50%) cited high enrolment and two
(33.33%) identified inadequate teaching/learning materials and mobility aids. Indeed,
observations during the study, confirmed this dilapidating situation of overcrowded classes,
inadequate teaching and learning materials, see figure 7.
20 40 60 80 100
Inadequate teaching, learning materials and mobility
High Enrolment Inadequate teachers
Negative attitude
Percentage %
F
a
c
to
r
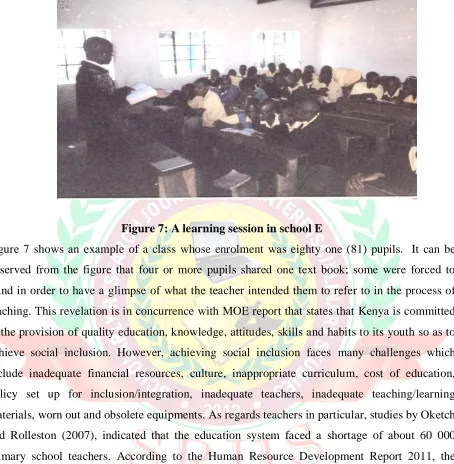
OCT-NOV, 2012, Vol. – I, Issue-III www.srjis.com Page 342 Figure 7: A learning session in school E
Figure 7 shows an example of a class whose enrolment was eighty one (81) pupils. It can be
observed from the figure that four or more pupils shared one text book; some were forced to
stand in order to have a glimpse of what the teacher intended them to refer to in the process of
teaching. This revelation is in concurrence with MOE report that states that Kenya is committed
to the provision of quality education, knowledge, attitudes, skills and habits to its youth so as to
achieve social inclusion. However, achieving social inclusion faces many challenges which
include inadequate financial resources, culture, inappropriate curriculum, cost of education,
policy set up for inclusion/integration, inadequate teachers, inadequate teaching/learning
materials, worn out and obsolete equipments. As regards teachers in particular, studies by Oketch
and Rolleston (2007), indicated that the education system faced a shortage of about 60 000
primary school teachers. According to the Human Resource Development Report 2011, the
country needs 52,335 more teachers in primary schools. This scenario highly compromises the
quality of education. This is a challenge that the government should continue to address.
Conclusion
On the strength of the research findings, whereas observation revealed that most schools had
major physical facilities, they lacked other specific and important ones like workshops for
training of the PC in life skills. Lack of such facilities implied that and is an indicator that
practically the primary school curriculum implementation is still academic oriented. Given this
OCT-NOV, 2012, Vol. – I, Issue-III www.srjis.com Page 343 likely not to access relevant and quality education. The existence of some physical facilities like
play grounds that were barrier free is one aspect of internal school factors that affect provision of
quality primary education. Teaching/learning resources especially text books were also found out
to be inadequate especially in mainstream schools, hence making the teaching learning process
difficult.
Recommendations
In order to improve the provision of quality primary education with the PC the research study
made the following recommendations:-
1) Sensitization on gender disparity of the PCs should be addressed. In particular, the
education of the PC girl child should be emphasized.
2) The physical and learning environment especially in mainstream schools should be designed
to meet the specific needs of PC pupils and subsequently pupils with other special needs in
education.
References
Atsenga, M. (2002). Factors affecting the teaching of oral communication in English language in Secondary schools of Kakamega and Vihiga Districts of Kenya. Unpublished M.ed. Thesis, Egerton University Njoro.
Bishop, G. (1995). Curriculum Development, A text book for students; London, Macmillan Education Publishers.
Bota, K. (2007).Grade Repetition in Kenyan Primary Schools. Issues of Learning Disabilities; Lit Verlag; Munster.
Farrant, J.S. (2002). Principles and Practice of Education. Singapore. Longman Group UK. Fuller, B. (1986). Raising quality in developing countries: What investments boost learning?
Washington DC: The World Bank
MOE. (2008). Data on Special Needs in Education. Nairobi MOE MOEST (2005), Educational Statistics Nairobi: MOEST
Muola J. M (1990). The Effect of Academic Achievement, motivation and home environment on academic performance among standard Eight Students. Unpublished Masters Thesis Kenyatta University Kenya
Oketch, M. & Rolleston, C. (2007). Policies on free Primary and Secondary Education in East Africa: Retrospect and Prospect, Review of research in Education, 31 (131-158) Otiende J. & Njoroge B, (2001). Education, Gender and democracy in Kenya. Nairobi Guest &
Insight Publishers.
Psacharapolous, G.Z & Woodhall M. (1985). An Analysis of Investment choice, London, OUP. Republic of Kenya (1999). Totally Integrated Quality Education and Training (TIQET). Report
of inquiry into the Education system of Kenya. Nairobi. Government Press.
Republic of Kenya (2006). Early Childhood Development Service standard Guideline for Kenya. Nairobi Government Printers