A Web-Accessible Framework for Automated Storage
with Compression and Textural Classification of Malaria
Parasite Images
Maitreya Maity
1, #, Ashok K Maity
3, Pranab K Dutta
1, 2, $, Chandan Chakraborty
1, £1
School of Medical Science and Technology, Indian Institute of Technology Kharagpur, India
2
Dept of Electrical Engineering, Indian Institute of Technology Kharagpur, India
3
Dept. of Pathology, Midnapur Medical College & Hospital, Midnapur, West Bengal, India
ABSTRACT
Malaria being one of the serious health burdens especially in Indian population is conventionally diagnosed by expert pathologists through microscopic observation of stained peripheral blood smears. In order to provide rapid and efficient healthcare support to the common people at rural areas where experts are not (often) available, there is indeed a requirement of developing web-enabled healthcare system. In view of this, in this study, a web-accessible framework for automated storage of compressed microscopic images and texture-based screening of malaria parasite has been developed to provide rapid and efficient diagnosis even at remote public health clinics. It consists of (a) automated storage of microscopic images followed by JPEG image compression for faster transmission; (b) watershed transform based erythrocyte segmentation followed by image preprocessing; (c) texture feature extraction and selection; and (d) supervised classification and validation. Here, total 76 textures are extracted from segmented erythrocytes. Twenty six significant features are selected by using SVM based recursive feature elimination (SVM-RFE) method. Thereafter, supervised classifiers viz. Naïve Baye’s approach, C4.5 and NBTree are considered for six-class classification problem and their performance are compared. From the result, it has been found that NBTRee classifier provides higher accuracy to classify P. vivax and P. falciparum (sensitivity: 99.0%, specificity: 99.8%) with different stages viz. ring, gametocytes and scizon under our developed web-accessible framework.
Keywords
Web application, J2EE platform, Compression, JPEG, Malaria Screening, Texture Feature Extraction, Classification.
1.
INTRODUCTION
Malaria is one of the most serious burdens in modern health system and causes severe health problem mostly in the developing countries. According to the World Health Organization (WHO), infectious and parasitic diseases are the second leading cause of death in the world [1], whereas malaria causes nearly million deaths and 250 million infections every year [2]. And in the World Malaria report 2011 [3], published by WHO, India has over 10 core suspected malaria cases. The situation is alarming and regarding the fact that the disease like malaria caused by common parasites which are preventable and curable. The ample number of deaths and infections shows that the diagnosis of the disease in the early stage is done or not done with error which causes the huge spread of the disease. The process of malaria diagnosis using peripheral blood smear slides under microscopic is one of the most popular and widely used method to identify different parasites. There are a
numerous number of advanced techniques available for malaria diagnosis but the manual microscopy of blood samples is considered to be one of “the gold standard” [4]. Although the manual process has other advantages like good sensitive and specific than other methods for parasites identification [5], the process has some weakness. One disadvantage of such process is that it requires a lot of time, patience, accuracy and human intervention which causes slow, erroneous diagnosis. The identification of parasites has been done by trained and expertise technicians and the accuracy of correct identification is fully depended on their observations. The process of malaria diagnosis started with blood sample collection from patients. After sample collection, the blood was dripped on the slide and stained with chemical like leshiman stain to differentiate the infected parasites from normal cells. Then the parasites and their types are identified and labeled. Such manual diagnosis in respect to clinical approval is little. In the literature [6] it has been reported that humanistic system produced about 13.2% false positives and 24.3% false negatives.
Based on the above problem, an automated image analysis tool is required to improve the diagnosis process by automating the identification method. With automation, the weakness of the manual process like human error, time complexity, and accuracy can be solved. In addition, the diagnosis would be much faster and simpler without the presence of experts. The process of developing such automated image analysis tool has been stated a long time ago. A numerous number of studies based on developing advanced image analysis algorithm have been implemented and many of them can quickly and accurately identify the parasites [4, 7-11]. Besides development of automated image analysis tool, the use of standard communication protocol to develop web based medical system which can offer healthcare at anytime from anywhere, is also needed. The web-based medical systems with decision support system for disease diagnosis from remote place have the potential to improve the quality of health care for public. The common people can get the advantages of disease diagnosis from anywhere and anytime without doctor presence.
Therefore, the aim of this paper is to design and develop a web-based automated malaria screening tool which can offer a new algorithm to identify parasites from microscopic images based on the textural features of the erythrocytes. The internet enabled application can be accessed from anywhere and provide a sophisticated healthcare to very rural areas where the proper health service is not available. The image compression algorithm has been used to compress the size of the images for better transmission and easy storing.
In the next section, methods for developing the web-application, image compression unit and image screening algorithm have been described. Afterward the results of the image compression and the image screening steps are described. In the last section paper is concluded with conclusion and futures scopes.
2.
MATERIALS AND METHODS
[image:2.595.54.280.364.464.2]The developed system has also undergone some field trials at Midnapur Medical College and Hospital, Midnapur, All India Institute of Public Health and Hygiene, Kolkata, West Bengal. And it provides satisfactory results specially in pathological data acquisition and parasitemia detection. The proposed system incorporates different Java technologies at various layers of the software development. ImageJ library[15] is used to develop the image analysis module. Weka[16] is used to build the data-mining and machine learning module for malaria screening.
Fig 1: Overall workflow of the proposed malaria screening
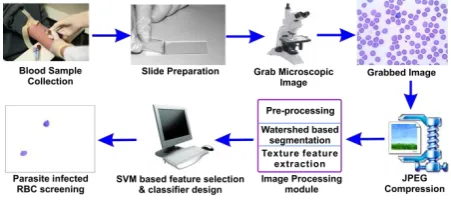
[image:2.595.56.282.606.688.2]Figure 1 describes the overall workflow of the proposed system. The peripheral blood images are collected from patient at first and corresponding blood side are prepared. The microscopic digital images are grabbed from the blood slides. Afterwards the grabbed images are compressed using compression unit and uploaded into server for screening. For screening, the blood image is processed by the developed image processing algorithm and based on image processing outcome, decision making module classifies the image. The result of the screening sends back to user as output of screening.
Fig 2: General architecture of the web-based microscopic image screening system
In the Figure 2, various steps of the proposed system are presented. There are two blocks in the general working steps of the system. The first left block signifies the stages for data acquisition and the right block signifies the stages for image screening. The steps are described as follows.
2.1
Microscopic image acquisition and
compression
Blood smear images are captured from leishman stained blood slides by Leica Observer (Leica DM750, Leica Microsystems Ltd.) under 100X oil objective (NA 1.5150). The effective magnification was 1000 times and the corresponding resolution 0.064 µm. The microscopic blood smear color images are optically grabbed by Leica Observer (Leica DM750) with dimension of 2048X1536 and average size of 9207KB and pixel depth of 24bit/pixel. The prodigious size of blood images leads to large storage capacity and long, costly transmission times. Image compression techniques make efficient storage and transmission by reducing the amount of data needed to represent an image. The joint photographic experts group (JPEG), DCT based image compression standard [17, 18] is a very well-known ISO/ITU-T standard created in the late 1980s and is based on discrete cosine transform (DCT). In the present study, JPEG compression method is used to compress blood images.For encoding, the image is divided into 8x8 blocks and each block is transformed into 8x8 array with the DCT into the frequency spectrums. The resulting 8x8 matrix values represent relative amounts of 64 spatial frequencies that make up the spectrum of the input image. Next, transformed blocks are quantized with a uniform scalar quantizer where only the larger-valued components are stayed. After quantization step, the entropy encoder creates the actual JPEG bit stream with the help of Huffman coding.
The reason behind using JPEG compression algorithm is that the JPEG formatted image is very much compatible with web based application like integration with HTML page etc. In the field of telemedicine and medical system, the JPEG image compression algorithm is well accepted and standard protocol [19, 20]. The image quality evaluation criteria are described below.
2.1.1
Compression ratio
Compression ratio is the degree of compression measure. Higher compression ratio value means high compression. It is defined as,
n C
nc
(1)
where n= amount of information in uncompressed image, nc= amount of information in compressed image and the unit for both measures is same.
2.1.2
Compression quality
Compression quality specifies a factor that relates to the desired tradeoff between image quality and the image data compression ratio. The value of it varies between 0 and 100. Higher compression quality means higher image quality and lower compression ratio.
2.1.3
Mean square error (MSE)
The MSE is the cumulative squared error between the original image and compressed image. From the mathematical expression, it is noted that lower value of MSE means lesser error. The mathematical formula is as follows
23 1 1
1 1
3 1 0 0
n m k k
MSE f F
ij ij nm
k i j
where n×m= image dimension, k= color channel like red, green and blue, fijk= value of channel k within original image, Fijk= value of channel k within compressed image.
2.1.4
Peak Signal-to-noise ratio (PSNR)
PSNR is the relation between the maximal pixel value of the original image with the noise caused by the compression. As the PSNR has inverse relation with MSE, the higher value of PSNR means good compression quality. It is defined as
20 * log 10
Peak PSNR
MSE
(3)The compression quality measurement criteria provide the label of compression and the standard of the compressed image. Therefore the correct compression standard have been measured and after selecting the fixed compression standard, a Java based image compression unit would be developed which can take an original image as input and provide a compressed image with lower size and good quality as an output.
2.2
Blood Image Upload
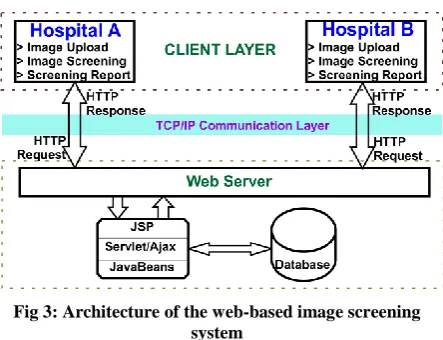
[image:3.595.58.280.449.619.2]The image upload module is fundamentally a web-based application through which hospital user sends patient data to central server. The web-based system has been developed under J2EE platform [21]. Three-tier client server architecture protocol is used to develop this web-based acquisition system. Client-server model is one of the most popular prototype for developing a web application. In such model, clients are directly connected with the server via network link and sever process several client’s request simultaneously. Client tier, Business tier and Data tier are three tiers where each tier has a separate job and each tier is functionally depend on another tier.
Fig 3: Architecture of the web-based image screening system
As the system follows the three-tier architecture model, the client tier is responsible to develop the user interface for the user and middle tier is responsible for basic operation to manage the system and data tier is responsible to manipulate the database. Hyper-text markup language (HTML) page, JavaScript, Cascading Style Sheet (CSS) are used in client tier to design the front end. In the middle tier several technologies like Servlet, Java Server Page (JSP), Ajax, and JavaBeans [22] are used to process the client request and generated the output for the client. Java Database Connectivity (JDBC) is used as communication tool to integrate the external resource like dataset with the middle tier components. MySQL is used as database management software to record patient blood
images. The detailed architecture of the proposed Image upload application is presented in the Figure 3. In this module, a web interface has been developed to upload images. The Apache Commons FileUpload package has been used to transfer file data from client machine to server machine efficiently.
2.3
Image enhancement
Whenever the data upload routine is completed, the next process is image screening. The following stages described the steps of the image screening module. When a user sends request for image screening, corresponding compressed image is retrieved from database. The retrieved image processed as input for following stage. The purpose of the pre-processing steps is to remove undesirable effects on the image and enhance the image for further image processing.
2.3.1
Background correction
The background illumination intensity provided by the microscope light source optics is most often not homogeneous throughout the view field and camera noise also cause uneven background. Fit a polynomial surface to a number of sample points in the image and output can be the polynomial fit or the image with the fit subtracted [23].
2.3.2
Contrast enhancing
The effects of digital capture may cause uneven contrast in the image where some fields are very bright and some fields are less visible. Simple global contrast enhancement method [24] has been implemented. But before contrast enhancement the color image is converted into gray scale image to reduce the complexity.
2.3.3
Noise Reduction
Noise may be accumulated during image acquisition and due to excessive staining. Various noise removal filters are available like median filter [25], hybrid median filter[17], mean filter [25], Gaussian filter [25], sigma filter [26] and anisotropic diffusion [27]. The MSE and PSNR values are measured by using the five noise removal filters. The comparative study is presented in the Table 1. The experiment is done on 100 microscopic images to measure those quality evaluation parameters. From the Table 1, hybrid median filter is the most significant filter to reduce noise from image and used as noise removal filter in the present study. In respect to other filter method, hybrid one has the lowest MSE and highest PSNR value, which signifies the less error present in filtered image.
Table 1. Image quality measurement for noise filter
Noise filter MSE PSNR (dB)
Anisotropic diffusion 2.28 44.54
Sigma filter 2.98 43.39
Median filter (3x3) 3.00 43.36
Hybrid Median filter (3x3) 0.7 49.5
Mean filter 8.43 38.87
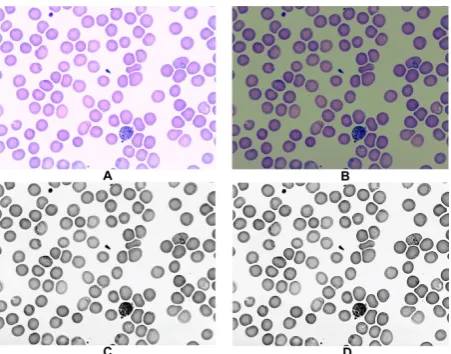
[image:3.595.313.550.584.704.2]Fig 4: (A) Original image, (B) Background corrected image, (C) Contrast enhanced image, (D) Noise removed
image
2.4
Erythrocyte segmentation
The multi-level thresholding algorithm[28, 29] has been used to threshold and binarizes the image. The thresholding approach is the generalized version of Otsu’s method [30]. Here, five level threshold selection method was used which was computationally faster than general Otsu technique. After thresholding, cell region with holes are filled up with hole filling technique which is based on morphological reconstruction [17]. It is often happened that more than one cell are overlapped with each other. The watershed algorithm[17] is used to split clumped objects into individual cells. Later each individual cell is labeled by flood filling method[25]. Margin cell and small dotted spot in the images are omitted after labeling. Next, each labeled cell is cropped into single image and reconstructed the cropped image with the original smear image. Through above explained process each erythrocyte is segmented out from blood smear image.
Fig 5: (A) Otsu thresholded image, (B) Multi-level Otsu thresholded image, (C) Segmented erythrocytes
2.5
Texture feature extraction
After segmenting enterocytes from the complete image, different statistical textural features are extracted. Details textural features are described below.
2.5.1
Fractal dimension
Fractal dimension is primarily used for estimating the roughness of an image surface. The box counting method [31] has been used to count the roughness. In principle, the method counts the number of boxes of given size required to cover one pixel. Mathematically fractal dimension can be defined as
log
log 1 / N r D
r
(4)
The sum of difference between maximum and minimum intensities provides the N and r be found by r=S/M; where S and M signify the grid size and the minimum size of the image respectively.
2.5.2
Co-occurrence matrix features
Gray level co-occurrence matrix (GLCM) describes the spatial distribution of gray values and the frequency of one gray tone appearing with another gray tone in a specified distance and angle [32]. Here, the average values of 19 different features of GLCM for 0, 45, 90 and 135 degree are measured.
2.5.3
Run length matrix features
In Gary Level Run-Length Method (GLRLM) texture is characterized based on run-length primitives. A run-length primitive is set of consecutive pixels with same gray level in given direction. Galloway [33] was first proposed run length matrix as texture feature. Chu et al. [34] and Dasarathy and Holder[35] are proposed another six texture feature. Eleven different textures for each direction (0, 45, 90, 135 degree) have been computed.
2.5.4
Local Binary Pattern
Local Binary Pattern is an important textural feature to define the local texture around the neighborhoods of a pixel [36]. The process starts with considering a gray scaled image I(x,y) and let gc denote the gray level of an arbitrary pixel (x, y). Moreover let gp denote the gray value of a sampling point in an evenly spaced circular neighborhood of P sampling points and radius R around point (x, y):
1 ,
, 0,..., 1
; cos 2 / , sin 2 /
gP Xp Yp
p P
where Xp x R p P Yp y R p P
(5)
LBP at the given point computed as,
1 1. 0
2 ; ( ) {
, 0 0, 0
P P z
LBPP R s gp g where s x
C z
p
(6)
The uniformity U and the rotation invariant texture description computed as
1
, 2
, 0
2
1,
P
s g g ifU LBP
p c P R
p riu LBP
P P otherwise
(7)
and
1
, 1 0 1 1
P
U LPBP R s gP gC s g gC s gP gC s gP gC p
(8)
[image:4.595.56.282.69.246.2] [image:4.595.54.282.473.657.2]2.6
Feature Selection
After feature extraction step, a labeled dataset (Normal: 450, P. falciparum Ring (P.f. Ring): 75, P. falciparum Gamatocytes (P.f. Gam): 75, P. vivax Ring (P.v. Ring): 75, P. vivax Gamatocyte (P.v. Gam): 75, P.vivax Scizon (P.v. Scizon): 75) has been created. The feature selection technique finds the most significant feature subset which will give the highest classification accuracy. There are two fundamentally different approaches available for feature selection[37]. The first is filter method which makes independent assessment of features before learning commences. The second is wrapper method which evaluates the feature set using learning method. In general wrappers method gives better performance than filter method. The support vector machine based on recursive feature elimination (SVM-RFE) [38, 39] is feature selection method which filters out the optimum feature subset using SVM in wrapper technique. Features are ranked one by one by the square of the weight assigned by the SVM classifier..In this process, at first feature’s worth is evaluated and the features are ranked based on their worth value. The basic algorithm of the filter is as follows: (1) Prepare the training dataset, (2) Train the dtaset using SVM, (3) Rank features according to their weight assigned by SVM, (4) Eliminates the lower ranked features, (5) Return to step 2. The SVM-RFE method is much more robust to over fitted data than other methods[39].
2.7
Erythrocyte classification
Erythrocyte classification basically aims to separate normal cell from abnormal parasites. To achieve it, here three supervised classifiers have been used for classifier comparison and selection.
2.7.1
Naïve Bayes’ classification
Naïve Bayes’ approach [40], is a statistical classifier that can predict class membership probabilities. The class conditional independence is assumed in this method where the effect of an attribute value of a given class is independent of the values of the other attributes. Maximum posterior probability of given evidence for a particular class indicates that the evidence is belong to that particular class.
2.7.2
C4.5 decision tree
C4.5 [41], a descendant of ID3, implements nonbactraking method in which decision tree is constructed in a top-down recursive divide-and-conquer fashion. C4.5 uses gain ratio, a normalized version of information gain, as splitting criteria to build the decision tree. The post pruning strategy is adopted to simplified the over fitted and unnecessary structure of decision tree.
2.7.3
NBTree
NBTree [42] is hybrid between Naïve Bayes and decision tree. The method is related to the classical recursive partitioning pattern. The splitting criteria of the decision tree is depends on naïve Bayes model. The method constructs tree with terminal nodes that are Naïve Bayes classifiers for the instances that reach the terminal node.
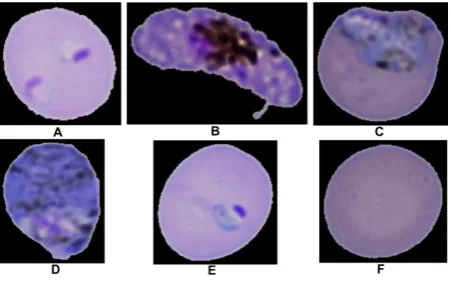
[image:5.595.318.544.71.212.2]The Figure 6 shows the different infected parasites and normal erythrocytes which are classified by the classifier from input image. From Figure 6, it is cleared that infected erythrocytes are significantly different form normal erythrocytes in respect to color, texture and morphology. The overall classification process is concentrated on identification of those five abnormal parasite classes.
Fig 6: Six types of erythrocytes, (A) P.f. Ring, (B) P.f. Gametocytes, (C) P. v. Scizon, (D) P.v. Gamatocytes, (E)
P.v. Ring, (F) Normal
2.8
Screening report generation
[image:5.595.322.543.386.480.2]This module is responsible to generate a combined report based on classification result. If a user request for screening, the proposed algorithm processes image and a testing feature dataset will be generated for the query image. Afterwards the testing dataset will be classified by the supervised trained classifier. Based on classification result, the abnormal erythrocytes are labeled. The system generated labeled parasites along with the classifier predicted class values are presented in webpage as a malaria screening result for user. The detailed workflow of the image screening and report generation process is illustrated in Figure 7.
Fig 7: Architecture of the web-based image screening and report generation system
3.
RESULT AND DISCUSSION
Table 2. Compression performance measures
Compr ession quality
Compr essed
size
Compre ssion ratio
MSE PSNR BPP
10 63 145.05 13.26 36.91 0.16
15 71 129.56 7.62 39.31 0.18
20 79 117.23 6.17 40.23 0.2
25 87 105.35 4.96 41.17 0.23
30 98 94.38 4.07 42.03 0.25
35 109 84.23 3.82 42.3 0.28
40 121 76.43 3.46 42.74 0.31
45 135 68.2 3.22 43.04 0.35
50 148 62.08 2.99 43.37 0.38
55 163 56.76 2.79 43.66 0.42
60 182 50.76 2.66 43.88 0.47
65 205 44.86 2.46 44.22 0.53
70 235 39.18 2.32 44.47 0.61
75 269 34.25 2.15 44.8 0.7
80 324 28.45 1.94 45.25 0.84
85 402 22.98 1.73 45.74 1.04
90 533 17.29 1.55 46.23 1.39
95 852 10.82 1.36 46.78 2.22
100 2040 4.52 0.67 49.87 5.31
Fig 8: Graphical view of different compression criteria
We have also verified the importance of image compression approach for the proposed web-application. A study has been performed where 100 numbers of uncompressed images and their corresponding compressed images are uploaded into server database using internet. Using internet connection with bandwidth of 70 kbps, each original image with size of 9207 KB takes average 875 sec and compressed image with size of 269KB takes average 66 second to successfully upload into database. Therefore, there is a significance difference between original image and compressed image transmission. The
uncompressed image requires 13 times more time than compressed image.
[image:6.595.321.541.213.380.2]From the malaria screening module, we have extracted total number 76 textural features from each erythrocyte. The feature selection method ranked the each and every feature according to their weight. From the full feature set, we have to find out the best feature subset. A comparative study has been performed where three classifiers are used to measure overall classification accuracy by giving different size of feature subset. The comparative analysis is presented in Figure 9. It has been observed that the classification accuracy is averagely highest when the size of the feature subset is 26.
Fig 9: Comparative analysis of feature subset selection
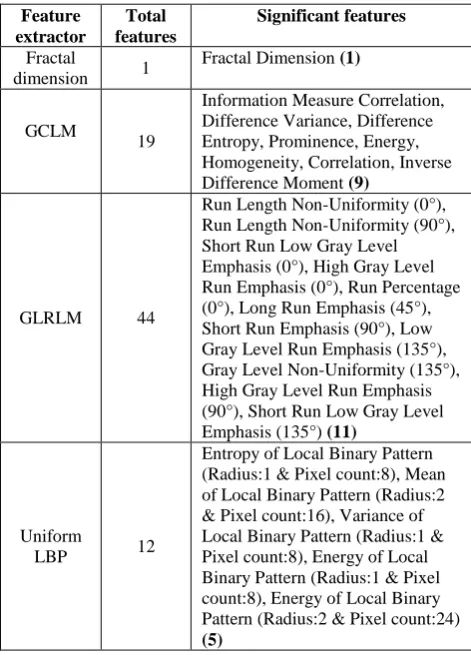
[image:6.595.310.546.438.766.2]The selected features details is shown in Table 3. Table 3. Selected feature list
Feature extractor
Total features
Significant features
Fractal
dimension 1
Fractal Dimension (1)
GCLM
19
Information Measure Correlation, Difference Variance, Difference Entropy, Prominence, Energy, Homogeneity, Correlation, Inverse Difference Moment (9)
GLRLM 44
Run Length Non-Uniformity (0°), Run Length Non-Uniformity (90°), Short Run Low Gray Level Emphasis (0°), High Gray Level Run Emphasis (0°), Run Percentage (0°), Long Run Emphasis (45°), Short Run Emphasis (90°), Low Gray Level Run Emphasis (135°), Gray Level Non-Uniformity (135°), High Gray Level Run Emphasis (90°), Short Run Low Gray Level Emphasis (135°) (11)
Uniform
LBP 12
The developed feature subset has been used for classification. In the proposed method, three classifiers have been taken. However, one best classifier has to choose. The selected features’ values are copied from the previously developed learning dataset and a new testing dataset has been built which is used to measure classification accuracy. The 10 fold cross validation has been done using three classifier to measure the performance. The classification accuracy results s are shown in the Table 4. The NBTree classifier gives maximum accuracy with 99% sensitivity and 99.8% specificity. Therefor the NBTree has selected as classifier. The classifier performance evaluation criteria are mathematically express as follows:
Sensitivity (%) = TP 100 TPFN
False Positive rate (FP Rate) (%) = FP 100 FPTN
Specificity (%) = 100 TN
TN FP
Precision (%) = TP 100 TPFP
Where, TP stands for True positive, FP is False Positive, FN is False Negative and TN is True Negative in 2x2 confusion matrix.
Table 4. Comparative analysis of classification accuracy
Classifier FP Rate
Sensitivity Specificity Precision
Naïve Bayes
1.6 94.7 98.4 94.7
C4.5 0.5 97.2 99.5 97.3
NBTree 0.2 99 99.8 99.1
[image:7.595.318.545.175.354.2]In this current study, the image processing, feature extraction and classification is performed on compressed image. However, a validation study has been conducted where the selected features are extracted from uncompressed image. Afterwards, an identical testing dataset is developed where the numbers of instances are same with previous compressed dataset. The classification accuracy for both two dataset is measured and the comparison has been shown in the Table 5. Moreover, the testing dataset is divided into two groups where 80% of dataset is used for training and remaining 20% of dataset is used for testing. From the Table 5, it is proved that the use of compression with a certain limit does not hamper in machine learning problem for medical image.
Table 5. Comparative analysis for compressed and uncompressed image screening
Classifiers Diagnostic measures
With compression
(%)
Without compression
(%) Naïve
Bayes
Sensitivity Specificity
79.56 93.9
79.6 96.3 C4.5 Sensitivity
Specificity
96.9 99.8
97.0 99.9 NB Tree Sensitivity
Specificity
96.4 99.7
97.8 99.8
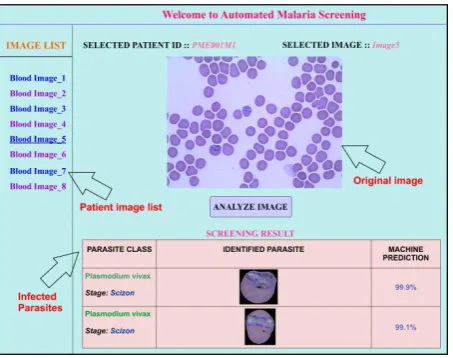
From Table 5, it is verified that with compression, the feature set is not abnormally changed in respect to original image data set. For that reason, the classification accuracy values of two conditions are considerably equal. Therefore, the compression of image is accepted in the present study. The web based malaria screening module page is shown in the Figure 10. In this online framework, an user can select any blood image of a patient and sends a request for screening. After completion of the screening process, user can view the screening report.
Fig 10: Web-based malaria screening interface
4.
CONCLUSION
Based on the compression result, the large images are compressed into lower size and the resultant compressed images have good quality with no block effect. Such small image size can help to store a lot number of images for a particular patient. The classification results signify good categorization of different parasites using texture based features. The different medical resources are unavailable in lower income courtiers and cannot provide full support the whole population. However, the developed system has the potentiality to provide better healthcare to each and every person throughout the country. If the developed prototype is integrated with the common healthcare system, hospitals can take the advantages of it. Hospital can diagnosis a large amount of patient very efficiently and accurately .The advantages of the developed application like web access, low cost deployment, rapid screening, and easy user-friendly environment will enhance the present status of poor health care in developed and lower income countries.
5.
ACKNOWLEDGEMENT
Authors acknowledge to DIT, Govt. of India for financial support (Ref. No. IIT/SRIC/SMST/DPR/2009-10/15).
6.
REFERNECES
[1] W. H. Organization. 2004. The World Health Report 2004—Changing History,‘Annex Table 2: Deaths by Cause, Sex and Mortality Stratum in WHO Regions, Estimates For 2002’, World Health Organization, Geneva, Switzerland,
[2] W. H. Organization, 2008 World malaria report 2008: World Health Organization
[image:7.595.49.286.672.769.2][4] F. B. Tek, A. Dempster, and I. Kale. 2009. Computer vision for microscopy diagnosis of malaria, Malar J, vol. 8. 153
[5] W. H. Organization. 1991. Basic Malaria Microscopy-Part I. Learner's Guide. 2. 2010, Geneva: WHO. 65-68 [6] F. E. McKENZIE, J. SIRICHAISINTHOP, R. S. Miller,
R. A. Gasser Jr, and C. Wongsrichanalai. 2003. Dependence of malaria detection and species diagnosis by microscopy on parasite density, The American journal of tropical medicine and hygiene, vol. 69. 372-376 [7] G. Díaz, F. Gonzalez, and E. Romero 2007 Infected cell
identification in thin blood images based on color pixel classification: comparison and analysis,812-821. [8] S. P. Premaratne, N. Karunawera, S. Fernando, W. S. R.
Perera, and R. Rajapakhsa,2003 A Neural Network Architecture for Automated Recognition of Intracellular Malaria Parasites in Stained Blood Films, ed: University of Colombo, Sri Lanka
[9] F. B. Tek, A. G. Dempster, and I. Kale. 2010. Parasite detection and identification for automated thin blood film malaria diagnosis, Comput. Vis. Image Underst., vol. 114. 21-32
[10] K. Rao, A. Dempster, B. Jarra, and S. Khan 2002 Automatic scanning of malaria infected blood slide images using mathematical morphology
[11] S. W. S. Sio, W. Sun, S. Kumar, W. Z. Bin, S. S. Tan, S. H. Ong, H. Kikuchi, Y. Oshima, and K. S. W. Tan. 2007. MalariaCount: An image analysis-based program for the accurate determination of parasitemia, Journal of Microbiological Methods, vol. 68. 11-18
[12] F. Dagan, C. Weidong, and R. Fulton. 2002. Dynamic image data compression in the spatial and temporal domains: clinical issues and assessment, Information Technology in Biomedicine, IEEE Transactions on, vol. 6. 262-268
[13] M. Ansari and R. Anand. 2008. Recent Trends in Image Compression and its Application in Telemedicine and Teleconsultation,
[14] W. Yung-Gi and T. Shen-Chuan. 2001. Medical image compression by discrete cosine transform spectral similarity strategy, Information Technology in Biomedicine, IEEE Transactions on, vol. 5. 236-243 [15] C. A. Schneider, W. S. Rasband, and K. W. Eliceiri.
2012. NIH Image to ImageJ: 25 years of image analysis, Nature Methods, vol. 9. 671-675
[16] E. Frank, M. Hall, G. Holmes, R. Kirkby, B. Pfahringer, I. Witten, and L. Trigg,2010.Weka-A Machine Learning Workbench for Data Mining, in Data Mining and Knowledge Discovery Handbook, O. Maimon and L. Rokach, Eds., ed: Springer US. 1269-1277.
[17] R. C. Gonzalez and R. E. Woods, 2009 Digital Image Processing, 3 ed.: Pearson Prenice Hall
[18] N. Efford, 2000 Digital Image Processing A Practical Introduction Using Java: Pearson Educatio Limited [19] M. J. Zukoski, T. Boult, and T. Iyriboz. 2006. A novel
approach to medical image compression, International Journal of Bioinformatics Research and Applications, vol. 2. 89-103
[20] S. Raviraja and S. Osman 2008 A Novel Technique For Malaria Diagnosis Using Invariant Moments And By Image Compression, 730-733.
[21] Java 2 Platform, Enterprise Edition (J2EE) Overview. Available: http://java.sun.com/j2ee/overview.html [22] B. Basham, K. Sierra, and B. Bates, 2009 Head First
Servlets and JSP, 1 ed.: Shroff Publishers and Distributors Pvt. Ltd.
[23] M. Schmid. (2008). Fit_Polynomial. Available: http://imagejdocu.tudor.lu/doku.php?id=plugin:filter:fit_ polynomial:start
[24] N. Bonnet. (2007). Available: http://rsb.info.nih.gov/ij/plugins/inserm514/index.html [25] W. Burger and M. J. Burge, 2008 Digital Image
Processing An Algorithmic Introduction using Java, 1 ed.: Springer
[26] J.-S. Lee. 1983. Digital image smoothing and the sigma filter, Computer Vision, Graphics, and Image Processing, vol. 24. 255-269
[27] P. Perona and J. Malik. 1990. Scale-space and edge detection using anisotropic diffusion, Pattern Analysis and Machine Intelligence, IEEE Transactions on, vol. 12. 629-639
[28] P. S. Liao, T. S. Chen, and P. C. Chung. 2001. A fast algorithm for multilevel thresholding, Journal of information science and engineering, vol. 17. 713-728 [29] Y. Tosa. (2006). Multi Otsu Threshold. Available:
http://rsbweb.nih.gov/ij/plugins/multi-otsu-threshold.html
[30] N. Otsu. 1979. A Threshold Selection Method from Gray-Level Histograms, Systems, Man and Cybernetics, IEEE Transactions on, vol. 9. 62-66
[31] T. G. Smith Jr, G. D. Lange, and W. B. Marks. 1996. Fractal methods and results in cellular morphology — dimensions, lacunarity and multifractals, Journal of Neuroscience Methods, vol. 69. 123-136
[32] R. M. Haralick, K. Shanmugam, and I. H. Dinstein. 1973. Textural Features for Image Classification, Systems, Man and Cybernetics, IEEE Transactions on, vol. 3. 610-621
[33] G. Mary M. 1975. Texture analysis using gray level run lengths, Computer Graphics and Image Processing, vol. 4. 172-179
[34] A. Chu, C. M. Sehgal, and J. F. Greenleaf. 1990. Use of gray value distribution of run lengths for texture analysis, Pattern Recognition Letters, vol. 11. 415-419
[35] B. V. Dasarathy and E. B. Holder. 1991. Image characterizations based on joint gray level—run length distributions, Pattern Recognition Letters, vol. 12. 497-502
[36] M. Pietikainen, A. Hadid, G. Zaho, and T. Ahonen, 2011 Computer Vision Using Local Binary Patterns vol. 40: Springer
[38] I. Guyon, J. Weston, S. Barnhill, and V. Vapnik. 2002. Gene selection for cancer classification using support vector machines, Machine Learning, vol. 46. 389-422 [39] M. Pirooznia, J. Yang, M. Q. Yang, and Y. Deng. 2008.
A comparative study of different machine learning methods on microarray gene expression data, BMC genomics, vol. 9. S13
[40] I. H. Written, E. Frank, and M. A. Hall, 2011 Data Mining Practical Machine Learning Tools and Techniques, 3 ed.: Elsevier India Private Limited [41] J. R. Quinlan, 1993 C4.5: Programs for Machine
Learning: Morgan Kaufmann