http://dx.doi.org/10.4236/ojs.2014.48053
Comparison of the Bayesian Methods on
Interval-Censored Data for Weibull
Distribution
Al Omari Mohammed AhmedDepartment of Mathematics, Faculty of Arts and Science in Qilwah, Al Baha University, Baha, KSA Email: [email protected]
Received 19 May 2014; revised 15 June 2014; accepted 30 June 2014
Copyright © 2014 by author and Scientific Research Publishing Inc.
This work is licensed under the Creative Commons Attribution International License (CC BY).
http://creativecommons.org/licenses/by/4.0/
Abstract
This study considers the estimation of Maximum Likelihood Estimator and the Bayesian Estimator of the Weibull distribution with interval-censored data. The Bayesian estimation can’t be used to solve the parameters analytically and therefore Markov Chain Monte Carlo is used, where the full conditional distribution for the scale and shape parameters are obtained via Metropolis-Hastings algorithm. Also Lindley’s approximation is used. The two methods are compared to maximum likelihood counterparts and the comparisons are made with respect to the mean square error (MSE) to determine the best for estimating of the scale and shape parameters.
Keywords
Weibull Distribution, Bayesian Method, Interval Censored, Metropolis-Hastings Algorithm, Lindley’s Approximation
1. Introduction
obtained the Bayesian approach using Lindely approximations to estimate the two shape parameters and the re-liability function of the exponentiated Weibull distribution. Soliman et al. [7] estimated Weibull distribution by using maximum likelihood estimator and Bayesian approach followed by estimating the hazard and reliability functions. Kantar and Senoglu [8] reported their findings on the comparative study for the location and scale parameters of the Weibull distribution with a given shape parameter. Gupta et al. [9] estimated Weibull exten-sion model by Bayesian method using Markov Chain Monte Carlo (MCMC). Kundu and Howlader [10] ob-tained Bayesian inference and prediction of the inverse Weibull distribution for Type-II censored data, where the Gibbs sampling technique was used to generate MCMC samples from the posterior distribution followed by an importance sampling technique for constructing the Bayes estimation. Comparison between Bayesian and maximum likelihood estimation of the scale parameter in Weibull distribution with known shape was considered by Pandey et al. [11].
2. Methodology
2.1. Maximum Likelihood Estimation of Weibull Distribution with Interval-Censored Data The probability density function of Weibull distribution is:
(
; ,)
1exp xf x x
α α
α λ α
λ − λ
= −
The cumulative distribution function (cdf) of the Weibull distribution is given as
(
; ,)
1 exp x ,F x
α λ α
λ
= − −
with the scale parameter λ and the shape parameter α of the Weibull distribution The likelihood function of interval censored as given in Flygare et al. [12] is
(
)
(
)
(
)
1 1
1
, , ; , ; , 1 exp 1 exp
exp exp .
n n
i i
i i i i
i i
n
i i
i
u l
L l u F u F l
l u
α α
α α
λ α λ α λ α
λ λ
λ λ
= =
=
= − = − − − − −
= − − −
∏
∏
∏
(1)
The logarithm of the likelihood function with interval censored can be expressed as follows:
(
)
1
ln , , log exp exp
n
i i
i i i
l u
L l u
α α
λ α
λ λ
=
= − − −
∑
(2)To obtain the equations for the unknown parameters, we differentiate Equation (2) partially with respect to the scale and shape parameters and equal it to zero. The resulting equations are given respectively as,
(
)
2 2
1
, ,
exp exp
n
i i i i i i
i i
i
L l u l l u u
D
α α α α
λ α
λ λ
λ = λ λ
∂
= − − −
∂
∑
(3)(
)
( )
( )
1
, ,
ln exp ln exp
n
i i i i i i
i i i
i i
L l u u u l l
u l D
α α α α
λ α
λ λ
α = λ λ
∂
= − − −
∂
∑
(4)where
exp i exp i
i
l u
D
α α
λ λ
= − − −
2.2. Bayesian Using Gamma Prior Estimation of Weibull Based on Interval-Censored Data In this subsection we consider the case when both the scale and shape parameters are unknown, and we compute the Bayes estimates of the shape and scale parameters. It is assumed that λ and α each have independent gamma
( )
a b, , and gamma(
c d,)
priors respectively(
)
1(
)
1 , exp
a
a b b
π λ =λ − − λ
(
)
1(
)
2 , exp
c
c d d
π α =α − − α
It is a natural conjugate prior.
The posterior probability density function of λ and α given the data with gamma prior is combining Equ-ation (7) with likelihood function and using Bayes theorem, the joint posterior distribution is derived as see Al Omari et al. [13]
(
)
(
)
(
) (
)
(
)
(
) (
)
(
)
(
)
(
(
)
)
(
)
(
)
(
(
)
)
1 2 1 1 2 0 0 1 1 1 1 1 1 0 0 , , , , ,, , , , d d
exp exp exp
exp exp exp d
, d . i i i i i n a c i i i n a c i i i
L l u a b c d
l u
L l u a b c d
l u b d
l u b d
α α
α α
λ π λ π α
λ π λ π α λ α
λ λ λ α λ α
λ λ λ α λ α λ α
α λ α α ∞ ∞ − − = ∞ ∞ − − = − − − − + − − − − + = =
∏
∫ ∫
∏
∏
∫ ∫
(8)With this, the Bayes estimates for the scale and shape parameters under squared error loss function are given as:
(
)
(
)
(
(
)
)
(
)
(
)
(
(
)
)
1 1 0 0 1 1 1 0 0exp exp exp d d
exp ex
ˆ .
p exp d d
n a c i i i n a c i i i
l u b d
l u b d
α α
α α
λ α λ λ λ α λ α
λ λ λ α λ α
λ α λ ∞ ∞ − = ∞ ∞ − − = − − − − + − − − − + =
∫ ∫
∏
∏
∫ ∫
(9)(
)
(
)
(
(
)
)
(
)
(
)
(
(
)
)
1 1 0 0 1 1 1 0 0exp exp exp d d
exp ex
ˆ .
p exp d d
n a c i i i n a c i i i
l u b d
l u b d
α α
α α
λ α λ λ λ α
α
λ α
λ λ λ α λ α λ α
∞ ∞ − = ∞ ∞ − − = − − − − + − − − − + =
∫ ∫
∏
∏
∫ ∫
(10)The integration of the scale and shape parameter we can’t solve it analytical for that we used Metropolis- Hastings algorithm and Lindley’s approximation to solve the problem.
Metropolis-Hastings Algorithm
The Metropolis-Hastings algorithm is a very general Markov Chain Mote Carlo method, it can be used to obtain random samples from any arbitrarily complicated target distribution of any dimension that is known up to a normalizing constant. In fact, Metropolis algorithm is an alternative to Gibbs sampler that does not require availability of full conditionals see Hastings [14] and Soliman et al. [15].
Therefore, the full conditional of the posterior density function using gamma prior of λ and α given the data are combining the gamma prior with likelihood as given below
(
)
1 1(
)
(
)
(
(
)
)
1
, exp e
, xp exp .
n
a c
i i i i
i
l u λ α lα λ uα λ bλ dα
λ α − −
=
Π ∝
∏
− − − − + (11)From Equation (11) we can get the conditional posterior of the scale parameter λ as follows
(
)
(
)
(
)
1(
)
1
; , exp exp exp .
n
a
i i i i
i
l u lα uα b
λ α λ λ λ − λ
=
Π ∝
∏
− − − − (12)(
)
(
)
(
)
1(
)
1
; , exp exp exp
n
c
i i i i
i
l u lα uα d
α λ λ λ α − α
=
Π ∝
∏
− − − − (13)As show in the conditional posterior of the scale and shape parameters it’s not follow any close distribution for that we suggest to use the Metropolis-Hastings algorithm to generate MCMC sample.
Algorithm:
1) Start with initial value λ0, α0.
2) The current value λi, αi and generate the candidate value λ
∗
, α∗ from arbitrary distribution uniform (0, 1).
3) The next value of λi is given below as
1
with probability with probability 1 i
i
p p
λ λ
λ ∗
+ =
−
where
(
)
(
)
; , min 1,
; , i i
i i i
l u p
l u
λ α λ α
∗
Π
=
Π
4) Generate u from Uniform (0, 1) and accept λ∗ with probability p if λ∗ < p and return to step 2), other-wise accept λi.
5) The next value of αi is given below as
1
with probability with probability 1 i
i
p p
α α
α ∗
+ =
−
where
(
)
(
)
; , min 1,
; , i i
i i i
l u p
l u
α λ α λ
∗
Π
=
Π
6) Generate u from uniform (0, 1) and accept α∗ with probability p if α∗ < p and return to step 2), oth-erwise accept αi and return to step 2).
7) The Bayesian based interval-censored data of the scale and shape parameters under the squared error loss function is given as
(
)
1
1
1
ˆ ; , n
i i i
i
E l u
n
λ α λ
=
=
∑
(
)
2
1
1
ˆ ; , n .
i i i
i
E l u
n
α λ α
=
=
∑
8) Obtain the posterior variance of Bayesian using gamma prior based interval-censored data as
(
)
(
(
)
)
21
1
1
ˆ ; , n ˆ ; ,
i i i i i
i
V l u E l u
n
λ α λ λ α
=
=
∑
−(
)
(
(
)
)
22
1
1
ˆ ; , n ˆ ; , .
i i i i i
i
V l u E l u
n
α λ α α λ
=
=
∑
−2.3. Lindley’s Approximation
The Equations (9) and (10) cannot be solved analytically and for that we obtained Lindley’s expansion to solve the parameters approximation.
According to Al Omari et al. [16] Lindley’s approximation proposed a ratio of integral of the form
( )
exp{
( )
}
d( )
exp{
( )
}
dw λ L λ λ υ λ L λ λ
∫
∫
it is assumed that υ λ
( )
is the prior distribution for λ and w( )
λ =u( ) ( )
λ υ λ⋅ with u( )
λ being some function of interest.The posterior expectation according to Sinha [2] is
( )
(
)
( )
exp{
( )
( )
}
d exp{
( )
( )
}
dE u λ t =
∫
υ λ L λ +ρ λ λ∫
L λ +ρ λ λwhere
( )
(
)
log
ρ= υ λ
According to [1] Lindley expansion is therefore approximated asymptotically by
( )
(
)
(
)
(
2 2)
11 11 22 22 1 1 11 2 2 22 30 1 11 03 2 22
1 1
2 2
E u λ t = +u u σ +u σ +uρ σ +u ρ σ + L uσ +L uσ
where L is the log-likelihood equation in (2). See Sinha [2] for more detail. Taking the scale parameter λ estimation, where
(
)
(
1)
(
2(
)
)
1 21 2 11 22
1 1
ln , ln , , ,
, 1, 0
a c
a b c d b d
u
u u u u u
ρ ρ
ρ π λ π α ρ ρ
λ λ α α
λ λ ∂ − ∂ − = + = = − = = − ∂ ∂ ∂ = = = = = = ∂
For the shape parameter
2 1 11 22
, u 1, 0
u α u u u u
α ∂
= = = = = =
∂
(
)
1(
)
111 L20 , 22 L02
σ − σ −
= − = −
( )
2( )
23 4 3
2
4
20 2 2
1
e e e
e e
2 e 2 e
i i i
i i
i i
n
i i i
u l u
l u
l u
i i i
i i
i i
i
u l u
l u
l L
L
D D D
u
α α α
α α
α α α λ α λ α λ
α λ α λ
α λ α λ
λ λ
λ = λ λ
− − − − − − − − − + + − + ∂ = = ∂
∑
( )
2( )
2( )
2( )
2( )
2
02 2 2
1
ln e
ln e ln ln e
i
i u i
u u
n
i i
i i i i i i
i
u u
u u l l u u
L L
α
α α
α λ
α λ α α λ
λ λ λ
α λ − − − = ∂ = = − − + ∂
∑
( )
( )
( )
( )
( )
3 3 30 3 2 24 5 6 4 5 2
3 6
2 1
4 e e e
6 e e 6 e
6 e 6 e
2 e e e
e
i i i
i i i
i i
i i i
i n
i i
u l u
l l u
l u i i i
i i i
i i
u l u
i i
i u
i i i
i
L L
D
u l u
l l u
l u u D l D u D u
α α α
α α α
α α
α α α
α
α λ α λ α λ
α λ α λ α λ
α λ α λ
α λ α λ α λ α λ
λ λ λ λ λ λ
λ λ − − − − − − − − − − − − = − − + + + − − − ∂ ∂ + = =
∑
( )
( )
2 2 3
2 2 3 4 3 4
2
2 2
2 e e e
e e
2 e 2 e
1 e .
i i i
i i
i i
i
u l u
i i i
l u l u u i i i i i i i i
u l u
D D
D
l u
l u
u
α α α
α α
α α
α
α λ α λ α λ
α λ α λ
α λ α λ
α λ
λ
λ λ λ λ λ
− − − − − − − − − − + − + + −
( )
( )
( )
( )
( )
( )
( )
( )
( )
2 3 3 3
3 3
3
03 3 2 3
1
2 2
2
2
3 ln e ln e
ln e ln
ln e ln e . i i i i i u u u n
i i i i
i i i i
i
u u
i i
i i
u u u u
u u l l
L L u u u u α α α α α
α λ α λ
α λ α
α λ
α λ
λ λ
α λ λ
3. Simulation Study
To assess the performance of the maximum likelihood and Bayesian with help of the Lindley’s approximation and Markov Chain Monte Carlo, where the Metropolis-Hastings algorithm used to estimate the scale and shape parameters, the mean squared errors (MSE) for each method were calculated using 10,000 replications for sam-ple size n = 25, 50 and 100 of Weibull distribution with interval-censored data for different value of parameters were the scale parameter λ=2, shape parametric α=0.5, 1, 1.5 and 2, the considered values of λ, α are meant for illustration only and other values can also be taken for generating the samples from Weibull distribu-tion.
4. Discussion
[image:6.595.91.538.278.486.2]As shown in Table 1, the estimate of the scale parameter λ of Weibull distribution with interval-censored data was compared between maximum likelihood (MLE), Bayesian using Lindley’s approximation (BL) and Bayesian using Metropolis-Hastings algorithm (BM) by mean squared error (MSE). We observed that the Bayesian using
Table 1. Estimated average lengths of the scale parameter and MSE of Weibull distribution.
Size Estimators MLE BJ BM
25
0.5
α = 1.8918 (0.0331) 1.8891 (0.0340) 1.8901 (0.0335)
1
α = 1.9151 (0.0312) 1.9041 (0.0322) 1.9241 (0.0301)
1.5
α = 1.9255 (0.0319) 1.9137 (0.0325) 1.9308 (0.0311)
2
α = 1.9368 (0.0307) 1.9418 (0.0301) 1.9455 (0.0299)
50
0.5
α = 1.9018 (0.0318) 1.8986 (0.0331) 1.9128 (0.0327)
1
α = 1.9255 (0.0289) 1.9114 (0.0300) 1.9311 (0.0272)
1.5
α = 1.9314 (0.0271) 1.9281 (0.0299) 1.9400 (0.0260)
2
α = 1.9417 (0.0265) 1.9501 (0.0257) 1.9522 (0.0259)
100
0.5
α = 1.9161 (0.0300) 1.8991 (0.0321) 1.9211 (0.0310)
1
α = 1.9366 (0.0276) 1.9213 (0.0288) 1.9441 (0.0265)
1.5
α = 1.9443 (0.0263) 1.9322 (0.0274) 1.9555 (0.0252)
2
α = 1.9687 (0.0243) 1.9771 (0.0235) 1.9886 (0.0231)
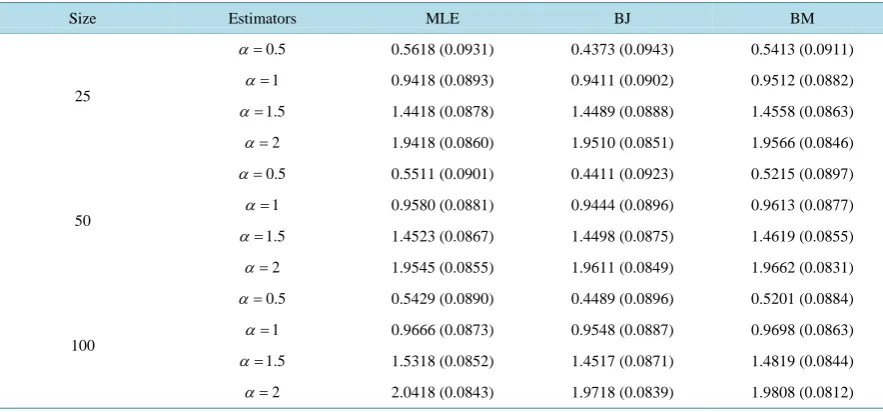
Table 2. Estimated average lengths of the shape parameter and MSE of Weibull distribution.
Size Estimators MLE BJ BM
25
0.5
α = 0.5618 (0.0931) 0.4373 (0.0943) 0.5413 (0.0911)
1
α = 0.9418 (0.0893) 0.9411 (0.0902) 0.9512 (0.0882)
1.5
α = 1.4418 (0.0878) 1.4489 (0.0888) 1.4558 (0.0863)
2
α = 1.9418 (0.0860) 1.9510 (0.0851) 1.9566 (0.0846)
50
0.5
α = 0.5511 (0.0901) 0.4411 (0.0923) 0.5215 (0.0897)
1
α = 0.9580 (0.0881) 0.9444 (0.0896) 0.9613 (0.0877)
1.5
α = 1.4523 (0.0867) 1.4498 (0.0875) 1.4619 (0.0855)
2
α = 1.9545 (0.0855) 1.9611 (0.0849) 1.9662 (0.0831)
100
0.5
α = 0.5429 (0.0890) 0.4489 (0.0896) 0.5201 (0.0884)
1
α = 0.9666 (0.0873) 0.9548 (0.0887) 0.9698 (0.0863)
1.5
α = 1.5318 (0.0852) 1.4517 (0.0871) 1.4819 (0.0844)
2
[image:6.595.92.534.512.718.2]Metropolis-Hastings algorithm (BM) is better compare to the others, moreover, Bayesian with help from Lind-ley’s approximation is better than MLE estimators when α=2. When the number of sample size increases the mean squared error (MSE) decreases in all cases.
In Table 2, the estimate of the shape parameter α of Weibull distribution with interval-censored data was compared between maximum likelihood (MLE), Bayesian using Lindley’s approximation (BL) and Bayesian using Metropolis-Hastings algorithm (BM) by mean squared error (MSE). We found that the Bayesian using Metropolis-Hastings algorithm (BM) is the best compare to the others, moreover, Bayesian using Lindley’s ap-proximation is better than MLE estimators when α =2. When the number of sample size increases the mean squared error (MSE) decreases in all cases.
5. Conclusion
The Bayesian using Metropolis-Hastings algorithm for estimating the scale and shape parameters of Weibull distribution-based interval-censored data is the best compare to others. In this paper, we contribute applying Bayesian estimation approach based on interval-censored data considered with Bayes using Makov Chain Monte Carlo (MCMC).
References
[1] Cohen, C.A. and Whitten, B. (1982) Modified Maximum Likelihood and Modified Moment Estimators for the Three- Parameter Weibull Distribution. Communications in Statistics-Theory and Methods, 11, 2631-2656.
http://dx.doi.org/10.1080/03610928208828412
[2] Sinha, S.K. (1986) Bayes Estimation of the Reliability Function and Hazard Rate of a Weibull Failure Time Distribu-tion. Trabajos de Estadística, 1, 47-56. http://dx.doi.org/10.1007/BF02863554
[3] Smith, R.L. and Naylor, J. (1987) A Comparison of Maximum Likelihood and Bayesian Estimators for the Three-Pa- rameter Weibull Distribution. Applied Statistics, 36, 358-369. http://dx.doi.org/10.2307/2347795
[4] Singh, U., Gupta, P.K. and Upadhyay, S. (2002) Estimation of Exponentiated Weibull Shape Parameters under LINEX Loss Function. Communications in Statistics-Simulation and Computation, 31, 523-537.
http://dx.doi.org/10.1081/SAC-120004310
[5] Hossain, A.M. and Zimmer, W.J. (2003) Comparison of Estimation Methods for Weibull Parameters: Complete and Censored Samples. Journal of Statistical Computation and Simulation, 73, 145-153.
http://dx.doi.org/10.1080/00949650215730
[6] Nassar, M. and Eissa, F.H. (2005) Bayesian Estimation for the Exponentiated Weibull Model. Communications in Sta-tistics—Theory and Methods, 33, 2343-2362. http://dx.doi.org/10.1081/STA-200031447
[7] Soliman, A.A., Abd Ellah, A.H. and Sultan, K.S. (2006) Comparison of Estimates Using Record Statistics from Wei-bull Model: Bayesian and Non-Bayesian Approaches. Computational Statistics & Data Analysis, 51, 2065-2077. http://dx.doi.org/10.1016/j.csda.2005.12.020
[8] Kantar, Y.M. and Senoglu, B. (2008) A Comparative Study for the Location and Scale Parameters of the Weibull Dis-tribution with Given Shape Parameter. Computers Geosciences, 34, 1900-1909.
http://dx.doi.org/10.1016/j.cageo.2008.04.004
[9] Gupta, A., Mukherjee, B. and Upadhyay, S. (2008) Weibull Extension Model: A Bayes Study Using Markov Chain Monte Carlo Simulation. Reliability Engineering & System Safety, 93, 1434-1443.
http://dx.doi.org/10.1016/j.ress.2007.10.008
[10] Kundu, D. and Howlader, H. (2010) Bayesian Inference and Prediction of the Inverse Weibull Distribution for Type-II Censored Data. Computational Statistics & Data Analysis, 54, 1547-1558.
http://dx.doi.org/10.1016/j.csda.2010.01.003
[11] Pandey, B., Dwividi, N. and Pulastya, B. (2011) Comparison between Bayesian and Maximum Likelihood Estimation of the Scale Parameter in Weibull Distribution with Known Shape under Linex Loss Function. Journal of Scientific Research, 55, 163-172.
[12] Flygare, M.E. and Buckwalter, J.A. (1985) Maximum Likelihood Estimation for the 2-Parameter Weibull Distribution Based on Interval-Data. IEEE Transactions on Reliability, 34, 57-60. http://dx.doi.org/10.1109/TR.1985.5221930 [13] Al Omari, M.A., Ibrahim, N.A., Arasan, J. and Adam, M.B. (2012) Extension of Jeffreys’s Prior Estimate for Weibull
Censored Data Using Lindley’s Approximation. Australian Journal of Basic and Applied Sciences, 5, 884-889. [14] Hastings, W.K. (1970) Monte Carlo Sampling Methods Using Markov Chains and Their Applications. Biometrika, 57,
[15] Soliman, A.A., Abd-Ellah, A.H., Abou-Elheggag, N.A. and Ahmed, E.A. (2011) Modified Weibull Model: A Bayes Study Using MCMC Approach Based on Progressive Censoring Data. Reliability Engineering & System Safety, 100, 48-57. http://dx.doi.org/10.1016/j.ress.2011.12.013
[16] Al Omari, M.A., Ibrahim, N.A., Arasan, J. and Adam, M.B. (2012) Bayesian Survival and Hazard Estimate for Weibull Censored Time Distribution. Journal of Applied Sciences, 12, 1313-1317.