1
A Novel Algorithm for Improving the End-to-End Active
Packet Loss Measurements in Computer Networks
R. Padmalatha
Final year M.Tech. (CSE) Student,
Department of Computer science & Engg., M.I.T.S,
Post box no. 14, Madanapalle, Chittoor dist, Andhra
Pradesh-517325, India.
G. Sreedhar
Professsor
Department of Computer science & Engg.
Madanapalle Institute of Tech. & Sciences,
Post box no. 14, Madanapalle, Chittoor dist,
Andhra Pradesh-517325, India.
ABSTRACT
An application of improving the end-to-end packet loss estimation has been presented in this application oriented research paper along with the simulation results in Java environment. Measurement and estimation of packet loss characteristics are challenging due to the relatively rare occurrence and typically short duration of packet loss episodes. While active probe tools are commonly used to measure packet loss on end-to-end paths, there has been little analysis of the accuracy of these tools. The objective of our simulation study done in java language is to understand how to measure packet loss episodes accurately with end-to-end probes using software approach. The recent studies show that the standard Poisson-modulated end-to-end measurement of packet loss accuracy has to be improved. Thus, here, in this paper we demonstrate the application of the algorithm for packet loss measurement to overcome the deficiencies in standard Poisson-based tools. We also find the transfer rate during the simulation study. We evaluate the capabilities of our methodology by developing and implementing a prototype tool, called BADABING. These simulation experiments done in the java environment demonstrate the trade-offs between impact on the network and measurement accuracy. BADABING reports loss characteristics are far more accurately than traditional loss measurement tools. The simulation results shown in this research paper shows the efficiency of the method developed which can be further used for a number of wide range applications.
General Terms
Measurements, Probes, TCP, UDP, SNMP.
Keywords
BADABING, Network Congestion, Network Probes, Packet Loss, Active Measurement.
1.
INTRODUCTION
Network operators have the ability to passively monitor nodes within their network for packet loss on routers using SNMP. End-to-end active measurements using probes provide an equally valuable perspective since they indicate the conditions that application traffic is experiencing on those paths. The most commonly used tools for probing end-to-end paths to measure packet loss resemble the ubiquitous PING utility. PING-like tools send probe packets (e.g., ICMP echo packets) to a target host at
fixed intervals. Loss is inferred by the sender if the response packets expected from the target host are not received within a specified time period [1], [2]. Generally speaking, an active measurement approach is problematic because of the discrete sampling nature of the probe process. Thus, the accuracy of the resulting measurements depends both on the characteristics and interpretation of the sampling process as well as the characteristics of the underlying loss process. Despite their widespread use, there is almost no mention in the literature of how to tune and calibrate [1] active measurements of packet loss to improve accuracy or how to best interpret the resulting measurements.
One approach is suggested by the well-known PASTA principle [2] which, in a networking context, tells us that Poisson-modulated probes will provide unbiased time average measurements of a router queue’s state. This idea has been suggested as a foundation for active measurement of end-to-end delay and loss [3]. However, the asymptotic nature of PASTA means that when it is applied in practice, the higher moments of measurements must be considered to determine the validity of the reported results. A closely related issue is the fact that loss is typically a rare event in the Internet [4]. This reality implies either that measurements must be taken over a long time period, or that average rates of Poisson-modulated probes may have to be quite high in order to report accurate estimates in a timely fashion. However, increasing the mean probe rate may lead to the situation that the probes themselves skew the results. Thus, there are trade-offs in packet loss measurements between probe rate, assurement accuracy, impact on the path and timeliness of results [11], [12].
2 The studies developed so far involved the empirical evaluation of
the new loss measurement methodology. To this end, a one-way active measurement tool called BADABING could be developed & used. BADABING sends fixed-size probes at specified intervals from one measurement host to a collaborating target host. The target system collects the probe packets and reports the loss characteristics after a specified period of time. We also compare BADABING with a standard tool for loss measurement that emits probe packets at Poisson intervals [13], [14]. The results show that our tool reports loss episode estimates much more accurately for the same number of probes. We also show that BADABING estimates converge to the underlying loss episode frequency and duration characteristics [1], [2].
The paper is presented in the following sequence. A brief introduction about the related work is presented in the previous paragraphs. In section 2, the aim of the work undertaken is presented along with the block-diagram & its explanation. Section 3 presents the hardware & software requirements to design the algorithm. The end to the packet loss issues is dealt with in the section 4. The section 5 explains about the various types of network measurement techniques used in our work. The UML diagrams are presented in the section 6. The simulation results are presented in section 7. Finally, conclusions are presented in section 8. This is followed by the references & the author biographies.
2.
AIM OF THE WORK UNDETAKEN
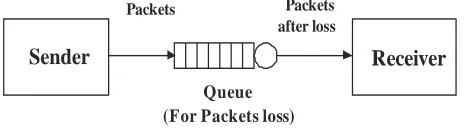
The block diagram of the work undertaken in this research paper is shown in the Fig. 1 [1], [2].
Sender
Receiver
Queue (For Packets loss)
Packets Packets
[image:2.612.59.291.413.477.2]after loss
Fig. 1 : Overall block diagram of the work
Existing System
In the existing traditional packet loss measurement tools, the accuracy of the packet loss measurement has to be improved. Several studies include the use of loss measurements to estimate packet loss, such as Poisson modulated tools which can be quite inaccurate. These are several drawbacks in the existing system, which can also be mentioned as the minor losses & needs longer measurement periods [1], [2], [21].
Proposed System
The purpose of our study was to understand how to measure end-to-end packet loss characteristics accurately.
The goal of our study is to understand how to accurately measure loss characteristics on end-to-end paths with probes.
Specifically, our method entails probe experiments that follow a geometric distribution to improve the accuracy of the packet loss measurement [8].
Modules of the work undertaken in this paper
The modules of the work undertaken could be split up into 5 zonal areas, viz.,
Packet Separation Designing the Queue Packet Receiver User Interface Design Packet Loss Calculation
Module Description
The different modules developed in our work are explained using a step by step as follows [15].
Packet Separation
In this module we have to separate the input data into packets. These packets are then sent to the Queue [16].
Designing the Queue
The Queue is designed in order to create the packet loss. The queue receives the packets from the Sender, creates the packet loss and then sends the remaining packets to the Receiver [17].
Packet Receiver
The Packet Receiver is used to receive the packets from the Queue after the packet loss. Then the receiver displays the received packets from the Queue [18], [21].
User Interface Design
In this module, we design the user interface for Sender, Queue, Receiver and Result displaying window. These windows are designed in order to display all the processes in this work [19].
Packet Loss Calculation
The calculations to find the packet loss are done in this module. Thus we are developing the tool to find the packet loss [20].
3.
SYSTEM REQUIREMENTS (h/w & s/w)
The system requirements such as the hardware & software required to develop the work undertaken in this research paper is shown below.
Hardware:
PROCESSOR : PENTIUM IV 2.6 GHz
RAM : 512 MB
MONITOR : 15” HARD DISK : 20 GB CDDRIVE : 52X
KEYBOARD : STANDARD 102 KEYS
Software:
FRONT END : JAVA, SWING TOOLS USED : JFRAME BUILDER OPERATING SYSTEM : WINDOWS XP
4.
END-TO-END PACKET LOSS ISSUES
3
4.1 UDP and TCP based applications
The network layer is responsible for delivering packets to any destination node within the network, and consequently the routing of packets is one of the tasks of its protocols. IP is used by the two main protocols of the transport layer, UDP and TCP, both providing packet flows between two hosts for application layer protocols. There is a significant difference between these two protocols. While TCP provides a reliable flow of packets the much simpler UDP only transmits packets but does not guarantee their delivery [3]. UDP is used for example by applications like the Simple Network Management Protocol (SNMP) and the Network Time Protocol (NTP), while TCP is used by the File Transfer Protocol (FTP) and Simple Mail Transfer Protocol (SMTP) [1], [2].
Loss can have a significant impact on the performance of both TCP and UDP based applications. Email for example, may involve text and still images and the performance degradation caused by losses can be corrected by retransmitting the packets with the help of TCP. But re-transmissions gradually increases the load, so increasing the loss and hence the number of re-transmissions [6]. However, for UDP based applications, like VoIP, timely packet delivery and packet ordering is important. Packets must reach the destination within a bounded time period [6].
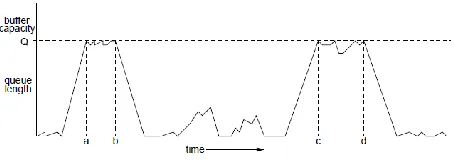
[image:3.612.59.286.541.621.2]VoIP has the advantage of not requiring a completely reliable transport level, although it does need real-time delivery. The loss of a packet or a single bit error will often only introduce a “click” or a minor break in the voice output. Some applications already possess internal probing like Time Control Protocol/ Real-Time Protocol (RTCP/RTP), where RTCP is used in VoIP signaling and RTP is used to send and receive the voice signal. However, as IP networks may route packets via different pathways to their destination, RTP packets may arrive out-of-order, or be delayed or lost [6]. That is why RTCP is not widely implemented [7] and is not considered in this paper. From the Fig. 2, it can be observed that the queue length grows when aggregate demand exceeds the capacity of the output link. Loss episodes begin (points a and c) when the maximum buffer size Q is exceeded. Loss episodes end (points b and d) when aggregate demand falls below the capacity of the output link and the queue drains to zero.
Fig. 2 : Example of the evolution of the length of a queue over time.
4.2 Causes of Packet Loss
There are two major causes of packet loss in IP networks. One is congestion, where the network routers/switches are temporarily sent more packets than their buffers can accommodate. The other is due to link failure, when all the bits currently in transit on that
link will be lost. Further packets that are also transmitted down the broken link will be lost until the Synchronous Digital Hierarchy (SDH) layer reconfigures a new route around the failed link. The effect of packet loss on the user depends mainly on the following three factors [4]:
· Packet Loss Rate
· Packet Loss Distribution
· Packet Size (larger packets contain more information).
Packet loss due to congestion is a fundamental problem in managed IP networks. A queue forms in a buffer until the router is able to transmit them on their way.
5.
NETWORK MEASUREMENT
TECHNIQUES
Network measurement is part of the responsibilities of the network management system and hence how the management information is stored in the agents and retrieved by the manager has already been illustrated in the previous section [5]. When referring to measurement, the agent corresponds to the measurement device. This can be the router itself or additional measurement equipment. The manager will be the NOC which collects the data for analysis [1], [2].
5.1. Passive Measurements
Passive monitoring is a means of tracking the performance and behavior of packet streams by measuring the user traffic without creating new traffic or modifying existing traffic [7]. It is implemented by incorporating additional intelligence into network devices to enable them to identify and record the characteristics and quantity of the packets that flow through them. Examples of the types of information that can be obtained using passive monitoring are [1], [2]
· Bit or packet rates
· Packet timing / inter-arrival timing
· Queue levels in buffers
· Traffic / protocol mixes
The traffic / protocol mix can be used to analyze the usage of different traffic types or protocols across a link [8] [9] [10].
5.2. Active Measurement
4 infrastructure. The network properties/performance are inferred
by either measuring the responses to a stimulus “probe” from the network (e.g. two-way measurement like Ping) or by collecting the result at the remote receiving end (e.g. one-way measurement like One Way Active Measurement Protocol) [1], [2].
6.
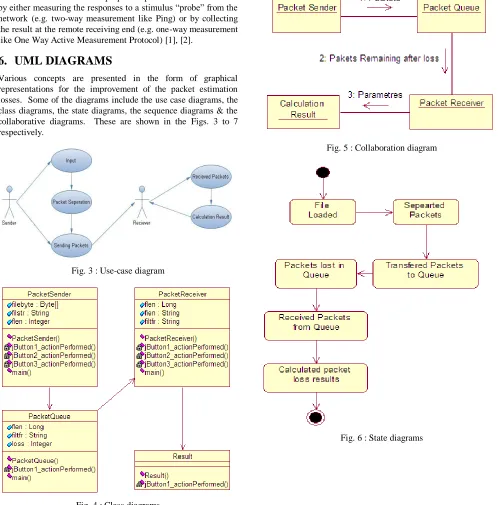
UML DIAGRAMS
[image:4.612.56.554.81.586.2]Various concepts are presented in the form of graphical representations for the improvement of the packet estimation losses. Some of the diagrams include the use case diagrams, the class diagrams, the state diagrams, the sequence diagrams & the collaborative diagrams. These are shown in the Figs. 3 to 7 respectively.
Fig. 3 : Use-case diagram
Fig. 4 : Class diagrams
Fig. 5 : Collaboration diagram
[image:4.612.53.296.233.582.2]5 Fig. 7 : Sequence diagram
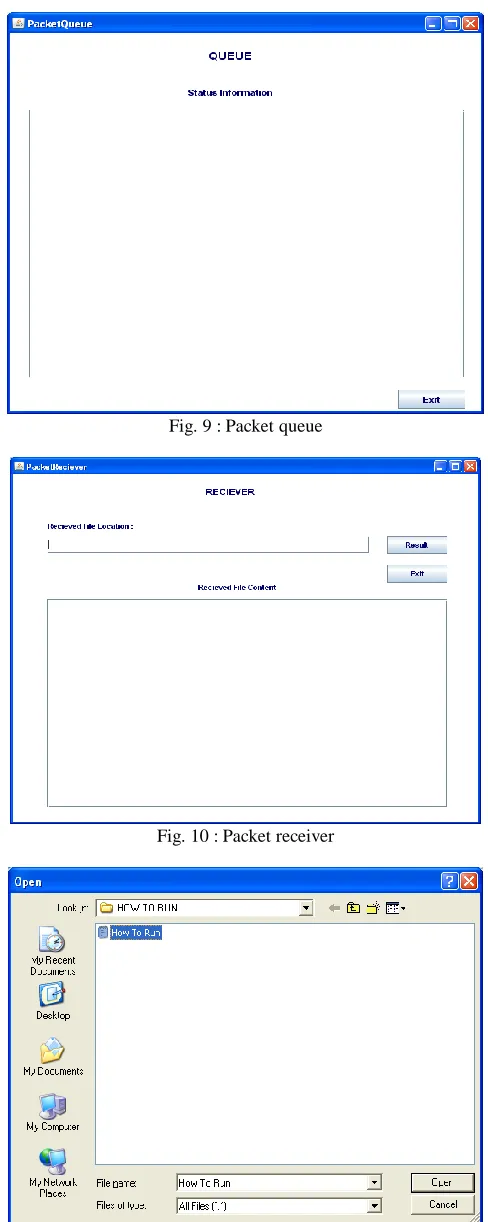
7. SIMULATION RESULTS & THE
DEVELOPED GUIs
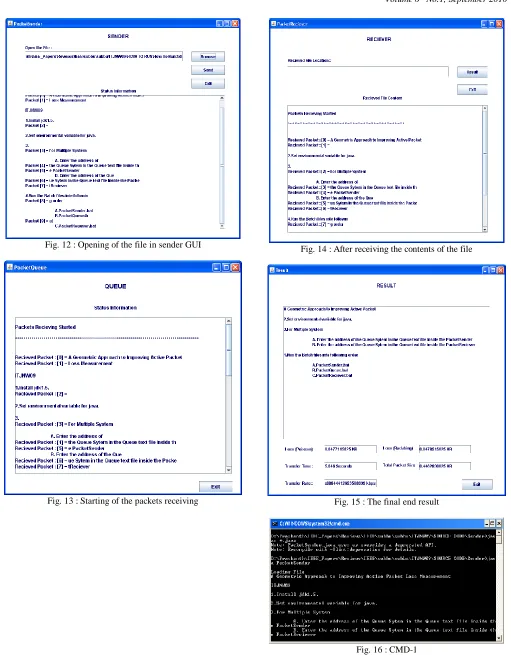
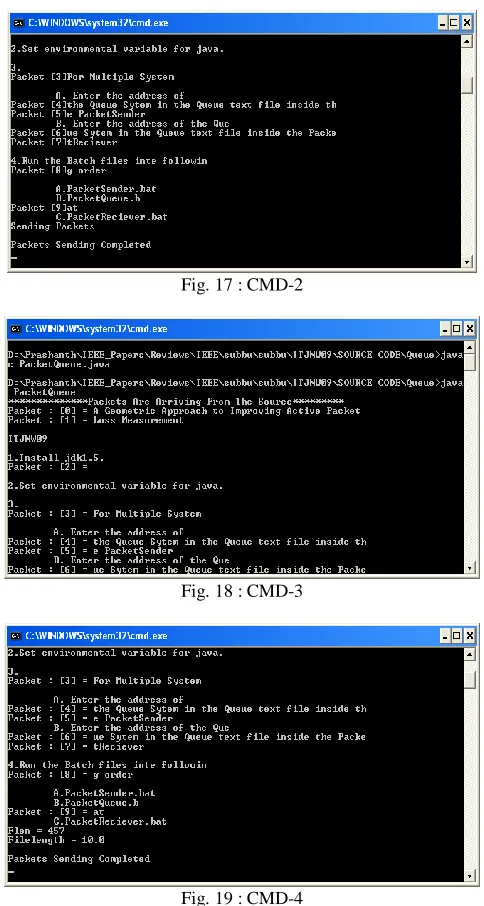
[image:5.612.58.267.73.270.2]The simulation is done in the JAVA environment. Codes are written & when the code is run, after entering various inputs & other details, the simulation results are observed. The various graphical user interfaces obtained for the improvement of the end to end packet loss estimation is presented in the Figs. 8 to 21 respectively.
Fig. 8 : Packet sender
Fig. 9 : Packet queue
Fig. 10 : Packet receiver
[image:5.612.59.289.406.620.2]6 Fig. 12 : Opening of the file in sender GUI
Fig. 13 : Starting of the packets receiving
Fig. 14 : After receiving the contents of the file
Fig. 15 : The final end result
7 Fig. 17 : CMD-2
Fig. 18 : CMD-3
Fig. 19 : CMD-4
[image:7.612.322.557.72.206.2]Fig. 20 : CMD-5
Fig. 21 : CMD-6
8. CONCLUSIONS
The research work presented in this paper is towards the application of a graphical user interface cum simulation based on the tool named BADABING to find the packet loss accurately by measuring the end-to-end packet loss characteristics such as the transfer rate for a packet per second and the probability of the packets being lost in a network, within a set of active probes. Simulations are performed in the java environment & the results are observed. Specifically, our method also gives some information that follow a geometric distribution to enable more accurate measurements than standard Poisson probing and other traditional packet loss measurement tools [1], [21].
The purpose of our study was to understand how to measure end-to-end packet loss characteristics accurately with probes and in a way that enables us to specify the impact on the bottleneck queue simple Poisson probing is relatively ineffective at measuring loss episode frequency or measuring loss episode duration, especially when subjected to TCP (reactive) cross traffic using the simulations. The simulation work is shown in such a way that the performance of the accompanying estimators relies on the total number of probes that are sent, but not on their sending rate. Moreover, simple techniques that allow users to validate the measurement output are introduced. Our works demonstrate that BADABING, in most cases, accurately estimates loss frequencies and durations over a range of cross traffic conditions [1], [21]. For the same overall packet rate, our results show that BADABING is significantly more accurate than Poisson probing for measuring loss episode characteristics. The outputs presented in the above figures show the effectiveness of the research work developed.
9. REFERENCES
[1] Joel Sommers, Paul Barford, Nick Duffield, and Amos Ron, “A Geometric Approach to Improving Active Packet Loss Measurement”, IEEE/ACM Transactions on Networking, Vol. 16, No. 2, pp. 307-320, April 2008.
8 [3] V. Paxson, “Strategies for sound internet measurement,”
Proc. ACM SIGCOMM ’04, Taormina, Italy, Nov. 2004. [4] R. Wolff, “Poisson arrivals see time averages,” Oper. Res.,
Vol. 30, No. 2, Mar. – Apr. 1982.
[5] G. Almes, S. Kalidindi, and M. Zekauskas, “A one way packet loss metric for IPPM,” IETF RFC 2680, Sep. 1999.
[6] Y. Zhang, N. Duffield, V. Paxson, and S. Shenker, “On the constancyof internet path properties,” Proc. ACM SIGCOMM Internet Measurement Workshop ’01, San Francisco, CA, Nov. 2001.
[7] Bolot., J, “End-to-end packet delay and loss behavior in the Internet”, Proc. of ACM SIGCOMM ’93, San Francisco, September 1993.
[8] Oodan A, Ward K, Savolaine C, Daneshmand M, Hoath P: “Telecommunications Quality of Service Management from legacy to emerging services” Proc. IEE elecommunications Series, Vol. 48, 2003.
[9] http://channels.lockergnome.com/it/archives/20051102_rtcp _realtime_control_protocol_voip_explained.phtml
[10]Hasib, M, Schormans, J.A., “Limitations of Passive and Active Measurement Methods in Packet Networks”, London Communications Symposium, 2003.
[11]Asawa, M, “Measuring and analyzing service levels: a scalable passive approach, IWQoS 98-1998 Sixth International Workshop on Quality of Service, pp. 3 – 12, 18-20 May 1998.
[12]Ryoki, N, Kawhara, K., Ikenaga, T and Oie, Y, “Performance analysis of queue length distribution of tandem routers for QoS measurement”, Proc. 2002 Symposium on Applications and the Internet (SAINT) Workshops, 28 Jan.-1 Feb. 2002, pp. 82 – 87.
[13]Pasztor A, Veitch, D, “A precision infrastructure for active probing”, Proc. of the PAM2001 Workshop on Passive & Active Measurements, Amsterdam, Apr. 2001.
[14]Shanlunov, S, Teitelbaum, B, Karp, A, Boote, J, W, Zekauskas, M, “A One-Way Delay Measurement Protocol (OWAMPI)”, Internet Draft, May 2003.
[15]Labit, Y., Owezarski, P., Larrieu, N, “Evaluation of active measurement tools for bandwidth estimation in real
environment”, Workshop on End-to-End Monitoring Techniques and Services, pp. 71 – 85, 15 May 2005. [16]SAA home page: http://www.cisco.com/go/saa.
[17]Cooperative Association for Internet Data Analysis http://www.caida.org/tools/measurement/skitter.
[18]National Laboratory for Applied Network Research (NLANR):http://www.moat.nlanr.net
[19]W. Leland, M. Taqqu, W. Willinger, and D. Wilson, “On the self-similar nature of Ethernet traffic (extended version),” IEEE/ACM Trans. Networking, Vol. 2, No. 1, pp. 1–15, Feb. 1994.
[20]G. Almes, S. Kalidindi, and M. Zekauskas, “A one way packet loss metric for IPPM,” IETF RFC 2680, Sep. 1999.
[21]Maheen Asib, “Analysis of packet loss probing in packet networks”, Ph.D. Doctoral Thesis, Univ. of London, UK, 2006.
AUTHOR BIOGRAPHIES
R. Padmalatha is studying in the Final year M.Tech. of
Computer Science & Engg. in Madanapalle Institute of Technology & Sciences (MITS) in Chittor district of Andhra Pradesh, India. Her current areas of interests are software engineering, networking, computer communications & networking related fields.
G. Sreedhar received the B.E. degree in Computer Science &