A Novel Clustering Algorithm using K-means (CUK)
Khaled W. Alnaji Wesam M. Ashour
The Islamic University of Gaza The Islamic University of GazaABSTRACT
While K-means is one of the most well known methods to partition data set into clusters, it still has a problem when clusters are of different size and different density. K-means converges to one of many local minima. M any methods have been proposed to overcome these limitations of K-means, but most of these methods do not overcome the limitation of both different density and size in the same time. The previous methods success to overcome one of them while fails with the others. In this paper we propose a novel algorithm of clustering using K-means (CUK). Our proposed algorithm uses K-means to cluster data objects by using one additional centroid, several partionining and merging process are used. M erging decision depends on the average mean distance where average distance between each cluster mean and each data object is determined, since the least and closet clusters in average mean distance are merged in one cluster, this process continues until we get the final required clusters in an accurate and efficient way. By comparing the results with K-means, it was found that the results obtained by the proposed algorithm CUK are more effective and accurate.
General Terms
Data Clustering, Unsupervised Classification.
Keywords
Data Clustering, K-means, Clustering using K-means, Average M ean Distance.
1.
INTRODUCTION
Clustering is an unsupervised classification; the main goal of clustering is to group similar objects together so each group becomes cluster. While Objects in the same cluster should have the most similarity , they should also have the most different from other objects of clusters. A good clustering method will produce high quality clusters with high intra-cluster similarity and low inter-cluster similarity. The quality of a clustering result depends on both the similarity measure used by the method and its implementation and also by its ability to discover some or all of the hidden patterns [1].
There are widely used similarity and dissimilarity measures for different attribute types. Each types of data, including numerical data, categorical data, binary data, and mixed-typed data, has a measurement method.
Euclidean distance is p robably the most common distance we have ever used for numerical data. For two data points x and y in d-dimensional space, the Euclidean distance between them is defined to be
Where and are the values of the jth attribute of x and y, respectively [2].
M any of clustering algorithm was proposed to solve the clustering problem, we can classify these algorithm into partioninal and hierarchical [3]. Partioninal clustering algorithms try to determine K partitions that optimize a certain objective function.
In the other hand, a hierarchical clustering is a sequence of partitions in which each partition is nested into the next partition in the sequence.
K-means is one of the most commonly -used clustering algorithm which developed by M ac Queen in 1967. K-means is a simple and efficient partition clustering algorithm. It is most effective for relatively smaller data sets. K-means converges to one of many local minima because it minimizes a distance measure between each data and its nearest cluster center [4]. M any parallel versions of the K-means algorithm [5] use the basic serial K-means at their core. Besides, a number of stochastic clustering algorithms make use of the basic K-means or some of its variations.
The main problem of K-means is converging to the global optimal solution. Every time the K-means converges to local minima because of its greedy in nature, it is expected to converge to a locally optimal solution only and not to the global optimal solution. This problem is partially solved by applying the K-means in a stochastic framework like simulated annealing (SA) and genetic algorithm (GA) etc.
Unfortunately, K-means is so sensitive to initial starting points - centroids. If the initial partitions are not chosen carefully, the computation will run the chance of converging to a local minimum rather than the global minimum solution. Because of initial starting points generated randomly, K-means does not guarantee the unique clustering results [6].
It may be clear now that we can reach the global minimum if we run K-means more than one time until the partitions number be the same for many running time, of course this action has the drawback of being very time consuming and computationally expensive.
M oreover K-means has problems when clusters are of differing sizes, densities and non-globular shapes. Several methods were proposed to solve the cluster initialization of K-means.
In [7], a refinement approach is proposed, where starting with a number of initial samples of the data set we can obtain a number of sets of center vectors. These center vectors then pass through a refinement stage to generate a set of so called good starting vectors.
A variant of a recursive method for initializing the means by running clustering problems consists of taking the entire data and then randomly perturbing it K times [6].
In [8], a genetically guided K-means has been proposed where possibility of generation of empty clusters is treated in the mutation stage.
methods are time costly and may not be applicable by keeping the K-means's inherently simple structure.
In [9] a new center vector computation strategy enables us to redefine the clustering process and to reach our goal. The modified algorithm is found to work very satisfactorily, with some conditional exceptions, which are very rare in practice.
In [10] the authors optimize the initial centroids for K-means. It utilizes all the clustering results of K-means in certain times, even though some of them reach the local optima. Then, we transform the result by combining with Hierarchical algorithm in order to determine the initial centroids for K-means.
Authors have used Principal Component Analysis (PCA) in [12] for dimension reduction and finding the initial centroid for K-means. They have used heuristics approach to reduce the number of distance calculation to assign the data point to cluster.
In [13] authors proposed the global k-means clustering algorithm, which constitutes a deterministic effective global clustering algorithm for the minimization of the clustering error that employs the k-means algorithm as a local search procedure.
In this paper, we will present a novel clustering algorithm using K-means (CUK). Our proposed algorithm tries to cluster data objects in accurate and efficient when clusters are of different size and different density .
In Section 2, we describe the K-means algorithm and distortion of the method. In Section 3, we propose CUK algorithm as a new approach to cluster data objects using K-means. Section 4 performs the experimental results on the artificial data set as well as real data set. In Section 5, we will draw conclusions.
2.
RELATED WORK
The K-means algorithm [12] is very commonly used for clustering data. To handle a large data set, a number of different parallel implementations of the K-means have also been developed. Here, we shall provide a brief description of the serial K-means and some of its properties relevant for the current work.
In crisp partitional clustering, a set D of N patterns {x1, x2, …, xN} of dimension d is partitioned into K clusters denoted by {C1, C2, …, CK} such that the sum of within cluster dispersions, i.e., the Squared Error (SSE) , as given in (1), becomes the minimum.
Here, M = {M 1 , M 2, …, M k} is the set of cluster mean.
2.1 A basic K-means algorithm
The basic K-means algorithm is commonly measured by any of intra-cluster or inter-cluster criterion. A typical intra-cluster criterion is the squared-error criterion (Equation 1). It is the most commonly used and a good measure of the within-cluster variation across all the partitions. For the current work, we consider intra-cluster squared-error function to evaluate the present scheme of clustering. In basic K-means algorithm, a set D of dimensional data is partitioned into K clusters, starting with a set of K randomly generated initial center vectors.
The process iterates through the following steps:
• Assignment of data to representative centers upon minimum distance, and
• Computation of the new cluster centers.
The process stops when cluster centers (or the SSE) become stable for two consecutive iterations.
Algorithm 1: Basic K-means Algorithm.
1. Initialize K center locations (C1, ….., Ck) 2. Assign each Xi to its nearest cluster center Ci
3. Update each cluster center Ci as the mean of all Xi that have been assigned as closest to it
4.
5. calculate
6. If the value of SSE has converged, then return (C1, ..., Ck); else go to Step 2.
3.
OUR PROPOSED ALGORITHM
Our proposed algorithm CUK uses K-means to cluster data objects when clusters are of different size and different density . We use K-means as a guide to find the optimal solution to assign data objects to the correct cluster. Thus CUK is classified as partitional clustering algorithm. CUK uses the average mean distance between each cluster mean and each data object as a metric to take decision of merging. The average mean distance acts as a measure of density of objects; the following formula was used to determine the Average M ean Distance (AM D)
Where is the cluster, is the cluster mean, is
data object of X, n is the total number of data objects, is the total number of data objects that belong to cluster and
is the Euclidian distance between and .
In this proposed algorithm we try to reach the global optimal as possible as we can through multiple splitting using K-means and merging with respect to average mean distance. Initially CUK runs K-means with one additional centroid, and then we calculate the Average M ean Distance from each cluster mean. The two clusters with least AM D are merged into one cluster. It is important to exclude data objects that have shared in previous merging process, so they will not share in merging process next time. CUK continues in this manner for K times, where K is the cluster number. We will see in the next section that CUK does better than K-means in assignment data objects to clusters. CUK makes the assignment more accurate and efficient.
3.1 Proof of merging according to Average
Mean Distance AMD:
Let us consider a 1-dimensional data set
{X1 = 1, X2 = 2, X3 = 4, X4 = 5, X5 = 10, X6 = 11, X7 = 15, X8 = 16, X9 = 19, X10 = 20, X11 = 23, X12 = 25}.
Suppose that the required clusters are C1, C2. By using CUK algorithm, we run K-means with additional one centroid and thus we get three clusters C1, C2, and C3.
Table 1. Description of Clusters Cj
Cluster 1 Cluster 2 Cluster 3 Cluster
M embers
X1, X2, X3, X4
X5, X6, X7, X8
X9, X10, X11, X12 Cluster
Table 1 shows the members of each cluster Cj along with the mean M j.
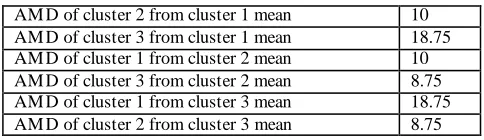
[image:3.612.53.295.137.207.2]At this stage we calculate the average mean distance for each cluster Cj, where Cj is the jth cluster, we get the following results:
Table 2. Average Mean Distance AMD of cluster Cj
[image:3.612.317.553.205.396.2]AM D of cluster 2 from cluster 1 mean 10 AM D of cluster 3 from cluster 1 mean 18.75 AM D of cluster 1 from cluster 2 mean 10 AM D of cluster 3 from cluster 2 mean 8.75 AM D of cluster 1 from cluster 3 mean 18.75 AM D of cluster 2 from cluster 3 mean 8.75
Table 2 shows the average mean distance from each data objects of cluster Cj to each cluster mean M j.
From the above table it is clear that the C2 and C3 have the closest average mean distance, so it is useful to merge C2 and C3 in one cluster and have C1 in a separate cluster. By generalizing this assumption, we get:
For a d-dimensional data set {X1, X2, X3, ….., Xn} is partitioned into K clusters C1, C2, C3, … ,Ck. By using our proposed algorithm CUK we get the following clusters C1, C2, C3, … ,Ck,Ck+1, with Average M ean Distance AM D1,AM D2,AM D3, … , AMDk, AMDk+1. M erging the least and closet two clusters will result the K clusters.
3.2 Implementation of proposed algorithm:
The following table shows the main implementation of CUK algorithmAlgorithm 2: Proposed Algorithm CUK.
1. K= number of clusters 2. for each cluster Cj
3. KN=number of clusters + 1 4. run K-means
5. get the closest clusters Ca, Cb = closest_cluster() 6. merge_cluster(Ca,Cb)
7. for each data objects Xi in cluster Cj
8. Update the list of data objects to include non-merging objects X include Xi with merge_flag=0
9. end 10. end
11. if KN == K+1
12. get the closest clusters Ca, Cb = closest_cluster() 13. merge_cluster(Ca,Cb)
14. end
The following table shows the implementation of closest_cluster procedure.
Procedure 1:Procedure Of closest_cluster
1. procedure closest_cluster() 2. {
3. for each cluster Cj
4. for each data objects Xi in cluster Cj 5. average_mean_distance=
6. end 7. end
8. for each cluster Cj
9. find two clusters Ca, Cb with least and closet average_mean_distance
10. end 11. return Ca,Cb 12. }
The following table shows the implementation of merge_cluster procedure.
Procedure 2:Procedure Of merge_cluster
1. procedure merge_cluster(Ca,Cb) 2. {
3. if average_mean_distance of Ca > average_mean_distance of Cb 4. for each data objects Xi in cluster Cb 5. assign Xi to cluster Ca
6. merge_flag of Xi=1 to exclude Xi from the next merging process.
7. end 8. else
9. for each data objects Xi in cluster Ca 10. assign Xi to cluster Cb
11. merge_flag of Xi=1 to exclude Xi from the next merging process.
12. end 13. end 14. }
[image:3.612.58.292.392.557.2]4.
EXPERIMENTAL RESULTS
This section provides a comparison of the conventional K-means and our proposed algorithm CUK in terms of accuracy and the quality of the solution when clusters are of different size and different density .
In order to analyze the accuracy of our proposed algorithm, we apply CUK to two kinds of experiments: artificial data set and real data sets.
We represent Error percentage as performance measure in the experiments. It is calculated from number of misclassified patterns and the total number of patterns in the data sets.
4.1 Artificial Data S ets
[image:4.612.317.560.102.291.2]This kind of experiment can express the ability of the proposed algorithm CUK to solve clustering cases with artificial data sets. In the experiment, we use two-dimensional data set (x and y). Then, we use normrnd function in M atlab to generate the random artificial data sets. Two artificial data sets are considered for this experimentation. The artificial data sets are DATA_SET_1, and DATA_SET_2. For example, in DATA_SET_1, there are three clusters and 2 dimensions, while in DATA_SET_2; there are three clusters and 2 dimensions as shown in Table 3.
Table 3. Description of artificial data used
Data Sets Data Size Dimension No. of clusters DATA_SET_1
335 2 3
DATA_SET_2
156 2 3
[image:4.612.56.296.352.421.2]We do clustering of the artificial data sets DATA_SET_1 and DATA_SET_1 with our proposed algorithm CUK and K-means.
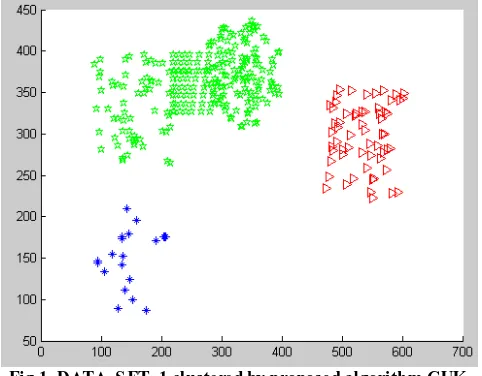
Fig 1. DATA_S ET_1 clustered by proposed algorithm CUK
Figure 1 shows the result of clustering DATA_SET_1 using our proposed algorithm CUK. We have three clusters which are green cluster (denoted by stars), red cluster (denoted by triangles), and blue cluster (denoted by points). Green cluster is the largest one.
From the above figure, we see that CUK solves the problem of different size clusters in efficient way.
Fig 2. DATA_S ET_1 clustered by K-means algorithm
Figure 2 shows the result of clustering DATA_SET_1 using K-means algorithm. We have three clusters which are green cluster (denoted by stars), red cluster (denoted by points), and blue cluster (denoted by triangles). From the above figure we see that means has problem when clusters are of different sizes. K-means fails in classification of red cluster and blue cluster, while our proposed algorithm success.
Fig 3. DATA_S ET_2 clustered by proposed algorithm CUK
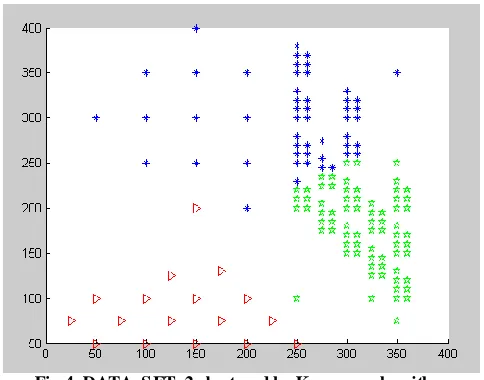
[image:4.612.318.564.388.576.2] [image:4.612.55.296.462.650.2]Fig 4. DATA_S ET_2 clustered by K-means algorithm
Figure 4 shows the result of clustering DATA_SET_2 using K-means algorithm. We have three clusters which are green cluster (denoted by stars), red cluster (denoted by triangles), and blue cluster (denoted by points). From the above figure, we see that K-means has p roblem when clusters are of different dense (AM D). K-means fails in classification of green cluster and blue cluster, while our proposed algorithm success.
4.2. Real Data Sets
In order to analyze the accuracy of our proposed algorithm, we try to make experiments using a number of real data sets. The data sets, which we use, are Iris data, Glass data, and Haberman data.
4.2.1. Iris data set
We obtained this data set from UCI Rep ository. This data set contains information about Iris flowers. There are three classes of Iris flowers, namely Iris Setosa, Iris Versicolor and Iris Virginica. The data set consists of 150 examples with 4 attributes. One class is well separable the other two. The others have a large overlap.
4.2.2. Glass data set
We obtained this data set from UCI Repository. This data set contains information From USA Forensic Science Service; 6 types of glass; defined in terms of their oxide content (i.e. Na, Fe, K, etc). There are seven classes of glass, namely building_windows_float_processed,
building_windows_non_float_processed, vehicle_windows_float_processed,
vehicle_windows_non_float_processed (none in this database), containers, tableware and headlamps. The data set consists of 214 examples with 10 attributes.
4.2.3. Haberman data set
[image:5.612.319.558.96.177.2]We obtained this data set from UCI Repository. This data set contains cases from study conducted on the survival of patients who had undergone surgery for breast cancer. There are two classes of Survival status, the patient survived 5 years or longer and the patient died within 5 year. The data set consists of 306 examples with 3 attributes. We used Error percentage to validate the results of our proposed algorithm. We compute the real data sets with our prop osed algorithm CUK and K-means, after running them for 100 times we take the average results. The results of comparison are given in Table 4.
Table 4. The Error percentage comparison between our proposed algorithm CUK and K-means
Data Set Used Algorithm Error percentage (%)
Iris data set Proposed Algorithm 16.67
K-means 21.67
Glass data set Proposed Algorithm 40.1215
K-means 44.8598
Haberman data set
Proposed Algorithm 37.5817
K-means 48.7124
Table 4 shows the Error percentage comparison between our proposed algorithm CUK and K-means. Using Iris data sets, our proposed algorithm CUK has Error percentage equals to 16.67 while K-means has Error percentage equals to 21.67; our proposed algorithm CUK has lower Error percentage than K-means.
With Glass data sets, our proposed algorithm CUK has Error percentage equals to 40.1215 while K-means has Error percentage equals to 44.8598; our proposed algorithm CUK has lower Error percentage than K-means.
Also experiment on Haberman data sets shows that our proposed algorithm CUK has Error percentage equals to 37.5817 while K-means has Error percentage equals to 48.7124; our proposed algorithm CUK has lower Error percentage than K-means.
From Table 4 and by referring to the experimental results on the real data sets, it can be observed that our proposed algorithm CUK has lower Error percentage than K-means. Since Error percentage is an indication of algorithm accuracy this means that our proposed algorithm CUK is better than K-means in clustering real data sets.
5.
CONCLUSION
In this paper, we presented a novel algorithm for performing clustering using K-means (CUK) when clusters are of different size and different density . CUK used one additional centroid, the distance measurement depends on the density of data objects from all clusters mean. Our experimental results demonstrated that our scheme could do better than the conventional K-means algorithm. While our proposed algorithm solve the problems when clusters are of differing Sizes and Densities, the conventional K-means failed.
6.
REFERENCES
[1]. D.Vanisri, and Dr.C.Loganathan, "An Efficient Fuzzy Clustering Algorithm Based on M odified K-M eans", D. Vanisri et. al. International Journal of Engineering Science and Technology Vol. 2(10), 2010, 5949-5958.
[2]. S. Guha, R. Rastogi, and K. Shim, “CURE: An Efficient Clustering Algorithm for Large Databases”, Proc. ACM SIGMOD Int’l Conf. Management of Data, ACM Press, New York, 1998, pp. 73-84.
[4]. H. Tsai, S. Horng, S. Tsai, S. Lee, T. Kao, and C. Chen. “Parallel clustering algorithms on a reconfigurable array of processors with wider bus networks”, in Proc. IEEE International Conference on Parallel and Distributed Systems, 1997.
[5]. I. S. Dhillon and D. S. M odha, “A Data-Clustering Algorithm on Distributed M emory M ultiprocessors”, in Proceedings of KDDWS on High Performance Data M ining, 1999.
[6]. S. S. Khan and A. Ahmed, “Cluster center initialization for Kmeans algorithm”, in Pattern Recognition Letters, vol. 25, no. 11, pp. 1293-1302, 2004.
[7]. P. S. Bradley and U. M . Fayyad, “Refining Initial Points for Kmeans Clustering”, in Technical Report of Microsoft Research Center, Redmond,California, USA, 1998.
[8]. F. X. Wu, “Genetic weighted K-means algorithm for clustering large-scale gene expression data”, in BM C Bioinformatics, vol. 9, 2008.
[9]. M alay K. Pakhira, " A M odified K-means Algorithm to Avoid Empty Clusters", International Journal of Recent Trends in Engineering, Vol 1, No. 1, M ay 2009.
[10].Kohei Arai, and Ali Ridho Barakbah, "Hierarchical K-means: an algorithm for centroids initialization for K-means", Saga Univ. Saga University, Vol. 36, No.1, 2007.
[11].Tajunisha and Saravanan, "Performance analysis of K-means with different initialization methods for high dimensional data", International Journal of Artificial Intelligence & Applications (IJAIA), Vol.1, No.4, October 2010.
[12]. J. B. M cQueen, “Some methods of classification and analysis in multivariate observations”, in Proc. Of fifth Barkley symposium on mathematical statistics and probability, pp. 281 - 297, 1967.
[13].Likas, Vlassis and J. J. Verbeek, “The global k-means clustering algorithm”, in Pattern Recognition , vol. 36, no. 2, pp. 451-461, 2003.