A Comparative Study of Concretes Containing Crushed
Limestone Sand and Natural Sand
Yeol Choi1*, Jae-Hyuk Choi2
1School of Architecture & Civil Engineering, Kyungpook National University, Daegu, Korea 2Department of Architecture, Chosun University, Gwangju, Korea
Email: *[email protected], [email protected]
Received December 6, 2012; revised January 10, 2013; accepted January 21,2013
ABSTRACT
This paper describes the effects of high temperatures on the strength characteristic of crushed limestone sand concrete (CLSC). To compare, natural (river) sand concrete (NSC) and CLSC specimens were exposed to the three different high temperatures. Visual color-change and weight loss were also carefully examined through the tests. The test results indi- cated that the decreasing rate of compressive strength of CLSC after exposure to high temperature is slightly lower than that of NSC while the splitting tensile strength of CLSC indicated a very similar rate compared to NSC. Therefore, the strength variations of crushed limestone sand concrete after exposal to high temperature can be similarly treated as that of the natural sand concrete. Also it can be seen that the CLSC can use 0.5 power law equation to represent the rela- tionship between compressive and splitting tensile strength before and after exposal to high temperature.
Keywords: NSC; CLSC; High-Temperature; Fine Aggregate; Compressive Strength
1. Introduction
The use of crushed sand as a fine aggregate has gradually increased in concrete industry due to the supplying short- age of natural (river) sand and the growing restrictions to get natural sand for environmental protection. The most crushed sand used in Korea are manufactured from lime- stone rocks while natural sands are weathered and worn out particles of rocks from rivers with the accounting of weathering. Based on the previous provided investiga- tions, the crushed sand has more wide different particle shapes, surface texture and grading of the fines compare to natural sand [1,2]. Furthermore, the quality of the cru- shed sand is strongly depends on the quality of original used rocks while the natural sand mostly has constant qualities. Also it was known that the crushed sand con- crete generally indicated lower workability than that of the natural sand concrete [3]. The related previous re-searches are as follows.
Akrout [4] et al. investigated an experimental study on
the effect of crushed limestone sand proportioning to the workability and the compressive strength of concrete. The experiments were conducted on the flexural strength of 14 reinforced concrete slabs and 28 reinforced con- crete beams with siliceous sand (reference sand), crushed limestone sand. The performance of the crushed lime- stone sand concretes was compared with those of sili-
ceous sand concretes. It was observed that the properties of crushed limestone sand concretes, although lower than that of siliceous sand concretes, remain completely com- parable. The results showed that the use of crushed lime- stone sand was very encouraging for the broader use in the manufacture of concrete. Kim [5] et al. reported an
experimental result on the fracture characteristics of crushed limestone sand concrete compared with those of crushed granite sand concrete and river sand concrete. The test results showed that the fracture energy of con- crete was little influenced by the type of fine aggregate. In addition, the fracture energy of crushed sand concrete was slightly higher than that of river sand concrete. Also, the fracture energy was not proportionally increased with an increase of concrete strength. The characteristic length of crushed limestone sand concrete was almost the same as that of river sand concrete or crushed granite sand concrete. Celik [6] et al. investigated the effect of crusher
dust which is a fine material formed during the process of comminution of rock into crushed sand. An experi- mental study was undertaken to find out the effects of various proportions of dust content on properties of fresh concrete and hardened concrete. This dust is composed by particles which pass 75 μm BS sieves. Test results indicate that slump of concrete decreased as the percent- age of dust content increased, and air content of fresh concrete decreased as the percentage of dust content in- creased. Also the water permeability of concrete de-
creased as the dust content percentage increased.
Menadi [7] et al. showed the influence of fines in
crushed sand on the physical and mechanical properties of concrete. Four different cement types were used while maintaining a constant water/cement ratio, and examined the influence of limestone fines in crushed sand on con- crete properties of strength, chloride-ion permeability and capillary water absorption. The test results showed that up to 15% of fines content in crushed sand could be used without adversely affecting concrete strength. The results show that concrete containing 15% of limestone fines as replacement of crushed sand reduces the water permeability and increases chloride-ion permeability.
However, the strength characteristics of crushed sand concrete in severe conditions such as in a fire has been little investigated even though the used of crushed sand gradually increased through the worlds. In the present work, an experimental program on the variations of strength characteristics of the crushed limestone sand concrete (CLSC) subjected to high temperature was con- ducted in order to provide one of comprehensive study of crushed sand concrete when compare to the natural sand concrete (NSC).
2. Experimental Program
An experimental program was designed to evaluate the high-temperature effects for the strength properties of crushed limestone sand concrete (CLSC) compare to natural sand concrete. The used specimens were subject- ed to room temperature (unheated), 200˚C, 400˚C and 800˚C, respectively.
2.1. Materials and Mix Proportion
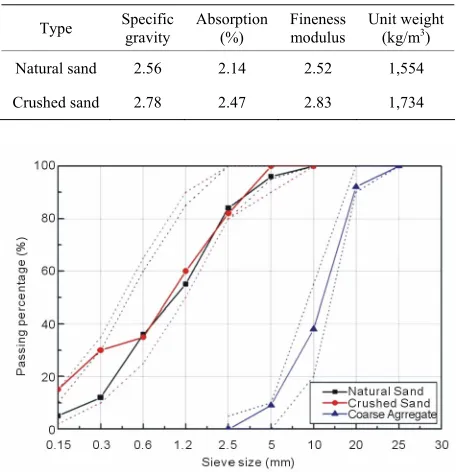
The crushed limestone sand used in the present study was obtained from the Chilgok of Kyungsang province in South Korea. The crushed limestone sand was also pre- pared in accordance with KS 2527 which states mini- mum requirements of crushed sand for concrete applica- tions in Korea. The grading curve of the used crushed limestone sand from the sieve analysis is shown in Fig- ure 1, and the chemical compositions are given in Table 1. The natural (river) sand used in this work was obtained
from Nack-dong River. The physical properties of crush- ed limestone sand and river sand used in the present in- vestigation are given in Table 2.
In order to compare the strength properties of CLSC under high temperature, two concrete mix proportions with crushed limestone sand and natural sand were used as given in Table 3. Type I/II Portland cement which
[image:2.595.308.538.100.221.2]meets the Korean Standards KS L5201 and the maximum size of 19 mm crushed coarse aggregate with a specific gravity of 2.64 were used. The used mix proportions were intended to concrete that has a normal weight and a
Table 1. Compositions of crushed limestone sand.
Component % Component %
Al2O3 14.8 SiO2 60.7
CaO 5.2 P2O5 0.4
Fe2O3 6.4 TiO2 0.9
MgO 2.3 SrO 0.1
Na2O 4.8 ZrO2 0.1
[image:2.595.309.537.248.484.2]K2O 4.3 Compressive strength (MPa) 123
Table 2. Physical properties of used fine aggregate.
Type Specific gravity Absorption (%) Fineness modulus Unit weight (kg/m3)
Natural sand 2.56 2.14 2.52 1,554
Crushed sand 2.78 2.47 2.83 1,734
[image:2.595.309.536.528.583.2]Figure 1. Grading curves of aggregate.
Table 3. Mix proportions of CLSC & NSC.
Type (kg/mWater 3) Cement (kg/m3) Fine Agg. (kg/m3) Coarse Agg. (kg/m3)
NSC 184 368 780 927
CLSC 179 358 769 958
target compressive strength of 27 MPa, respectively.
2.2. Test Specimen and Procedure
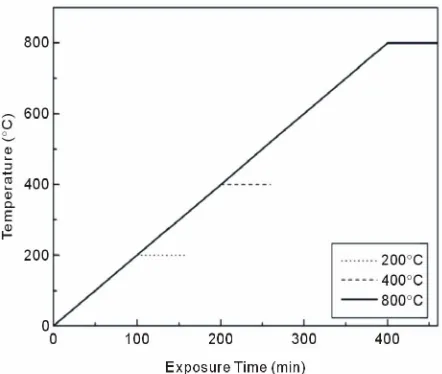
reference weight. For the specimens subjected to high temperature, all the specimens were prepared in accor- dance to KS F2257-1 which is very similar with ASTM E119, JIS A 1304, and RILEM committee 129. Speci- mens were put into the electric furnace which can raise the temperature up to 1500˚C, and then gradually heated with a constant rate of about 2˚C/min until the target temperature of 200˚C, 400˚C and 800˚C, and then kept in one hour (60 minutes) under target temperatures, respec- tively. After specimens exposed to high temperature, pull specimens out from the furnace, and then cool down na- turally until the temperature of specimen approximately reached to room temperature, and measured the weight of specimens before tests. The heating curve used in the present work is given in Figure 2.
Finally, compressive strength test was carried out in accordance to Korean Standard KS F 2405 which is very similar with ASTM C-39 using a material testing system (MTS). Also splitting tensile strength test was carried out in accordance to Korean Standard KS F 2433 which is very similar with ASTM C-496. Figures 3 and 4 show
the compressive and splitting tensile tests in this work, respectively. In this study, three specimens for each case were tested after they exposed to the four different tem- peratures of 200˚C, 400˚C and 800˚C including room temperature, respectively.
3. Test Results and Discussions
The test results of average compressive and splitting ten- sile strengths of CLSC and NSC are given in Table 4.
[image:3.595.310.538.85.268.2]During tests, there was no recognizable different failure mode between CLSC and NSC through the compressive and splitting tensile tests. Based on the targeted com- pressive strength with a very similar mix proportion, the compressive strength of CLSC at approximately 28 days
[image:3.595.310.536.291.465.2]Figure 3. Compressive strength test.
Figure 4. Splitting tensile strength test.
is lower than that of NSC at the room temperature. This result at this moment was not sure, but it may thought that the compressive strength of concrete would be af- fected by the type of fine aggregate, especially between natural and crushed sand. Also it can be seen from Table 4 that the average compressive and splitting tensile
strengths of both CLSC and NSC were definitely de- creased with the increase of exposure temperature as ex- pected, respectively.
In more details of test results, the decreasing rate of compressive strength of CLSC after exposure to high temperature is slightly lower than that of NSC at each temperature while the decreasing rate of splitting tensile strength of CLSC indicated a very similar compare to that of NSC. Under the limited number of tests in this study, it may be said that the variations of mechanical strengths of CLSC under high temperature are not sig- nificantly differ from that of NSC. However, it will be needed more number of tests on the SLCS for validation.
[image:3.595.60.281.528.715.2]The residual compressive strengths of NSC were
Table 4. Test results of mechanical properties.
Compressive strength (MPa)
Splitting tensile Strength (MPa)
Temp (˚C) 25 200 400 800 25 200 400 800
NSC 36.9 31.2 23.8 10.0 3.7 2.9 2.5 0.8
CLSC 28.2 26.5 21.1 8.6 3.6 3.1 2.3 0.7
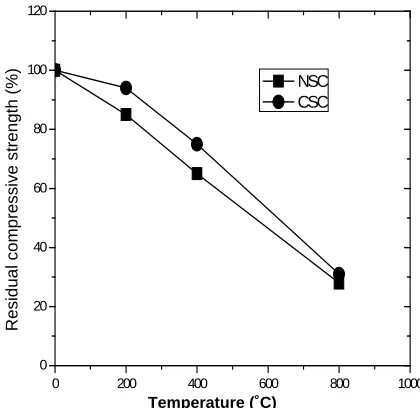
ranged 85%, 65% and 27% of the unheated concrete after exposure to 200˚C, 400˚C and 800˚C, respectively. The residual compressive strengths of CLSC were observed 94%, 75% and 31% of the unheated concrete after expo- sure to 200˚C, 400˚C and 800˚C, respectively. This result is shown in Figure 5. Also the residual splitting tensile
strengths of both CLSC and NSC were approximately 88%, 67% and 27% of the unheated concrete after expo- sure to 200˚C, 400˚C and 800˚C, respectively. This result is shown in Figure 6. Furthermore, the splitting tensile
strengths of NSC and CLSC are 9.27% and 11.54% of their compressive strength at a temperature of 200˚C, and are 10.29% and 10.79% at a temperature of 400˚C, and are 7.80% and 8.63% at a temperature of 800˚C, respec- tively. Therefore it may conclude that the temperature effect on the strength properties of crushed limestone sand concrete does not showed much difference compar- ed to that of natural sand concrete.
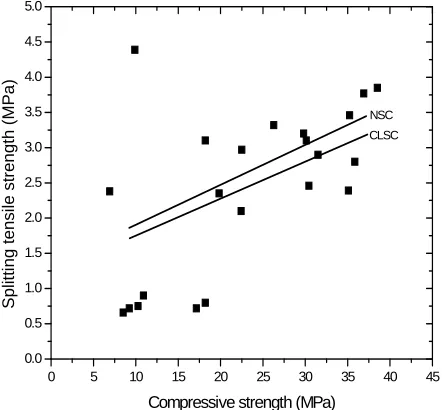
In general, a simple 0.5 power law model has become one of the most widely used analytical models for de- scribing the relationship between the splitting tensile and compressive strength in concrete from a large number of tests [8]. In this study, a regression analysis (curve fitting technique) was adopted in order to obtain the 0.5 power law equation of CLSC and NSC. That is to be said that the splitting tensile strength is assumed to proportional to the square root of its compressive strength. The 0.5 pow- er law model used in this study is to be expressed as Equation (1).
sp c
f f (1)
where, fsp= the splitting tensile strength and fc = the
compressive strength. The obtained equations of CLSC and NSC from the regression are given Equations (2) and (3), respectively.
0.509
sp c
f f (2)
0.560
sp c
f f
0 200 400 600 800 100
0 20 40 60 80 100 120
(3)
Res
idual com
p
ress
ive st
rength (%)
NSC
The obtained regression curves from the Equations (2) and (3) are plotted in Figure 7 with the experimental
data. It can be seen that the regression curves from Fig- ure 7 showed a relatively good relationship between the
splitting and compressive strength with somewhat scatter in lower strength. The coefficient of determination (COD = R2), which indicates how much of the total vasriation
0
CSC
0 200 400 600 800 1000
0 20 40 60 80 100 120
[image:4.595.59.285.100.171.2]Temperature (˚C)
Figure 5. Variation of residual compressive strength.
R
e
s
id
u
a
l sp
litti
n
g
te
n
s
ile
s
tr
e
n
g
th
(
%
)
NSC CSC
Temperature (˚C)
Figure 6. Variation of residual splitting tensile strength.
[image:4.595.317.526.318.526.2]test data is important because the more test data may provide the better statistical validation for various factors. However, the obtained equation in this study is only as a function of their compressive strength using a relatively small number of experimental data.
100 150 200 250 300 350 400
0 5 10 15 20 25 30 35
8000
C 4000
C
The weight loss of concrete after exposal of high tem- perature will be a reflection of how much water is mainly lost over time. It will depend on the cement amount, wa- ter-cement ratio and its service environment. Table 5
shows the average weight losses of CLSC and NSC. The average weight losses observed in this study are to be approximately 4%, 11% and 20% that of the unheated concrete after exposure to 200˚C, 400˚C and 800˚C, re- spectively. From the Table 5, it can be seen that the
weight loss of CLSC did not significantly differ from that of NSC at each high temperature. A similar result had been reported about ordinary concrete at high tempera- tures [6].
In this work, it was tried to figure out a relation be- tween the reduction of compressive strength and weight loss of CLSC and NSC after exposal to high temperature using regression method. The obtained regression curves with standard deviations of 3.15 and 1.42 MPa for CLSC and NSC are shown in Figure 8. From the Figure 8, the
compressive strength of both CLSC and NSC are almost
0 5 10 15 20 25 30
0.0 0.5 1.0 1.5 2.0 2.5 3.0 3.5 4.0 4.5 5.0
35 40 45
Sp
lit
tin
g t
e
n
s
ile
s
tre
ng
th
(M
P
a
)
Compressive strength (MPa) NSC CLSC
[image:5.595.312.533.86.266.2]Figure 7. Relationship between compressive and splitting tensile strengths.
Table 5. Weight losses at high temperature.
Weight loss (g)
Tem.(˚C) 25 200 400 800
NSC 0 146 g 227 g 325 g
CSC 0 143 g 240 g 322 g
Co
mpre
ssi
ve
stren
gth re
du
ctio
n (MPa
)
Variation of Mass Loss (g) 2000
C NSC
CLSC
Figure 8. Strength-weight loss variation.
linearly decreased when the increase of weight loss due to the high temperature. As a result, the reduction of com- pressive strength of concrete is virtually proportioned to the weight loss of concrete after exposed to high tem- perature.
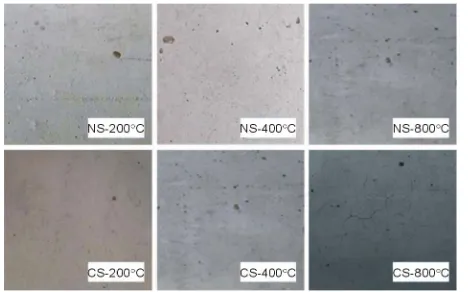
In this study, visual observation was carefully con- ducted on the surface of specimens before and after ex- posed to 200˚C, 400˚C and 800˚C, respectively. The sur- face color of both NSC and CLSC seems to no change after exposed to 200˚C, but NSC showed a pink-like color after exposed to 400˚C while the CLSC still has not changed. Furthermore, NSC showed a more dark pink- like color after exposed to 800˚C while the CLSC still has not showed a noticeable changed. To figure out color variation of NSC and CLSC, a sample of crushed lime- stone sand and river sand were heated with same condi- tions of concrete. The test results showed that the color of natural (river) sand supposed to change to pink-like after 400˚C, and then almost same dark-pink color shown from the NSC after exposed to 800˚C, while the crushed limestone sand did not showed any significant color change. Compare with the two tests, the color change of NSC was very similar to that of the natural sand itself under high temperature. It can be thought that the main color change of NSC approximately after 400˚C comes from the color change of natural (river) sand. In this re- sult, more detailed studies are required in the future.
4. Conclusions
Based on the experimental results of the strength charac- teristic of CLSC and NSC subjected to high temperature, the following conclusions were drawn:
[image:5.595.62.283.401.606.2] [image:5.595.59.285.663.734.2]Figure 9. Surface color variations after exposal to high-tem- peratures.
number of tests increased, the difference will not be found or will be very similar. It was found that the CLSC also can use 0.5 power law equation to represent the rela- tionship between compressive and splitting tensile strength before and after exposal to high temperature. Based on the test results, it can be concluded that the variation of strength properties of crushed limestone sand concrete (CLSC) under high temperature was very similar to that of natural sand concrete (NSC). Therefore, the strength variations of crushed limestone sand concrete after ex- posal to high temperature can be treated as that of the natural sand concrete.
5. Acknowledgements
The work presented in this paper was funded by National Research Foundation of Korea (2010) under the Ministry of Education, Science and Technology.
REFERENCES
[1] P. Poitevin, “Limestone Aggregate Concrete, Usefulness and Durability,” Cement and Concrete Composites, Vol.
21, No. 11, 1999, pp. 99-105.
[2] I. K. Netinger and Ivica Guljas, “The Effects of High Temperatures on the Mechanical Properties of Concrete Made with Different Types of Aggregates,” Fire Safety Journal, Vol. 46, No. 7, 2011, pp. 425-430.
doi:10.1016/j.firesaf.2011.07.002
[3] Z. Xing, A. L. Beaucour, R. Hebert, A. Noumowe and B. Ledesert, “Influence of the Nature of Aggregates on the Behaviour of Concrete Subjected to Elevated Tempera- ture,” Cement and Concrete Research, Vol. 41, No. 4, 2011, pp. 392-402. doi:10.1016/j.cemconres.2011.01.005 [4] K. Akrout, P. Mounanga, M. Ltifi and N. Jamaa, “Rheo-
logical, Mechanical and Structural Performances of Cru- shed Limestone Sand Concrete,” International Journal of Concrete Structures and Materials, Vol. 4, No. 2, 2010, pp. 97-104.
[5] J. K. Kim, C. S. Lee, C. K. Park and S. H. Eo, “The Frac- ture Characteristics of Crushed Limestone Sand Con- crete,” Cement and Concrete Research, Vol. 27, No. 11, 1997, pp. 1719-1729.
doi:10.1016/S0008-8846(97)00156-7
[6] T. Celik and K. Marar, “Effects of Crushed Stone Dust on Some Properties of Concrete,” Cement and Concrete Re- search, Vol. 26, No. 7, 1996, pp. 1121-1130.
doi:10.1016/0008-8846(96)00078-6
[7] B. K. Menadi, S. Khatib and A. Aït-Mokhtar, “Strength and Durability of Concrete Incorporating Crushed Lime- stone Sand,” Construction and Building Materials, Vol. 23, No. 2, 2009, pp. 625-633.
doi:10.1016/j.conbuildmat.2008.02.005
[8] Y. Choi and R. L. Yuan, “Experimental Relationship Be- tween Splitting Tensile Strength and Compressive Strength of GFRC and PFRC,” Cement and Concrete Research, Vol. 35, No. 8, 2005, pp. 1578-1591.
doi:10.1016/j.cemconres.2004.09.010