On the Decision Structures and Knowledge Discovery for
ANP Modeling
Lawrence W. Lan1, Wei-Wen Wu2, Yu-Ting Lee2
1Department of Tourism Management, Ta Hwa University of Science and Technology, Taiwan 2Department of Business and Tourism Planning, Ta Hwa University of Science and Technology, Taiwan
Email: [email protected]
Received November 10, 2012; revised December 14, 2012; accepted January 16,2013
ABSTRACT
This paper proposes an integrative framework for network-structured analytic network process (ANP) modeling. The underlying rationales include: 1) creating the measuring items for the complex decision problems; 2) applying factor analysis to reduce the complex measuring items into fewer constructs; 3) employing Bayesian network classifier tech-nique to discover the causal directions among constructs; 4) using partial least squares path modeling to test the causal relationships among the items-constructs. The proposed framework is implemented for knowledge discovery to a case of high-tech companies’ enterprise resource planning (ERP) benefits and satisfaction in Hsinchu Science Park, Taiwan. The results show that the proposed framework for ANP modeling can reach a satisfactory level of convergent reliability and validity. Based on the findings, pragmatic implications to the ERP venders are discussed. This study has shed new light on the long neglected, yet critical, issue on decision structures and knowledge discovery for ANP modeling.
Keywords: Analytic Network Process; Bayesian Network Classifier; Enterprise Resource Planning; Knowledge
Discovery; Partial Least Squares Path Modeling
1. Introduction
The analytic hierarchy process (AHP) and the analytic network process (ANP) are two well-established tech- niques, which can help decision makers find one that best suits their goal(s) and the problem, with provision of a comprehensive framework for structuring the decision problems, for quantifying the elements, for relating the elements to overall goal(s), and for evaluating alternative solutions [1]. Applications of the AHP and ANP tech- niques can be found in different fields (e.g., business, industry, government, among others) for choosing the favorite alternative from a given set of alternatives and for other purposes such as ranking, prioritization, resource allocation, benchmarking, quality management, and con- flict resolution [2,3]. In theory, each element in the AHP hierarchy is assumed independent of one another; namely, the decision criteria must be independent of all the others, and the alternatives are independent of the decision cri- teria and of each other. In many real world decision pro- blems, however, the elements may be intertwined and interdependent; in this case, the AHP is not appropriate [4,5] but the ANP would be effective to analyze this kind of problems [6-8].
Generally, the AHP assumes a unidirectional hierar- chical relationship among decision levels—the top ele-
ment of the hierarchical structure is the overall goal(s) for the decision model, and the hierarchy devolves to more specific attributes until a level of manageable deci- sion criteria is met. In contrast, the ANP does not require this strict hierarchical structure; instead, it structures a decision problem as a network that involves interaction and feedback within clusters of elements (inner depend- ence) and between clusters (outer dependence) [6-8]. Both AHP and ANP employ a system of pairwise com- parisons to measure the weights or to ratio the scale pri- orities of the elements, and finally to rank the alternatives in the decision [8]; however, there are some differences between them. For instance, the ANP is a nonlinear structure, whereas the AHP is hierarchical and linear. The ANP is based on mathematical theory that solves all kinds of dependence systematically, and it features the network decision structures without strong restriction on the hierarchical decision structures used by the AHP [9]. In this sense, the ANP can be regarded as a more general form of the AHP used in multi-criteria decision analysis to tackle dependence in feedback with the supermatrix approach [10-12].
tiveness of e-learning system in uncertainty [15], a selec- tion model for auditing software [16], among others. Many have involved complex decisions about economic, political, social and technological applications with be- nefits, opportunities, costs and risks [9,17]. Studying these applications can be very useful in understanding the complexities of the real world decision problems [18]. What seems to be lacking, however, is the “knowledge discovery” associated with ANP modeling, including the selection of decision structure types and the acquisition of causal relationships among elements. While creating the decision structures for ANP modeling, one major concern is selecting a proper structure best representing the decision problem. A good decision structure should be a form that makes the problem easier to visualize and better to understand its relevant elements and their inter- actions. Another concern is to introduce proper method(s) to solve the decision problem with greater efficiency, re- levance and confidence [19].
Viewed in this light, this paper aims to contribute an integrative framework that can not only create the deci- sion structures for ANP modeling but can also scrutinize and test the causal relationships among elements. Spe- cifically, the underlying framework will include identifi- cation of the measuring elements with principal compo- nent factor analysis, exploration of the causal directions among clusters with Bayesian network (BN) classifiers, and test of the causal relationships with partial least squares (PLS) path modeling. A case of enterprise resource plan-ning (ERP) knowledge acquisition for the high-tech com-panies in Taiwan is illustrated. The remainder of this paper is organized as follows. In Section 2, a literature review on the ANP decision structures is undertaken. In Section 3, the proposed framework is introduced with elaboration of the BN classifiers and the PLS path modeling. In Section 4, the proposed framework is im-plemented to the ERP knowledge discovery. Finally, conclusions and directions for future research are ad-dressed.
2. Decision Structures for ANP Modeling
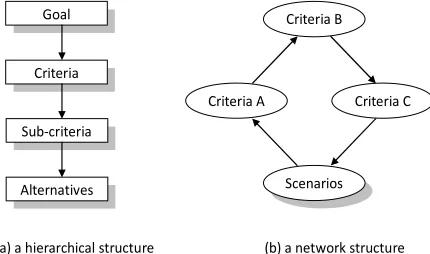
In literature, two basic types of decision structures for ANP modeling can be identified—hierarchy-structured type and network-structured type. For instance, [11] demon-strated several famous ANP models such as Car Purchase BCR Model and Hamburger Model—the former is a hi-erarchy-structured type and the latter is a network-struc- tured type. A hierarchy-structured decision problem can be expressed as the way that the goal controls a series of subordinated clusters of criteria, subcriteria, and alterna-tives. In contrast, a network-structured problem encom-passes several strategic clusters linking one by one in turn as a networked system. Both structured types for
[image:2.595.316.531.589.716.2]ANP modeling have been applied in various problems, but the network-structured type seems to be more useful than a hierarchy-structured type.
Figure 1 illustrates the two basic structured types for
ANP modeling of the simplest form without inner de- pendencies. For a hierarchy-structured ANP modeling, a series of clusters of “Criteria”, “Sub-criteria”, and “Al- ternatives” are developed under the goal as shown in
Figure 1(a). For a network-structured ANP modeling, in
contrast, several clusters of “Strategic criteria” (A, B, C) and “Scenarios” are circled as a ring as shown in Figure 1(b). In practice, several independent criteria can be un-
der the goal as well as several sub-criteria under a spe- cific criterion in a hierarchy-structured ANP modeling. Likewise, several elements may further intertwine with each strategic criterion in a network-structured ANP mo- deling.
Both types of decision structures for ANP modeling represent the logical conceptualization of a problem; the choice of them depends on the purpose of the decision making as well as on the complexity of the problem itself. Reference [19] suggested using the hierarchy-structured modeling when the elements and their connections are easily located in levels of dominance with connections that transmit influence downwards. If, however, the ele- ments and their connections are complicated and can only be grouped into clusters that do not fit well in well-defined levels, a network-structured modeling is perhaps more suitable. In other words, when the prob- lems can be readily represented as hierarchical decision structures, a hierarchy-structured ANP modeling can be appropriate; otherwise, the network-structured modeling should be used. More importantly, when risk and uncer- tainty are involved, the network-structured ANP model- ing would be more appropriate because it can better cap- ture the complex effects of interplay in human society; it is risky to use the hierarchy-structured ANP modeling because many influences can be lost by not representing them with the needed connections [19]. Generally, it is favorable to employ the network-structured ANP model- ing, rather than the hierarchy-structured one, to conduct
Goal
Criteria
Sub‐criteria
Alternatives
Criteria A
Criteria B
Criteria C
Scenarios
analyses of important, intertwined complex decision pro- blems. The ERP case study of this paper will make use of the network-structured ANP modeling.
3. Methodologies
Many researchers have proposed solution frameworks to implement the networked-structured ANP modeling. For instance, [19] suggested a process to implement the net- work-structured ANP modeling as follows: 1) catego- rizing the elements into suitable clusters; 2) determining the influences; and 3) examining the network by clusters forward and backward. Reference [20] proposed a frame- work to implement the network-structured ANP model- ing: 1) network model construction; 2) pairwise com- parisons and priority vectors; 3) supermatrix formation and transformation; and 4) final priorities. Reference [21] also proposed a similar framework: 1) model construc- tion and problem structuring; 2) pairwise comparison matrices of interdependent component levels; 3) super- matrix formation; and 4) prioritizing and selecting al- ternatives. The above works have placed the spotlights on the analytic process wherein the decision structures are based on experts’ judgments. In many marketplaces, however, creating the decision structures from custom- ers’ perspectives is perhaps more imperative than ex- perts’ views, e.g., to make the sales pitch more effective in marketing contexts.
3.1. The Proposed Framework
Define abbreviations and acronyms the first time they are used in the text, even after they have been defined in the abstract. Abbreviations such as IEEE, SI, MKS, CGS, sc, dc, and rms do not have to be defined. Do not use abbre- viations in the title or heads unless they are unavoidable.
By elaborating the aforementioned frameworks, this study attempts to create a stringent network-structured ANP modeling system, from which the essential knowl- edge (e.g., crucial causal relationships among the ele- ments) within the decision structures can be explored in hope of helping the decision makers to draw pragmatic implications for use. Our proposed framework integrates the following four steps:
Step 1: Creating measuring items for the complex de- cision problem. To create the measuring items (i.e., crite- ria) for the complex decision problems, one can refer to relevant literature and/or conduct the experts’ interview. Upon identifying the complex measuring items, the ques- tionnaire questions can be developed accordingly. After that, one can further distribute the questionnaires to the participated subjects (in our case study, the ERP users) and collect their opinions.
Step 2: Reducing complex measuring items into fewer
constructs and conducting construct validity. The prin-
cipal component factor analysis can reduce the complex measuring items into fewer constructs (i.e., clusters) in an objective manner. Moreover, the factor analysis can further conduct the construct validity. This is different from the conventional ANP modeling that directly de- pends on experts’ opinions to subjectively establish the constructs associated with the corresponding measuring items without validity.
Step 3: Uncovering causal directions among con-
structs. The Bayesian network (BN) classifier with ge-
netic algorithm (GA) can solve the search problem in the network structure to uncover the causal directions among constructs. This is also different from the conventional ANP modeling that depends on experts’ opinions to sub- jectively assume the causal directions among constructs.
Step 4: Testing and estimating the causal relationships among items-constructs. Finally, the partial least squares (PLS) path modeling is used to test and estimate the causal relationships among items-constructs. According to [22], there are two essential tasks in conducting the PLS path modeling: 1) checking convergent reliability and validity; 2) explaining path coefficients and predic- tive ability. In so doing, one can acquire three kinds of information, including standardized regression coeffi- cients for the paths, R2 values for the endogenous vari- ables, and factor loadings for the measuring items.
3.2. The BN Classifier
In this study, the BN classifier is used as a causal analy- sis technique to create a causal map—a graphical repre- sentation exhibiting causal relationships between a “class” variable and its related “attribute” variables. The BN has some merits as follows. It needs no rigid statistical as- sumptions; it graphically displays as a directed acyclic graph (DAG); and it represents a set of conditional inde- pendence constraints among a given number of variables and their related conditional probability distributions [23]. Specifically, a BN is a DAG that consists of a set of nodes/vertices linked by arcs, where the nodes represent the attributes and the arcs stand for the relationships among the connected attributes. In a DAG, the arcs des-ignate the existence of direct causal relations between the linked variables, and the strengths of these relation-ships are expressed in terms of conditional probabilities [24].
including K-means clustering, decision trees, BN classi- fiers, regression models, and neural networks. Among them, BN classifier with the GA is suitable for net- work-structured ANP modeling. Therefore, this study employs the GA technique to solve for the searching pro- blem in the network-structured space.
3.3. The PLS Path Modeling
Structural equation modeling (SEM) is a well-known and widely used causal analysis technique, which performs the task of modeling relationships between latent vari- ables [26-32]. Linear structural relations (LISREL) and PLS path modeling are two main SEM approaches—the former maximizing the explained covariation among the various constructs, while the later maximizing the ex- plained variation among the various constructs [23,33]. However, there are some differences between them. First, the LISREL assumes homogeneity in the observed po- pulation; in contrast, the PLS path modeling does not impose on rigorous assumptions, thus it is more suitable for real applications, in particular when the models are complex [33,34]. Second, the LISREL requires a large sample size, but the PLS path modeling needs only a minimum sample size of 30 [35,36]. Third, the LISREL highlights theory confirmation, while the PLS path mod- eling stresses causal explanation [23]. Reference [37] also indicated that the PLS path modeling is more suit- able for analyzing exploratory models with no rigorous theory grounding; it requires minimal assumptions about the statistical distributions of data sets; and it can work with smaller sample sizes.
We can apply the PLS path modeling by the software SmartPLS to obtain the decision structures with causal relationships. In conducting the PLS path modeling one may also check the convergent reliability and validity. According to [38], one can accept the PLS results if the value of composite reliability is higher than 0.7 and the average variance extracted (AVE) value is higher than 0.5. In light of these favorable merits, this study employs the PLS path modeling with the software SmartPLS to test and estimate the significant causal relationships. De- tails of the PLS path modeling can be referred to [39].
4. Case Study
After the text edit has been completed, the paper is ready Our case study intends to create a network-structured ANP modeling system to discover knowledge about the relationships between users’ perceived ERP benefits and satisfaction for the high-tech enterprises in Hsinchu Sci- ence Park (HSP), which is the first science-based Indus- trial park having the greatest contribution to the devel- opment of high-tech industries in Taiwan.
An ERP system integrates the internal and external
management information across the entire enterprise with different activities, including manufacturing, sales and services, finance/accounting, among others, by ways of an integrated software application. It can facilitate the flows of information between all business functions in- side the boundaries of the enterprise; it can also manage the connections to outside stakeholders. Since the life spans of high-tech products are usually not very long, introducing the ERP system is especially imperative for a high-tech enterprise to better cope with the competitive, changeable markets by enhancing its production effici- ency and service effectiveness. An in-depth understand- ing of the causal relationships between users’ perceived ERP benefits and satisfaction would certainly help the venders to provide more appropriate ERP systems for the high-tech enterprises. To this end, this case study targets on the 405 enterprise companies listed in the HSP Ma- nufacturer Directory. We attempt to create the causal relationships between the 405 companies’ perceived ERP benefits and satisfaction, which should be regarded as an important, intertwined complex decision problem. Hence, a network-structured, in lieu of a hierarchy-structured ANP modeling, is used. Following the four steps of our proposed integrative framework, we present the findings as follows.
Step 1: Creating measuring items for the complex de- cision problem. A preliminary questionnaire is developed according to [30,40] and the preliminary questions are revised by some ERP experts. A total of twenty-two measuring items are finally selected in the questionnaire to elucidate the users’ perceived ERP benefits and satis- faction, detailed in Table 1. Of these twenty-two items,
the twenty-one items are viewed as the potential factors affecting the last item—SAT (Overall satisfaction about ERP implementations). In our questionnaire survey, each item question is evaluated on a Likert scale ranging from 1 (strongly disagree) to 7 (strongly agree). The question- naire questions have been distributed to the representa- tive IT/MIS managers of the 405 enterprise companies. A total of 250 valid responses were obtained for further analysis (response rate: 62%).
Step 2: Reducing complex measuring items into fewer
constructs and conducting construct validity. The prin-
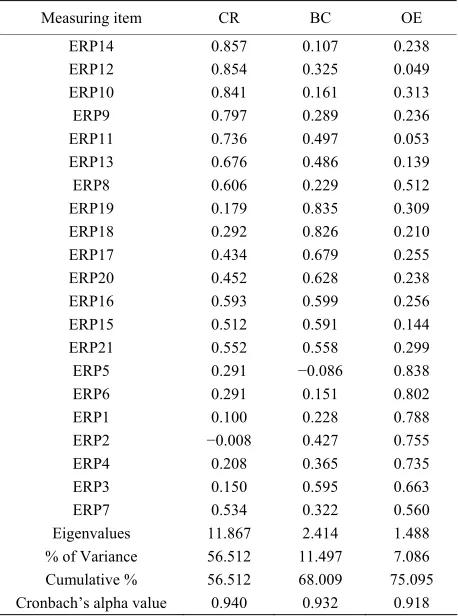
cipal component factor analysis with varimax rotation technique is employed to reduce the measuring items into fewer constructs. The results are presented in Table 2.
Table 1. The measuring items for the case study.
Measuring item Description ERP1 Quality improvement ERP2 Productivity improvement ERP3 Better resource management ERP4 Improved decision making and planning ERP5 Better production scheduling ERP6 Better process improvement ERP7 Cycle time reduction ERP8 Customer complain reduction ERP9 Better customer retention ERP10 Customer services improvement ERP11 Sales performance improvement ERP12 Generate product differentiation ERP13 Improved product cycle ERP14 Increased marketing capability ERP15 Inventory reduction ERP16 Decreased operating expenses ERP17 Increased business profitability ERP18 Decreased labour efforts ERP19 Support organizational changes ERP20 Support business growth ERP21 Support business alliance
[image:5.595.58.287.402.710.2]SAT Overall satisfaction about ERP implementations
Table 2. The results of factor analysis.
Measuring item CR BC OE ERP14 0.857 0.107 0.238 ERP12 0.854 0.325 0.049 ERP10 0.841 0.161 0.313 ERP9 0.797 0.289 0.236 ERP11 0.736 0.497 0.053 ERP13 0.676 0.486 0.139 ERP8 0.606 0.229 0.512 ERP19 0.179 0.835 0.309 ERP18 0.292 0.826 0.210 ERP17 0.434 0.679 0.255 ERP20 0.452 0.628 0.238 ERP16 0.593 0.599 0.256 ERP15 0.512 0.591 0.144 ERP21 0.552 0.558 0.299 ERP5 0.291 −0.086 0.838 ERP6 0.291 0.151 0.802 ERP1 0.100 0.228 0.788 ERP2 −0.008 0.427 0.755 ERP4 0.208 0.365 0.735 ERP3 0.150 0.595 0.663 ERP7 0.534 0.322 0.560 Eigenvalues 11.867 2.414 1.488 % of Variance 56.512 11.497 7.086 Cumulative % 56.512 68.009 75.095 Cronbach’s alpha value 0.940 0.932 0.918
CR: Customer Relationships; BC: Business Competencies; OE: Operational Efficiencies.
the other seven items (ERP15 through ERP21; Cron- bach’s alpha value 0.932) is termed “Business Compe- tencies” (BC). The construct composed of another seven items (ERP1 through ERP7; Cronbach’s alpha value 0.918) is called “Operational Efficiencies” (OE). In this step, the results also indicate the KMO value is 0.964 and the Bartlett’s test of sphericity is significant (p < 0.05), suggesting that the factor analysis is worth conducting. The three principal components can account for 75% of the total variance, which is satisfactory. Moreover, the high Cronbach’s alpha values for these three principal components also indicate a high internal consistency.
Step 3: Uncovering causal directions among con-
structs. When utilizing the BN classifiers to detect the causal directions among clusters for a network-structured ANP modeling, the cluster of scenarios should be viewed as the “class” variable while the clusters of strategic cri- teria should be regarded as the “attribute” variables. Us- ing the software WEKA to implement the BN classifier with the GA, one can obtain the causal directions among clusters/constructs, displayed in Figure 2.
Step 4: Testing and estimating the causal relationships
among items-constructs. According to [22], the causal
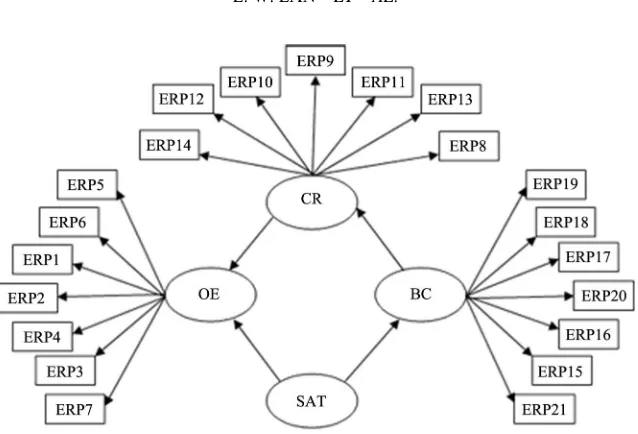
directions acquired by the BN classifiers must be re- versed before performing the PLS path modeling in order to accurately interpret the causal meanings. After revers- ing the causal directions of Figure 2, we then apply the
PLS path modeling by the software SmartPLS to obtain the decision structure with causal relationships, displayed in Figure 3. The numerical figures inside the constructs
denote the R2 values, whereas those figures above the arrowed lines indicate the path coefficients. Table 3 pre-
sents the convergent reliability and validity. As afore- mentioned, one can accept the PLS results if the value of composite reliability is higher than 0.7 and the average variance extracted (AVE) value is higher than 0.5 [38]. We note the values of composite reliability are all higher than 0.7 and the values of AVE are all higher than 0.5, suggesting that our case study has reached a satisfactory level of convergent reliability and validity.
5. Discussion
From Figure 3, we note that the item ERP12 (Generate
Figure 2. The causal directions among items-constructs.
[image:6.595.56.286.546.619.2]Figure 3. The decision structure with causal relationships among items-constructs.
Table 3. The convergent reliability and validity.
AVE CR R2 CA C R BC 0.716 0.946 0.640 0.933 0.716 0.454 CR 0.737 0.951 0.377 0.940 0.737 0.268 OE 0.676 0.936 0.920 0.676 SAT 0.726 1.000 0.415
AVE: Average Variance Extracted; CR: Composite Reliability; CA: Cron- bach’s Alpha; C: Community; R: Redundancy.
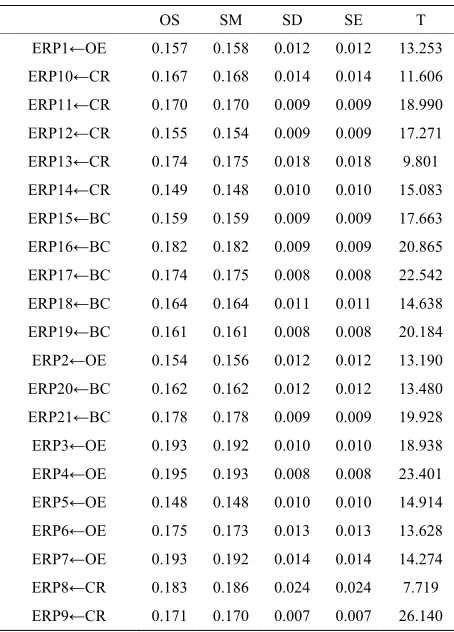
Table 4 details the significant item loadings. Table 5
presents the significant path coefficients between con- structs. Note that the path “CR → BC” (path coefficient 0.800) has the greatest positive direct effect, followed by the path “OE → CR” (path coefficient 0.614). We also note that OE plays a key role in the decision structure because OE has been identified as the “source” or “root”
of path “OE→SAT” and path “OE→CR→BC→SAT”. The findings reveal that SAT (Overall satisfaction) has been affected, directly or indirectly, by CR, BC and OE. Furthermore, the path “OE→CR→BC→SAT” reveals that OE and CR are not equally important, nor for CR and BC. The foremost construct is OE, which directly affects construct CR and indirectly influences construct BC. In other words, once the ERP users have perceived that ERP can enhance OE (Operational Efficiencies), then it would tap the cognition of ERP to improve both CR (Customer Relations) and BC (Business Competen- cies).
Table 4. The test results of item loadings.
OS SM SD SE T ERP1←OE 0.157 0.158 0.012 0.012 13.253 ERP10←CR 0.167 0.168 0.014 0.014 11.606 ERP11←CR 0.170 0.170 0.009 0.009 18.990
ERP12←CR 0.155 0.154 0.009 0.009 17.271 ERP13←CR 0.174 0.175 0.018 0.018 9.801 ERP14←CR 0.149 0.148 0.010 0.010 15.083 ERP15←BC 0.159 0.159 0.009 0.009 17.663
ERP16←BC 0.182 0.182 0.009 0.009 20.865 ERP17←BC 0.174 0.175 0.008 0.008 22.542 ERP18←BC 0.164 0.164 0.011 0.011 14.638
ERP19←BC 0.161 0.161 0.008 0.008 20.184 ERP2←OE 0.154 0.156 0.012 0.012 13.190 ERP20←BC 0.162 0.162 0.012 0.012 13.480 ERP21←BC 0.178 0.178 0.009 0.009 19.928
ERP3←OE 0.193 0.192 0.010 0.010 18.938 ERP4←OE 0.195 0.193 0.008 0.008 23.401 ERP5←OE 0.148 0.148 0.010 0.010 14.914
ERP6←OE 0.175 0.173 0.013 0.013 13.628 ERP7←OE 0.193 0.192 0.014 0.014 14.274 ERP8←CR 0.183 0.186 0.024 0.024 7.719
ERP9←CR 0.171 0.170 0.007 0.007 26.140
OS: Original Sample; SM: Sample Mean; SD: Standard Deviation; SE: Standard Error; T: t-Statistics (=|OS/SE|).
Table 5. The test results of path coefficients.
OS SM SD SE T BC→SAT 0.368 0.370 0.069 0.069 5.340
CR→BC 0.800 0.802 0.049 0.049 16.366
OE→CR 0.614 0.625 0.076 0.076 8.123 OE→SAT 0.558 0.554 0.069 0.069 8.120
OS: Original Sample; SM: Sample Mean; SD: Standard Deviation; SE: Standard Error; T: t-Statistics (=|OS/SE|).
the high-tech companies’ perceived ERP benefits and satisfaction. It is the first attempt in literature to address the importance of establishing a proper decision structure for ANP modeling, together with proposing an integra- tive solution framework for use. The results based on users’ voices can provide the ERP vendors with a blue- print to advance the previous decision structures of ANP modeling that only relied on experts’ subjective assess- ments.
Based on the knowledge discovered in the case study, the construct “Operational Efficiencies” (OE) has served as a “source” (root) driver to boost users’ overall satis- faction about ERP implementations. It suggests that if the ERP venders can place the highest priority to the con-
struct OE, it will enhance the enterprise users’ overall satisfaction. Therefore, the ERP vendors should lay more emphasis on the corresponding seven measuring items (ERP1 through ERP7) to help advance the companies’ business capabilities. However, the knowledge discovery has also indicated ERP1 through ERP7 under the con- struct OE not sharing the same importance. The ERP vendors are recommended to employ other proper tech- niques, such as the decision making trial and evaluation laboratory (DEMATEL) [31], to further discover the re- lative importance of the measuring items. As such, the limited resources of a company can be efficiently allotted to the most critical items so as to frog-leap the enterprise capabilities.
In view of the R2 value, BC (64.0%) is higher than CR (37.7%), suggesting that the “Business Competencies” should have higher priority over the “Customer Relations” towards an improvement of the overall satisfaction about ERP implementations. However, this interpretation should be cautious. It would be better if one could further con-duct in a stepwise mode, e.g., implementing with a port-folio that consists of the determinants resulting from CR and BC as well as OE with the DEMATEL.
6. Conclusions
This paper has shed new light on the decision structures and knowledge discovery for ANP modeling for tackling the complex decision problems. We contributed an inte- grative framework with the underlying four-step ration- ales: 1) creating the measuring items for the complex decision problems; 2) applying factor analysis to reduce the complex measuring items into fewer constructs; 3) employing Bayesian network classifier technique to dis- cover the causal directions among constructs; 4) using partial least squares path modeling to test and estimate the causal relationships among the items-constructs. The integrative framework has been satisfactorily implement- ed in Hsinchu Science Park, Taiwan, to discover knowl- edge about high-tech companies’ enterprise resource planning (ERP) benefits and satisfaction. The findings provide pragmatic implications to the ERP venders to help boost the high-tech companies’ business capabili- ties and competitiveness.
[image:7.595.57.288.462.535.2]methods such as fuzzy set theory [41-43], DEMATEL [31,44], TOPSIS [44], goal programming [45], artificial neural network [46] to explore in-depth knowledge for better decisions making. Third, although the proposed framework has been satisfactorily applied to a complex decision issue on users’ perceived ERP benefits and sat- isfaction for high-tech enterprises, the interpretations should not be generalized. Application of the proposed framework to other enterprises in different industries de- serves further study.
7. Acknowledgements
This research was sponsored in part by National Science Council of Taiwan (NSC 101-2221-E-233-010).
REFERENCES
[1] T. L. Saaty, “Decision Making for Leaders: The Analytic Hierarchy Process for Decisions in a Complex World,” RWS Publications, Pittsburgh, 2008.
[2] E. H. Forman and S. I. Gass, “The Analytical Hierarchy Process: An Exposition,” Operations Research, Vol. 49,
No. 4, 2001, pp. 469-487. doi:10.1287/opre.49.4.469.11231
[3] M. Bernasconi, C. Choirat and R. Raffaello Seri, “The Analytic Hierarchy Process and the Theory of Measure- ment,” Management Science, Vol. 56, No. 4, 2010, pp.
699-711. doi:10.1287/mnsc.1090.1123
[4] D. Y. Shee, G. H. Tzeng and T. I. Tang, “AHP, Fuzzy Measure and Fuzzy Integral Approaches for the Appraisal of Information Service Providers in Taiwan,” Journal of Global Information Technology Management, Vol. 6, No.
1, 2003, pp. 8-30.
[5] L. C. Leung, Y. V. Hui and M. Zheng, “Analysis of Com- patibility between Interdependent Matrices in ANP,” The Journal of the Operational Research Society, Vol. 54, No.
7, 2003, pp. 758-768. doi:10.1057/palgrave.jors.2601569 [6] T. L. Saaty, “Decision Making with Dependence and Feed-
back: The Analytic Network Process,” RWS Publications, Pittsburgh, 1996.
[7] W. W. Wu and Y. T. Lee, “Selecting Knowledge Manage- ment Strategies by Using the Analytic Network Process,”
Expert Systems with Applications, Vol. 32, No. 3, 2007, pp. 841-847. doi:10.1016/j.eswa.2006.01.029
[8] T. L. Saaty, “Relative Measurement and Its Generaliza-tion in Decision Making: Why Pairwise Comparisons Are Central in Mathematics for the Measurement of Intangi-ble Factors: The Analytic Hierarchy/Network Process,”
Review of the Royal Spanish Academy of Sciences, Series A, Mathematics, Vol. 102, No. 2, 2008, pp. 251-318. doi:10.1007/BF03191825
[9] T. L. Saaty, “Theory and Applications of the Analytic Net- work Process: Decision Making with Benefits, Opportu-nities, Costs and Risks,” RWS Publications, Pittsburgh, 2005.
[10] M. J. J. Wang and Y. J. Lee, “Applying the AHP Approach
to Evaluate Human Sensitivity to Chromatic Light,” Be-haviour & Information Technology, Vol. 16, No. 6, 1997, pp. 348-358. doi:10.1080/014492997119743
[11] T. L. Saaty, “Fundamentals of the Analytic Network Pro- cess,” The International Symposium on the Analytic Hi-erarchy Process, Kobe,12-14 August 1999, pp. 48-63.
[12] C. H. Wu, S. C. Kao and L. H. Shih, “Assessing the Sui- tability of Process and Information Technology in Sup- porting Tacit Knowledge Transfer,” Behaviour & Infor- mation Technology, Vol. 29, No. 5, 2010, pp. 513-525.
doi:10.1080/01449290903490666
[13] C. W. Lin and H. C. Chang, “Motives of Transfer Pricing Strategies: Systemic Analysis,” Industrial Management & Data Systems, Vol. 110, No. 8, 2010, pp. 1215-1233.
doi:10.1108/02635571011077843
[14] J. Park, K. Shin, T. W. Chang and J. Park, “An Integra-tive Framework for Supplier Relationship Management,”
Industrial Management & Data Systems, Vol. 110, No. 4,
2010, pp. 495-515. doi:10.1108/02635571011038990 [15] M. L. Tseng, R. J. Lin and H. P. Chen, “Evaluating the
Effectiveness of E-Learning System in Uncertainty,” In-dustrial Management & Data Systems, Vol. 111, No. 6,
2011, pp. 869-889. doi:10.1108/02635571111144955 [16] C. W. Lin and C. H. Wang, “A Selection Model for
Au-diting Software,” Industrial Management & Data Systems, Vol. 111, No. 5, 2011, pp. 776-790.
doi:10.1108/02635571111137304
[17] T. L. Saaty and L. G. Vargas, “Decision Making with the Analytic Network Process: Economic, Political, Social and Technological Applications with Benefits, Opportu-nities, Costs and Risks,” Springer, New York, 2006. [18] T. L. Saaty and M. S. Özermir, “The Encyclicon: A
Dic-tionary of Decisions with Dependence and Feedback Ba- sed on the Analytic Network Process,” RWS Publications, Pittsburgh, 2005.
[19] T. L. Saaty and H. S. Shih, “Structures in Decision Mak-ing: On the Subjective Geometry of Hierarchies and Net- works,” European Journal of Operational Research, Vol.
199, No. 3, 2009, pp. 867-872. doi:10.1016/j.ejor.2009.01.064
[20] H. Lee, C. Kim, H. Cho and Y. Park, “An ANP-Based Technology Network for Identification of Core Tech-nologies: A Case of Telecommunication Technologies,”
Expert Systems with Applications, Vol. 36, No. 1, 2009, pp. 894-908. doi:10.1016/j.eswa.2007.10.026
[21] D. Carlucci and G. Schiuma, “Applying the Analytic Net- work Process to Disclose Knowledge Assets Value Crea-tion Dynamics,” Expert Systems with Applications, Vol. 36, No. 4, 2009, pp. 7687-7694.
doi:10.1016/j.eswa.2008.09.041
[22] W. W. Wu, “Linking Bayesian Networks and PLS Path Mo- deling for Causal Analysis,” Expert Systems with Appli- cations, Vol. 37, No. 1, 2010, pp. 134-139.
doi:10.1016/j.eswa.2009.05.021
pp. 234-252. doi:10.1016/j.ejor.2006.01.016
[24] E. R. Hruschka and N. F. F. Ebecken, “Towards Efficient Variables Ordering for Bayesian Networks Classifier,”
Data & Knowledge Engineering, Vol. 63, No. 2, 2007, pp.
258-269. doi:10.1016/j.datak.2007.02.003
[25] T. Wang, J. W. Touchman and G. Xue, “Applying Two- Level Simulated Annealing on Bayesian Structure Learn-ing to Infer Genetic Networks,” 2004 IEEE Computa-tional Systems Bioinformatics Conference Proceedings,
Stanford, 16-19 August 2004, pp. 647-648. doi:10.1109/CSB.2004.1332531
[26] D. Temme, H. Kreis and L. Hildebrandt, “PLS Path Mo- deling: A Software Review,” SFB 649 Discussion Papers, Humboldt University, Berlin, 2006.
[27] M. Tenenhaus, V. E. Vinzi, Y. M. Chatelin and C. Lauro, “PLS Path Modeling,” Computational Statistics and Data Analysis, Vol. 48, No. 1, 2005, pp. 159-205.
doi:10.1016/j.csda.2004.03.005
[28] M. J. Sanchez-Franco, “Exploring the Influence of Gen-der on the Web Usage via Partial Least Squares,” Behav-iour & Information Technology, Vol. 25, No. 1, 2006, pp. 19-36. doi:10.1080/01449290500124536
[29] A. Serenko, N. Bontis and B. Detlor, “End-User Adoption of Animated Interface Agentsin Everyday Work Applica-tions,” Behaviour & Information Technology, Vol. 26, No. 2, 2007, pp. 119-132. doi:10.1080/01449290500260538 [30] Y. F. Su and C. Yang, “A Structural Equation Model for
Analyzing the Impact of ERP on SCM,” Expert Systems with Applications, Vol. 37, No. 1, 2010, pp. 456-469. doi:10.1016/j.eswa.2009.05.061
[31] W. W. Wu, “Choosing Knowledge Management Strate-gies by Using a Combined ANP and DEMATEL Ap-proach,” Expert Systems with Applications, Vol. 35, No. 3, 2008, pp. 825-835. doi:10.1016/j.eswa.2007.07.025 [32] T. Christophersen and U. Konradt, “Development and Va-
lidation of a Formative and a Reflective Measure for the Assessment of Online Store Usability,” Behaviour & In-formation Technology, Vol. 31, No. 9, 2012, pp. 839-857.
doi:10.1080/0144929X.2010.529165
[33] C. Fornell and F. Bookstein, “Two Structural Equations Models: LISREL and PLS Applied to Consumer Exit- Voice Theory,” Journal of Marketing Research, Vol. 19,
No. 4, 1982, pp. 440-452. doi:10.2307/3151718
[34] J. Hulland, “Use of Partial Least Squares (PLS) in Strate-gic Management Research: A Review of Four Recent Studies,” Strategic Management Journal, Vol. 20, No. 2,
1999, pp. 195-204.
doi:10.1002/(SICI)1097-0266(199902)20:2<195::AID-S MJ13>3.0.CO;2-7
[35] B. H. Wixom and H. J. Watson, “An Empirical Investiga-tion of the Factors Affecting Data Warehousing Success,”
MIS Quarterly, Vol. 25, No. 1, 2001, pp. 17-41. doi:10.2307/3250957
[36] R. D. Anderson and G. Vastag, “Causal Modeling
Alter-natives in Operations Research: Overview and Applica-tion,” European Journal of Operational Research, Vol. 156, No. 1, 2004, pp. 92-109.
doi:10.1016/S0377-2217(02)00904-9
[37] C. Ranganathan and V. Sethi, “Rationality in Strategic Information Technology Decisions: The Impact of Shared Domain Knowledge and IT Unit Structure,” Decision Sciences, Vol. 33, No. 1, 2002, pp. 59-86.
doi:10.1111/j.1540-5915.2002.tb01636.x
[38] C. Fornell and D. F. Larcker, “Structural Equation Mod-els with Unobservable Variables and Measurement Error: Algebra and Statistics,” Journal of Marketing Research, Vol. 18, No. 3, 1981, pp. 382-388. doi:10.2307/3150980 [39] E. Jakobowicz and C. Derquennea, “A Modified PLS Path
Modeling Algorithm Handling Reflective Categorical Va- riables and a New Model Building Strategy,” Computa-tional Statistics & Data Analysis, Vol. 51, No. 8, 2007, pp. 3666-3678. doi:10.1016/j.csda.2006.12.004
[40] S. Shang and P. B. Seddon, “A Comprehensive Framework for Classifying the Benefits of ERP Systems,” Proceed-ings of Americas Conference on Information Systems ( AM-CIS 2000), Long Beach, 2000, pp. 1005-1014.
[41] K. F. R. Liu and J. H. Lai, “Decision-Support for Envi-ronmental Impact Assessment: A Hybrid Approach Using Fuzzy Logic and Fuzzy Analytic Network Process,” Ex-pert Systems with Applications, Vol. 36, No. 3, 2009, pp.
5119-5136. doi:10.1016/j.eswa.2008.06.045
[42] J. Razmi, M. S. Sangari and R. Ghodsi, “Developing a Practical Framework for ERP Readiness Assessment Us-ing Fuzzy Analytic Network Process,” Advances in En-gineering Software, Vol. 40, No. 11, 2009, pp. 1168-
1178. doi:10.1016/j.advengsoft.2009.05.002
[43] Y. H. Lin, H. P. Cheng, M. L. Tseng and J. C. C. Tsai, “Using QFD and ANP to Analyze the Environmental Pro- duction Requirements in Linguistic Preferences,” Expert Systems with Applications, Vol. 37, No. 3, 2010, pp. 2186-
2196. doi:10.1016/j.eswa.2009.07.065
[44] J. K. Chen and I. S. Chen, “Using a Novel Conjunctive MCDM Approach Based on DEMATEL, Fuzzy ANP, and TOPSIS as an Innovation Support System for Tai-wanese Higher Education,” Expert Systems with Applica-tions, Vol. 37, No. 3, 2010, pp. 1981-1990.
doi:10.1016/j.eswa.2009.06.079
[45] Y. H. Chang, W. M. Wey and H. Y. Tseng, “Using ANP Priorities with Goal Programming for Revitalization Stra- tegies in Historic Transport: A Case Study of the Alishan Forest Railway,” Expert Systems with Applications, Vol. 36, No. 4, 2009, pp. 8682-8690.
doi:10.1016/j.eswa.2008.10.024
[46] H. R. Yazgan, S. Boran and K. Goztepe, “An ERP Soft-ware Selection Process with Using Artificial Neural Net-work Based on Analytic NetNet-work Process Approach,”
Expert Systems with Applications, Vol. 36, No. 5, 2009,